A vacuum ultraviolet (VUV) spectroscopy with a focal length of 1 m has been engineered specifically for observing edge impurity emissions in Experimental Advanced Superconducting Tokamak (EAST). In this study, wavelength calibration for the VUV spectroscopy is achieved utilizing a zinc lamp. The grating angle and charge-coupled device (CCD) position are carefully calibrated for different wavelength positions. The wavelength calibration of the VUV spectroscopy is crucial for improving the accuracy of impurity spectral data, and is required to identify more impurity spectral lines for impurity transport research. Impurity spectra of EAST plasmas have also been obtained in the wavelength range of 50–300 nm with relatively high spectral resolution. It is found that the impurity emissions in the edge region are still dominated by low-Z impurities, such as carbon, oxygen, and nitrogen, albeit with the application of full-tungsten divertors on the EAST tokamak.
Vacuum ultraviolet (VUV) spectroscopy serves as a vital diagnostic for measuring edge impurity radiations in fusion devices, which is of great significance for studying the behaviour of edge impurities and exploring divertor physics. Various types of VUV spectrometers have been applied in Large Helical Device (LHD) [1, 2], Joint European Torus (JET) [3], and Axially Symmetric Divertor Experiment (ASDEX) Upgrade [4]. A VUV spectroscopic diagnostics system is also planned for International Thermonuclear Experimental Reactor (ITER) [5]. Due to its importance, a space-resolved VUV spectroscopy has also been designed to measure impurity emissions in the divertor region of Experimental Advanced Superconducting Tokamak (EAST) [6, 7]. However, the measurement results provided by visible spectroscopies are not sufficient for the study of impurity transport in divertor region plasmas. The VUV spectrometer can capture the impurity emissions in the divertor region from scrape-off layer (SOL) to last closed flux surface (LCFS), which is of great significance for the study of impurity transport in the divertor region. The VUV spectrometer with short wavelength range of 50–200 nm has been calibrated on the Hefei Light Source (HLS) [7]. In order to improve the accuracy of impurity spectra measurements, it is necessary to calibrate the wavelength of the system before being put into operation. The wavelength calibration can effectively facilitate the identification and verification of spectral lines measured in EAST.
In this study, a zinc lamp was used to calibrate the VUV spectrometer in the wavelength range of 200‒300 nm. This calibration process was conducted within the high vacuum environment of the spectrometer, ensuring compatibility and efficiency. Then, the calibrated spectrometer is used to observe the impurity spectra of EAST plasmas to study the edge impurity behaviour. This paper is organized as follows. Section 2 introduces the parameters of the EAST VUV spectroscopic diagnostics system. Section 3 contains the calibration method of the VUV spectrometer and the calibration results. Section 4 presents the impurity spectral lines observed by the calibrated VUV spectrometer on EAST. This study is summarized in section 5.
2.
Vacuum ultraviolet spectroscopy in EAST
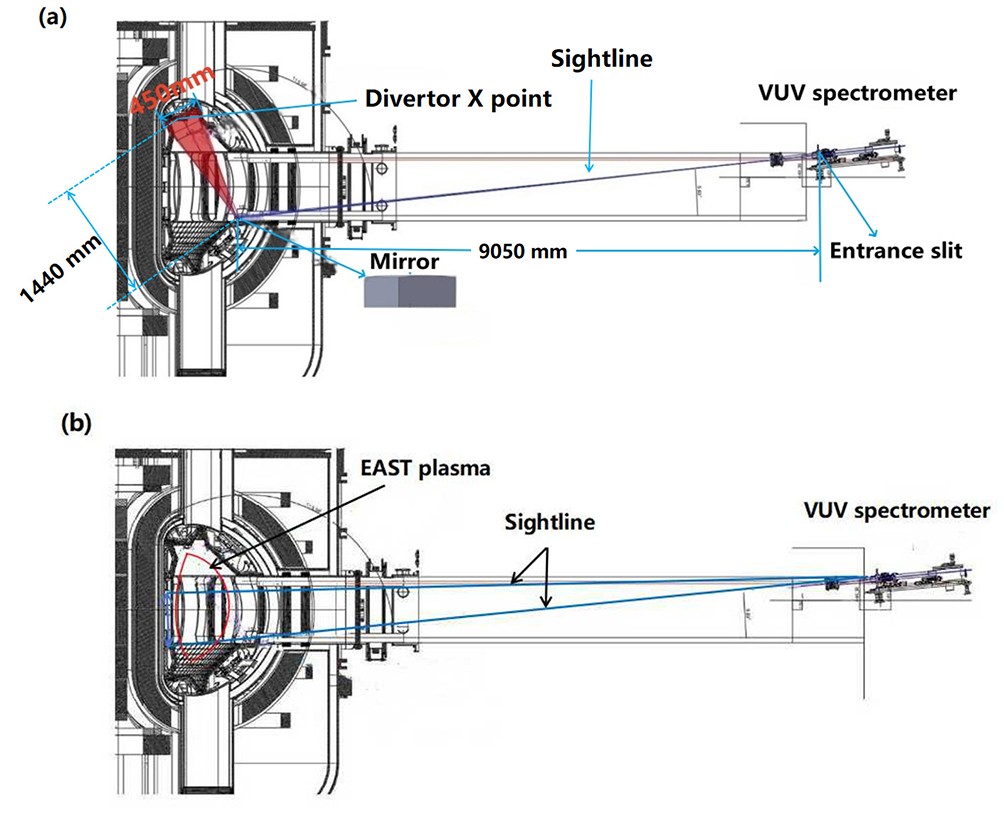
The VUV spectroscopy is installed on the rear of the vacuum extension chamber in EAST. Light emitted by the impurities in the EAST plasma is diffracted by the grating after passing through a slit assembly in the spectrometer. The schematic view of the VUV spectrometer is depicted in figure 1. As shown in figure 1(a), a gold-coated convex mirror is installed at the bottom of the observation window in EAST to reflect impurity radiation from the divertor region towards the VUV spectrometer. The slit of the VUV spectrometer is positioned 9050 mm away from the mirror, providing a large observation range with Z = 450 mm around the X-point. In the recent EAST experimental campaign, the visual field of VUV diagnostic system is mainly distributed in the midplane area of EAST. The accurate spatial position calibration of VUV diagnostic system on EAST has not been carried out. As shown in figure 1(b), the actual observation position of the VUV diagnostic system differs from the intended position. To meet the measurement requirements for impurity radiation with different line dispersion, the spectrometer is equipped with two holographic spherical gratings with different groove densities, namely, grating #1 of 2400 g/mm and grating #2 of 2160 g/mm. A charge-coupled device (CCD) is used as the detector. The detection area of the CCD is 13.3×13.3 mm2, which consists of 1024×1024 pixels with each pixel size of 13×13 μm2. The horizontal direction of 1024 pixels represents the wavelength dispersion, and the 1024 pixels in the vertical direction are the spatial resolution. The CCD can be cooled to −80 °C by an air-cooling system, effectively minimizing the dark current generated by thermal noise.
Figure
1.
The VUV spectrometer layout in EAST. (a) Designed observation area, (b) actual observation area.
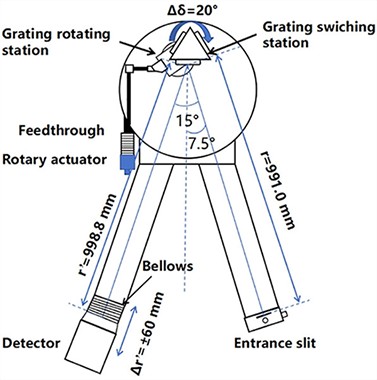
To assure the compactness and resolution of the spectrometer, the space-resolved VUV spectroscopy is designed as an Eagle-type VUV spectrometer [8]. Figure 2 shows the optical schematic diagram of the spectrometer. The distance between the spectrometer slit and the grating center is 991 mm. The angle between the entrance arm and the exit arm is 2K = 15°. As shown in figure 2, the grating support can be rotated by a rotary actuator, which is designed on the basis of sinusoidal driving mechanism. The range of the grating rotation angle is Δδ = 20° [7]. The CCD detector is installed on a displacement station to focus the diffracted light on the CCD during wavelength scanning. The moving range of the displacement station is designed to Δr' = ±60 mm. Similar to the rotary actuator, the displacement station has highly repetitive positioning accuracy and good motion resolution, ensuring stable and accurate focusing. After the measurement wavelength is selected, the rotary actuator can accurately adjust the grating to the target angle. At the same time, the CCD detector is translated to the exact position by the displacement station.
Wavelength calibration is carried out for the VUV spectrometer to establish a precise relationship between the position of the grating sinusoidal mechanism and the focus position of the CCD detector.
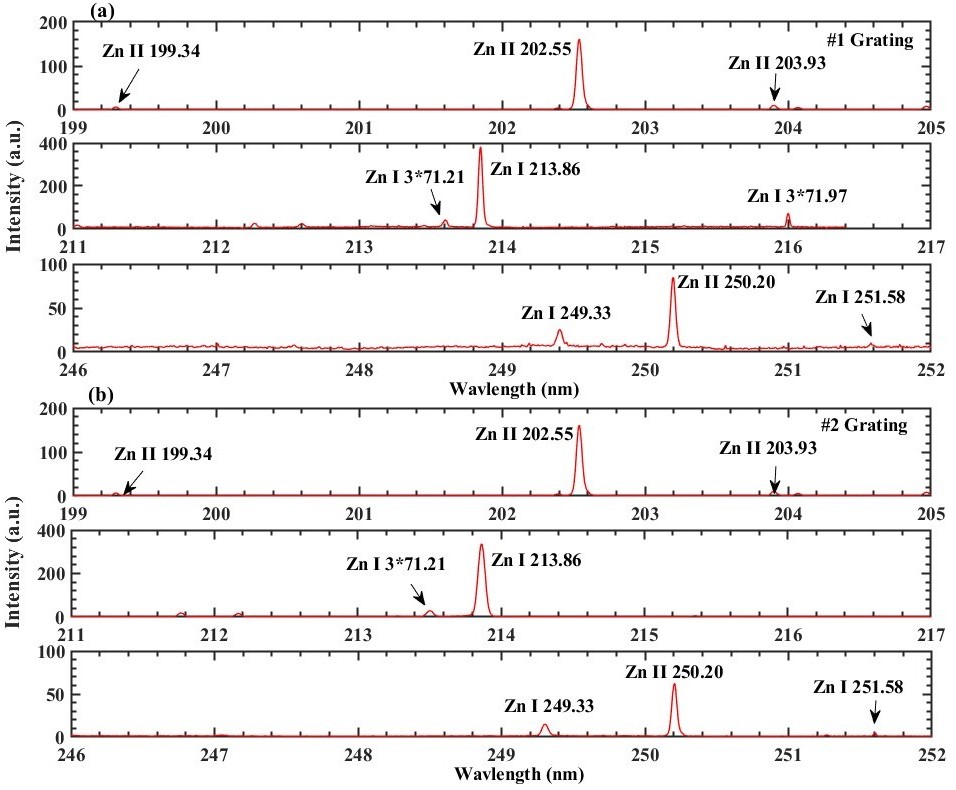
In this study, a BHK Analamps-10K zinc lamp with an operating voltage of 160 V and an operating current of 47.5 mA is used, which has the advantages of low noise and stable output. The zinc lamp is preheated for 1 h before use to ensure stable temperature conditions for testing. To protect the CCD detector from water vapor contamination, it is necessary to maintain a good vacuum environment by placing the spectrometer chamber in a vacuum environment. For the vacuum and measurement consideration, a quartz window is installed on the flange, positioned in front of the slit assembly. The quartz window ensures light transmittance of no less than 85% in the wavelength range of 200‒300 nm. Then, the spectrometer chamber is placed in a vacuum environment (maintained at ~10−4 Pa during the calibrated operation) by a turbo molecular pump system. To minimize the absorption of ultraviolet light by the air, the zinc lamp is placed directly in front of the quartz window. Despite the zinc lamp being in the atmosphere conditions, lights in the wavelength range exceeding 200 nm can pass through the quartz window and reach the grating. Therefore, the wavelength calibration for the spectrometer is conducted in the wavelength range of 200‒300 nm. The relationship between the output wavelength and the position of the grating can be obtained with this method. Besides, the optimal focusing position of the CCD detector is determined by scanning the CCD position. The slit width of the spectrometer is set to 100 μm and the exposure time of the detector is set to 10 s. The zinc lamp’s spectral lines observed by the VUV spectrometer are presented in figure 3, which are identified using the NIST database [9–11].
Figure
3.
The zinc lamp spectral lines observed by the VUV spectrometer. (a) The #1 grating (2400 g/mm) was used for the spectrometer, (b) the #2 grating (2160 g/mm) was used for the spectrometer.
The full width at half maximum (FWHM) of the spectrum is approximately 0.027 nm, with potential for further optimization through slit width adjustments. Within the 30–300 nm wavelength range, the line dispersion falls between 0.418 and 0.468 nm/mm. The linear dispersion increases with the wavelength [7]. Using the CCD with a detection area of 13.3×13.3 mm2 (1024×1024 pixels), the wavelength range of a single observation is 5.5–6.2 nm.
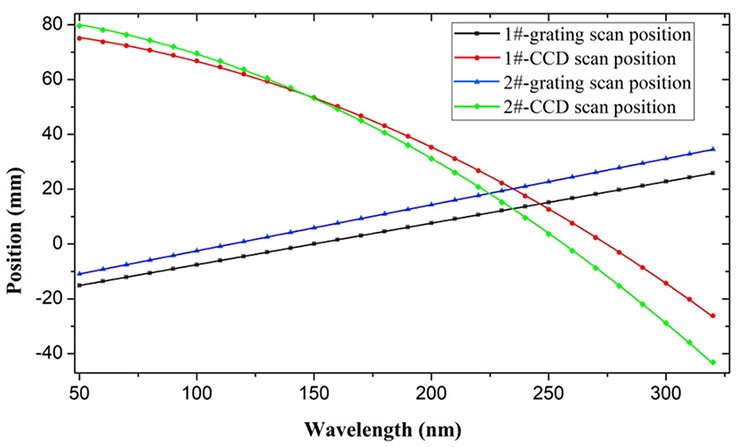
The relationship between the position of the sinusoidal rod scanning stage and the CCD focus position as functions of the wavelengths is shown in table 1, respectively. Figure 4 shows the calibration results of the VUV spectrometer.
Table
1.
Center wavelengths and the actual positions of the grating and CCD.
For the #1 grating, function fitting is performed on the spectrometer test data to obtain the relationship between wavelength and CCD focus position y, which can be described as follows:
y1=79.40613−0.03572×λ−9.23×10⁻⁴×λ2.
(1)
The relationship between the wavelength and the position of the sinusoidal scanning station can be described as follows:
X1=−22.7+0.15158λ.
(2)
For the #2 grating, the relationship between wavelength and CCD focus position can be described as follows:
y2=85.23985−0.04889×λ−0.00111×λ2.
(3)
The relationship between the wavelength and the position of the sinusoidal scanning station can be described as follows:
X2=−19.32+0.16818λ.
(4)
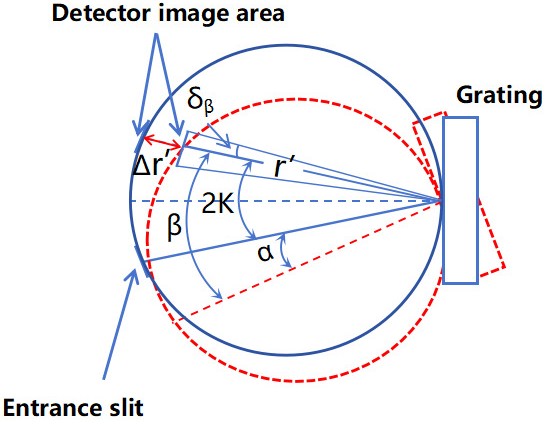
The optical design of the VUV spectrometer is shown in figure 5. The blue part in figure 5 represents the original position of the grating, entrance angle and diffraction angle are equal to K = 7.5°. After the measurement wavelength is selected, the rotary actuator can accurately adjust the grating to the target angle to select the appropriate entrance angle α and diffraction angle β, as shown in red part in figure 5. At the same time, the CCD detector is translated to the exact position to change the length of the exit arm r'. Adjustments to the detector position and rotation of the grating angle can effectively minimize the aberration effect. Additionally, the location of the entrance slit is independent of the wavelength. From figure 5, the diffraction angle δβ corresponding to the pixel in the diffraction direction of CCD can be described as follows:
where δβ is the diffraction angle corresponding to the pixel in the diffraction direction of CCD. P is the pixel position and λ0 is the center wavelength. r' is the length of the exit arm given by:
r′=998.8−Δr′.
(6)
The relationship between the entrance angle α and the diffraction angle β can be expressed as follows:
α−β=2K.
(7)
The grating equation is:
nλ0=σ(sinα+sinβ),
(8)
nδλ =σ[sinα+sin(β+δβ)].
(9)
Therefore, the relation between the wavelength of the pixel position is obtained:
δλ=cos(2K−α)×δβ/σ+λ0.
(10)
4.
Measurement of spectra in EAST
In the recent EAST experimental campaign, the space-resolved VUV spectroscopy has been commissioned to measure the spectra of edge impurity emissions. The slit width of the VUV spectrometer is set to 100 μm, using the #1 grating (2400 g/mm). The full-vertical-binning (FVB) mode is used for spectral measurement to increase the readout speed and signal-to-noise ratio. Under this mode the minimum sampling time can be set to 5 ms per frame. The CCD is typically cooled to −20 °C by the air-cooling system, in order to sufficiently reduce the dark current arising from the thermal noise.
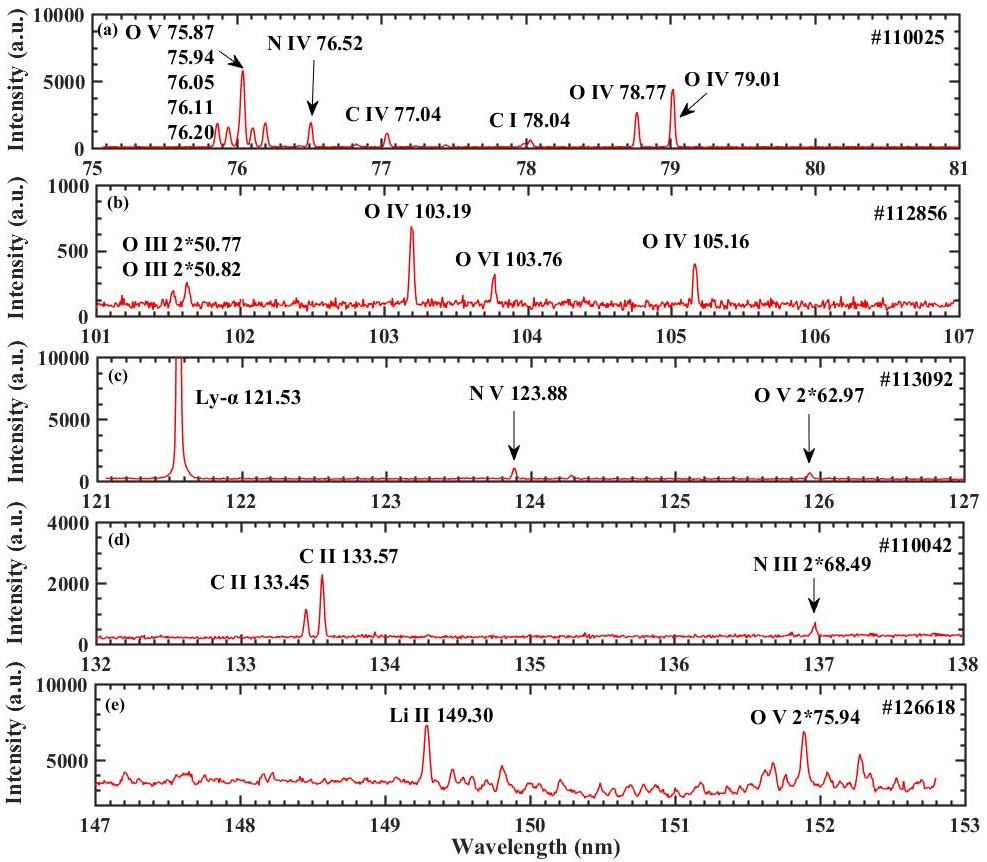
As shown in figure 6, line spectra in the VUV range are observed for several typical impurity species, such as carbon (C), nitrogen (N), and oxygen (O). Figures 6(a)–(e) show the results from shots #110025, #112856, #113092, #110042 and #126618 in EAST, respectively. It is found that the impurity emissions in the plasma edge are still dominated by C, N and O emissions. As shown in figure 6, several strong lines are successfully identified, e.g., O V (76.05 nm), O IV (79.01 nm), C II (133.57 nm) and Ly-α (121.53 nm). Furthermore, certain spectra lines are also used for wavelength calibration, such as Ly-α (121.53 nm), C II (133.45 nm) and C II (133.57 nm). Besides, the second-order spectra of O III (50.77 nm, 50.82 nm), O V (62.97 nm) and N III (68.49 nm) lines are also identified, as shown in figures 6(b)–(d) [11, 12]. For #126618 discharges, because of lithium powder injection, we clearly observed the line of Li II 149.30 nm [12–14].
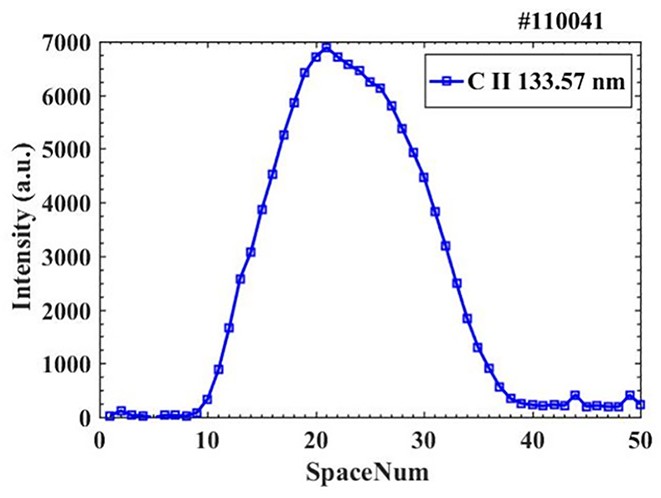
The VUV diagnostic system can also provide the measurement of the spatial profile. In addition, the CCD detector is set to spatially resolved mode (multi-track mode), and the exposure time is set to 10 ms. The space-resolved slit width of 100 μm is used in the present case. In the spatial direction, 20 pixels are consolidated into each channel, and there are 50 channels in total. The intensity profile of C II (133.57 nm) is shown in figure 7. Therefore, it can be concluded that the impurity emissions in the plasma edge region of EAST are still dominated by low-Z impurities, despite the EAST divertors and first wall are covered by tungsten and molybdenum. Figure 8 shows the discharge waveform of shot #110727 in EAST. Besides, as shown in figure 8(g), Ly-α (121.53 nm) from deuterium atoms is also clearly observed. The measurements of Ly-α (121.53 nm) make it possible to analyze neutral particles density distribution in the edge region of EAST plasmas.
Figure
7.
C II 133.57 nm intensity profile of shot #110041.
Figure 9 shows the time evolution of a typical on-axis electron cyclotron resonance heating (ECRH) and resonant magnetic perturbations (RMP) discharge in EAST. The plasma current is 500 kA and the average electron density of central channel is 4.4×10¹⁹ m−3. On-axis ECRH with a total power of 0.75 MW is injected at t = 2.5 s, and the RMP is injected at t = 3 s. The RMP with the mode number n = 1 and a maximum coil current of 2.2 kA is applied during the time of 3–7 s, and RMP phase difference of this discharge is 180°, which is shown in figure 9(e). The electron temperature data is measured by the Electron Cyclotron Emission (ECE) diagnostic system [15], which is shown in figure 9(f). The radiation intensity time behaviour of C VI (3.37 nm) measured by the extreme ultraviolet spectroscopy (EUV) is shown in figure 9(g), which represents the core impurity emissions and figure 9(g) also includes a time evolution of C IV (154.82 nm) spectrum measured by the VUV diagnostic system with time resolution of 5 ms. In this discharge, when on-axis ECRH is injected, the electron temperature slightly increases from 0.8 keV to 1.02 keV. At this time, the emission intensity of CIV decreased slightly, but the core carbon emission of CVI still maintained a rising trend. Until t = 3.75 s, when the RMP current reaches 1.7 kA, the emission of C VI in the core begins to decrease, at the same time, the plasma stored energy also decreases. The core impurities are suppressed with on-axis ECRH injection and the edge impurities can be inhibited by RMP injection. The main physical mechanism is that high electron temperature and its gradient produce by ECRH could increase the turbulent diffusion coefficient of impurity through increasing the growth rate of linear instability of trapped electron mode [16, 17]. Overall, the results confirm the feasibility of the space-resolved VUV spectrometer to study the effects of RMP on the edge impurity concentration based on the measurement of time evolution of impurity emissions.
Figure
9.
The time evolution of shot #113765. (a) Plasma current, (b) line averaged electron density, (c) stored energy, (d) ECRH power, (e) RMP coil current, (f) electron temperature, (g) emission intensity of C VI (3.37 nm) and C IV (154.82 nm).
The wavelength calibration of the space-resolved VUV spectroscopy in EAST is conducted with a zinc lamp. The relationship between the output wavelength and the position of the grating and the CCD detector is determined. The wavelength resolution of the spectrum is approximately 0.027 nm. Within the 30–300 nm wavelength range, the line dispersion ranges from 0.418 to 0.464 nm/mm, with a single data acquisition covering a wavelength interval of 5.5–6.2 nm. The impurity spectra of EAST plasma are also obtained by the calibrated VUV spectroscopy. It is found that the impurity emissions in the edge region of EAST are still dominated by low-Z impurities, e.g., carbon, oxygen, nitrogen. Besides, the observed Ly-α (121.53 nm) spectra of deuterium particles can be used to analyze the density distribution of neutral particles in the edge region of EAST.
Acknowledgments
The authors wish to thank the EAST team. The work was partially supported by National Natural Science Foundation of China (Nos. U23A2077, 12175278 and 12205072), the National Magnetic Confinement Fusion Science Program of China (Nos. 2019YFE0304002 and 2018YFE0303103), the Comprehensive Research Facility for Fusion Technology Program of China (No. 2018-000052-73-01-001228), Major Science and Technology Infrastructure Maintenance and Reconstruction Projects of the Chinese Academy of Sciences (2021), and the University Synergy Innovation Program of Anhui Province (No. GXXT2021-029).
Lin, Z.C., Zhang, H.M., Wang, F.D. et al. Ion temperature and rotation velocity measurements of carbon and boron ions using VUV spectroscopy on EAST. Review of Scientific Instruments, 2024, 95(7): 073525.
DOI:10.1063/5.0214997

 DownLoad: