Figure
1.
The top view of the J-TEXT device.
| Citation: |
Wei XIE, Yunfeng LIANG, Zhonghe JIANG, Yasuhiro SUZUKI, Li LI, Jiankun HUA, Jie HUANG, Alexander KNIEPS, Song ZHOU, Feiyue MAO, Xin XU, Keze LI, Yutong YANG, Ziyang JIN, Cunkai LI, the J-TEXT Team. Application of three-dimensional MHD equilibrium calculation coupled with plasma response to island divertor experiments on J-TEXT[J]. Plasma Science and Technology, 2024, 26(11): 115104. DOI: 10.1088/2058-6272/ad70e1

|
Three-dimensional (3D) equilibrium calculations, including the plasma rotation shielding effect to resonant magnetic perturbations (RMPs) produced by the island divertor (ID) coils, were carried out using the HINT and MARS-F codes on J-TEXT. Validation of 3D equilibrium calculations with experimental observations demonstrates that the shielding effect will prevent the penetration of the edge m/n = 3/1 mode component when the ID coil current is 4 kA, while change the size of magnetic islands once the current exceeds the penetration threshold. This indicates that equilibrium calculations including the plasma rotation shielding effect to RMPs can lead to better agreements with experimental observations compared to the vacuum approximation method. Additionally, the magnetic topology at the boundary undergoes changes, impacting the interaction between the plasma and the target plate. These results may be important in understanding RMP effects on edge transport and magnetohydrodynamic (MHD) instability control, as well as divertor heat and particle flux distribution control.
In the future operation of fusion devices, there is a need for a solution that can withstand the heat from the plasma. Recently, the application of three-dimensional (3D) magnetic topology in controlling the behaviour of edge plasma has garnered widespread attention [1–6]. The heat flux deposition pattern in the divertor configuration has been demonstrated to have a significant correlation with the 3D magnetic topology [7–14]. The island divertor configuration is formed by using the divertor plate to cut off the boundary magnetic island. In this configuration, core heat flux and impurity particles are directed towards the divertor plate along the cut-off position of the magnetic island. Due to the longer magnetic field line connections within the island region, the path of particle movement becomes elongated. During this extended path, heat flux can effectively diffuse, thereby reducing the peak thermal load [10]. But the plasma response can affect the 3D magnetic topology, and numerous models related to plasma response have been developed. The main types include linear models [15, 16], which are simple in form and fast in computation, and nonlinear models [17–19], which have a broader range of applicability and provide more comprehensive descriptions but consume more computational resources. Currently, 3D magnetic topology calculations that consider plasma response have been applied to many devices, such as EAST [20], KSTAR [21], HL-2A [22], DIII-D [23], and W7-X [10]. Additionally, the 3D geometry of the edge magnetic field, which interacts with the plasma, differs significantly from vacuum assumptions [10, 24]. Therefore, understanding the plasma response to the island divertor structure and heat flux density distribution is one of the most important issues in exploring divertor optimization.
The rotation shielding effect is an important aspect of plasma response. Due to the perpendicular motion of electrons Ve⊥, cutting across the resonant perturbation field lines induces surface currents that shield the resonant magnetic perturbation (RMP) [25, 26]. The degree of RMP shielding is mainly affected by MHD modes, the slip frequency between MHD and RMP, and the resistivity on the resonant surface. Currently, many related studies have been conducted. For example, numerical simulations have found a linear relationship between the error field penetration threshold and the perpendicular electron flow frequency [27]. The RMP coil current, the rotation frequency of the RMP magnetic field, and the plasma resistivity all significantly affect the RMP field penetration, thereby altering the depth to which the magnetic field lines penetrate the edge region of the plasma [22]. By altering the MHD frequency through neutral beam injection (NBI), the error field penetration threshold can be affected [28]. When this shielding effect is strong, it may prevent the formation of 3D magnetic topology at the boundary.
Currently, several analysis models that incorporate RMP have been developed worldwide, including equilibrium calculation programs such as the ideal non-linear MHD model VMEC [29] and the non-linear resistive MHD model HINT [19]. Plasma response solving programs include the two-fluid resistive MHD model M3D-C1 [30], the single-fluid resistive MHD model MARS [31], and the ideal plasma response MHD model IPEC [16]. In this study, we utilize the extended version of the MARS code, MARS-F [31], to assess the impact of resistive plasma rotation shielding on RMP penetration. Subsequently, we employ the HINT code to self-consistently solve the 3D equilibrium equations, providing a more accurate representation of the 3D magnetic topology.
The numerical models of HINT and MARS-F are introduced in section 2. Section 3 presents the numerical results of 3D equilibrium considering the shielding effect, comparing them with experimental observations and simulations without considering the shielding effect. The conclusion and discussion are drawn in section 4.
In this study, we primarily utilized two codes, MARS-F and HINT. Following the introduction of external resonant coil fields, the plasma response considering the rotation shielding effect was computed using MARS-F. Subsequently, the obtained total perturbation field, along with the initial two-dimensional equilibrium provided by EFIT, was fed into the HINT code to derive the ultimate 3D equilibrium results.
The MARS-F code is designed to compute the linear plasma response within the framework of the single-fluid, resistive MHD approximation. This model can be described by [31]:
| {\mathrm{i}}\left({\varOmega }_{\mathrm{R}\mathrm{M}\mathrm{P}}+n\varOmega \right){\boldsymbol{\xi}} ={\boldsymbol{v}}+\left({\boldsymbol{\xi}} \cdot \nabla \varOmega \right)R\hat{\phi }, | (1) |
| {\mathrm{i}}\rho \left({\varOmega }_{\mathrm{R}\mathrm{M}\mathrm{P}}+n\varOmega \right)=-\nabla p+\boldsymbol{j}\times \boldsymbol{B}+\boldsymbol{J}\times \boldsymbol{b} |
| -\rho \left[2\varOmega \hat{Z}\times \boldsymbol{v}+(\boldsymbol{v}\cdot \nabla \varOmega )R\hat{\phi }\right]-\rho {\kappa }_{\parallel }\left|{k}_{\parallel }{v}_{\mathrm{t}\mathrm{h},\mathrm{i}}\right|{\left[\boldsymbol{v}+\left({\boldsymbol{\xi}} \cdot \nabla \right){\boldsymbol{V}}_{0}\right]}_{\parallel }, | (2) |
| {\mathrm{i}}\left({\varOmega }_{\mathrm{R}\mathrm{M}\mathrm{P}}+n\varOmega \right){\boldsymbol{b}}=\nabla \times \left(\boldsymbol{v}\times \boldsymbol{B}\right)+\left(\boldsymbol{b}\cdot \nabla \varOmega \right)R\hat{\phi }-\nabla \times \left(\eta \boldsymbol{j}\right), | (3) |
| {\mathrm{i}}\left({\varOmega }_{\mathrm{R}\mathrm{M}\mathrm{P}}+n\varOmega \right){{p}}=-{\boldsymbol{v}}\cdot \nabla P-\Gamma P\nabla \cdot {\boldsymbol{v}}, | (4) |
| {\boldsymbol{j}}=\nabla \times {\boldsymbol{b}}. | (5) |
In the provided framework, we give a toroidal rotation {\boldsymbol{V}}_{0}=R\varOmega \hat{\phi } , where R is the plasma major radius, \hat{\phi } is the unit vector along the geometric toroidal angle ϕ of the torus. \hat{Z} is the unit vector in the vertical direction in the poloidal plane. {\varOmega }_{\mathrm{R}\mathrm{M}\mathrm{P}} denotes the excitation frequency of the RMP field, and n is the toroidal harmonic number. For the linear response of axisymmetric equilibria, consideration is given to a single n only. The plasma resistivity is denoted by η. The variables {\boldsymbol{\xi}} , v, b, j and p represent the plasma displacement, perturbed velocity, magnetic field, current, and pressure, respectively. Equilibrium plasma density, field, current, and pressure are denoted by ρ, B, J and P, respectively. The final term in equation (2) accounts for the impact of parallel sound wave damping, where κ represents a numerical coefficient determining the damping strength. {k}_{\parallel }=(n-m/q)/R is the parallel wave number, where m is the poloidal harmonic number, and q is the safety factor. {v}_{\mathrm{t}\mathrm{h},\mathrm{i}} signifies the thermal ion velocity. This damping term does not play a significant role in the response of low-beta plasmas.
It is important to note that for RMP response modelling, the divergence-free condition for the total field perturbation b in the plasma region is considered by replacing one of the equations in Ohm’s law (3) with \nabla⋅b = 0. The plasma-vacuum interface conditions involve the continuity of the normal component of the field b and the total perturbed pressure balance condition, both of them are satisfied through comprehensive solutions across all regions.
HINT employs a two-step relaxation method to solve for a non-linear, single-fluid, resistive MHD equilibrium [32].
The first step involves a plasma pressure relaxation process, conducted with a fixed magnetic field B, to satisfy a parallel pressure balance condition B⋅\nabla p = 0, the condition is equivalent to having no pressure gradient along the magnetic field. In the HINT code, rather than directly calculating B⋅\nabla p = 0, an averaged plasma pressure on a flux tube is computed.
The second step involves a magnetic field relaxation process, conducted with a fixed pressure p (obtained in the first step). In this step, the magnetic field is decomposed into two terms, B = B0+B1, where B0 is the vacuum magnetic field and B1 is the equilibrium response field. B0 remains fixed during the relaxation process. Convective and viscous terms are omitted from the equation of motion. Based on these assumptions, a set of artificial dissipative MHD equations is derived [19]:
| \frac{\partial \boldsymbol{v}}{\partial t}=-\nabla p+{\boldsymbol{j}}_{1}\times \left({\boldsymbol{B}}_{0}+{\boldsymbol{B}}_{1}\right), | (6) |
| \begin{split}\frac{\partial {\boldsymbol{B}}_{1}}{\partial t}=&\nabla \times [{\boldsymbol{v}}\times ({\boldsymbol{B}}_{0}+{\boldsymbol{B}}_{1})-\eta ({\boldsymbol{j}}_{1}-{\boldsymbol{j}}_{\mathrm{n}\mathrm{e}\mathrm{t}}\left)\right]\\& +{\kappa }_{\mathrm{d}\mathrm{i}\mathrm{v}B}\nabla \nabla \cdot {\boldsymbol{B}}_{1},\end{split} | (7) |
| {\boldsymbol{j}}_{1}=\nabla \times {\boldsymbol{B}}_{1}. | (8) |
The dissipative parameter η is assumed to be constant throughout the calculation. The final term in equation (7) represents a divergence cleaning term, where {\kappa }_{\mathrm{d}\mathrm{i}\mathrm{v}B} is a small constant. The term {\boldsymbol{j}}_{\text{net}} signifies the net toroidal current, such as Ohmic or bootstrap current, and is defined by:
| {\boldsymbol{j}}_{\text{net}}=B\frac{\langle\boldsymbol{j}\cdot \boldsymbol{B}{\rangle}_{\text{net}}}{{B}^{2}}. | (9) |
Brackets ⟨…⟩ indicate the flux surface average. The profile of {\boldsymbol{j}}_{\text{net}} is prescribed and remains fixed throughout the calculation. The final equilibrium state is achieved through an iterative process involving these two steps until d/dt → 0 for both v and B, a 3D MHD equilibrium is obtained as a state that is an Ohmic steady state.
HINT inputs the vacuum RMP field superimposed with the initial 2D equilibrium magnetic field to obtain B0 for performing the 3D equilibrium calculation. During this process, the shielding effect of plasma rotation on the RMP field is not considered. We use MARS-F to calculate the shielding effect first and then replace the originally input vacuum RMP field in HINT with the total field obtained (including the response field and the RMP vacuum field).
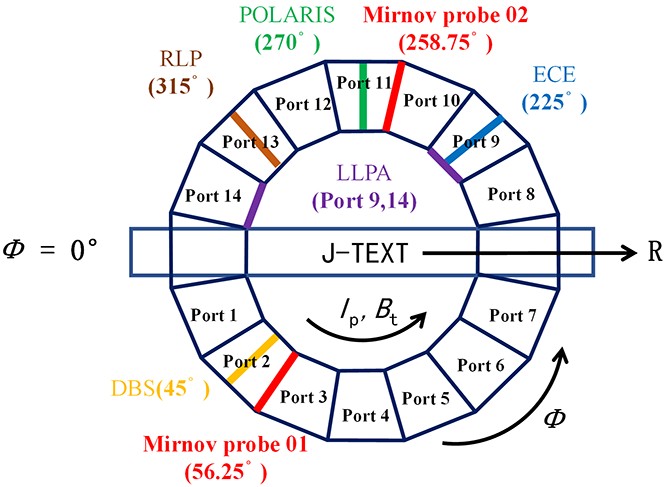
J-TEXT is a conventional medium-sized tokamak with a major radius of R0 = 1.05 m and minor radius of a = 0.25–0.29 m [33]. There are four limiters in the experiment, one fixed at the high field side (HFS) with a distance of a = 0.296 m from the centre of the vacuum chamber [34]; and three movable local limiters (at top, bottom and the low-field side (LFS)) placed at the minor radii of 0.255 m. Figure 1 illustrates the various diagnostic instruments and their spatial relationships. The Doppler backward scattering (DBS) system (yellow) is located at port 2, positioned at toroidal angle of 45°. It is primarily used to measure the vertical rotation velocity of the plasma. The Mirnov probe system (red) consists of a set of toroidal arrays and two sets of poloidal arrays. The positions of the two poloidal arrays are indicated in the diagram, located at toroidal angles of 56.25° and 258.75° respectively. These probes are used to measure various parameters of the magnetic field signal, including mode, frequency, and phase information. The electron cyclotron emission (ECE) system (blue) is located at port 9, positioned at toroidal angle of 225°, providing information on the electron temperature of the plasma. The polarimeter-interferometer system (POLARIS) is located at port 11, positioned at toroidal angle of 270°, providing information on the density distribution of the plasma. The reciprocating Langmuir probe (RLP) at port 13 is employed to measure electron density ne, electron temperature Te, electron pressure Pe = Tene, floating potential Vf and radial electric field Er at the plasma edge. The limiter Langmuir probe array (LLPA) system (purple) is located at ports 9 and 14, primarily used for measuring the ion saturation current and floating potential on the target plates [35].
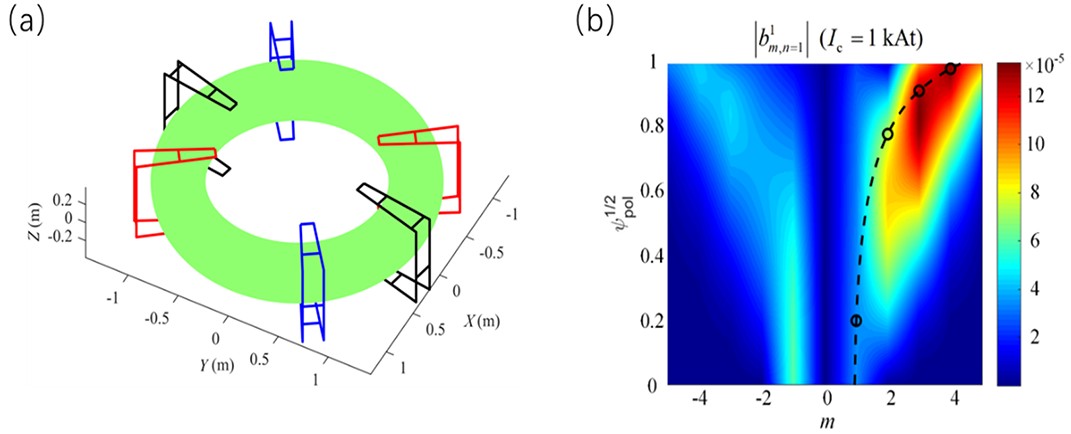
Recently, J-TEXT has developed a set of island divertor (ID) coils [36–38]. Figure 2(a) illustrates the spatial arrangement of the coils and the experimental setup, while figure 2(b) depicts the spectral diagram corresponding to the coil. The coil system primarily consists of six saddle coils, predominantly featuring the n = 1 mode component. The m/n = 1/1 and 2/1 mode components are minimal, while the m/n = 3/1 and 4/1 mode components are significant. These coils are primarily utilized to construct the island divertor configuration.
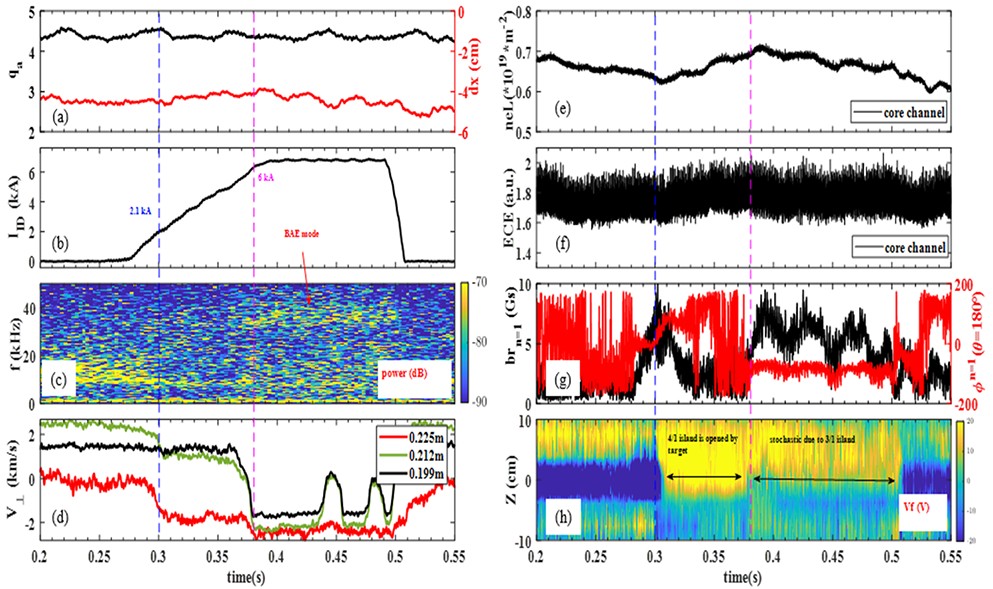
An example of the application of ID coils is shown in figure 3 for the discharge #1079624. The plasma is shifted 4 cm towards the HFS in order to be only limited by the HFS target plate, and its parameters keep nearly constant before t = 0.28 s, plasma current Ip = 120 kA, toroidal magnetic field Bt = 1.7 T, the edge safety factor qa = 4.2. The ID coil current is applied at 0.28 s, ramps up to the flattop of 6.5 kA at 0.4 s, and maintained for 100 ms. First field penetration occurs at t = 0.3 s as indicated by the abrupt change in the amplitude and phase of the locked mode probe signal in figure 3(g), the vertical rotation velocity at r = 0.225 m comes from 0 to 2 km/s in ion diamagnetic direction (red curve in figure 3(d)). Simultaneously, the distribution of floating potential Vf measured by the HFS probe array changes firstly, as depicted in figure 3(h). We believe that the plasma experiences m/n = 4/1 mode penetration at this moment, and a 3D edge magnetic structure interacts with the HFS target plate due to appearance of m/n = 4/1 magnetic island. Subsequently, the coil current further increases, reaching 6 kA at 0.38 s (corresponding to the purple vertical dashed line in the figure). During this period, the central line-integrated electron density neL starts to increase from 0.63×10¹⁹ to 0.7×10¹⁹ m−2 (figure 3(e)), representing a relative change of 11%. The electron temperature remains relatively unchanged near the plasma core, as shown in figure 3(f). At this moment, we can observe a plateau around 30 kHz in the magnetic spectrum (figure 3(c)) from a Mirnov coil. Extensive research conducted by the J-TEXT team has demonstrated that the aforementioned high-frequency mode is attributed to the beta Alfvén eigenmode (BAE) and exhibits a strong correlation with the formation of the 3/1 magnetic island [39, 40]. The BAE mode can persist throughout the plateau period of the coil current. At the same time, the amplitude and phase of the radial magnetic field response, as well as the floating potential Vf exhibit second changes, and vertical rotation velocities at r = 0.212 m and 0.199 m (near the m/n = 3/1 rational flux surface) change from electron diamagnetic direction to ion diamagnetic direction. Therefore, we conclude that the plasma experiences a 3/1 mode penetration at t = 0.38 s. Edge stochastic occurs due to overlap of the m/n = 3/1 island and the m/n = 4/1 island at this moment, which can be determined in vacuum assumption calculation with 6 kA ID coil current. This will affect the interaction between edge plasma and target plate, leading to the change of distribution of Vf measured on the HFS probes.
Figure 3(d) shows the time evolution of the plasma perpendicular magnetic field direction rotation speed, as measured by the DBS. When the penetration of the m/n = 4/1 mode occurs (t = 0.3 s), the rotation speed at positions near the m/n = 4/1 rational flux surface, at r = 0.225 m (red line) and r = 0.212 m (green line), abruptly transitions from electron diamagnetic direction to ion diamagnetic direction. However, at positions near the m/n = 3/1 rational flux surface, at r = 0.199 m (black line), there is no significant change observed. After the penetration of the m/n = 4/1 mode and before the penetration of the m/n = 3/1 mode (0.3 s < t < 0.38 s), the rotation speed of the plasma at each radial position remains on a respective plateau. At t = 0.38 s, the rotation speed at each radial position undergoes another rapid transition towards the ion diamagnetic direction. Subsequently, the rotation speed at each position flattens out, but the flattened rotation speeds near the two magnetic surfaces are different. In this context, we believe that the changes in plasma rotation shielding effects correlate strongly with the alterations in magnetic topology after the introduction of RMP.
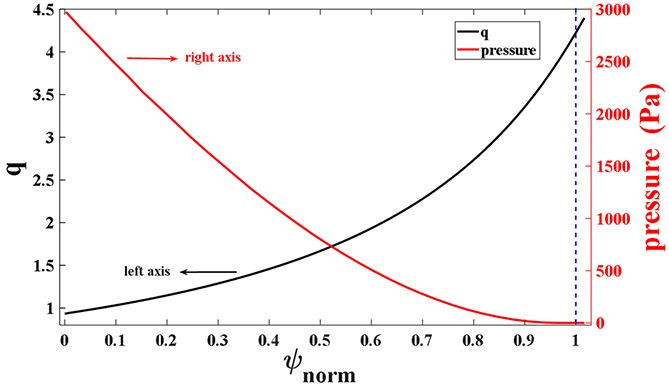
Two selected shots are used for modelling, their plasma current Ip = 135 kA and toroidal magnetic field Bt = 1.7 T are the same. The ID coil current is maintained at 4 kA and 6 kA, respectively, to maintain the flat top. The detailed parameters will be presented later. The initial radial profiles for the safety factor q and pressure p were calculated by the EFIT code, as shown in figure 4. The abscissa is the normalized minor radius. The magnetic axis pressure p0 is about 3 kPa, and the edge safety factor qa is about 4.22.
We use the MARS-F code to model the linear response of the plasma to the RMP fields considering experimental conditions. Finally, we use the 3D equilibrium code HINT to compute plasma equilibrium with the linear response calculated by MARS-F.
For the discharge #1080510, the RMP fields were switched on at t = 0.23 s, and then maintained at 4 kA between 0.26 s and 0.4 s, finally turned off at t = 0.43 s, as shown in figure 5(a). For the case of IID = 4 kA, we did not observe the BAE mode in figure 5(b), indicating that the m/n = 3/1 did not penetrate. After the RMP fields were switched on, near the m/n = 4/1 rational flux surface, at the boundary positions of r = 0.223 m (orange line) and r = 0.201 m (purple line), the rotation speed decreases and becomes flattened as shown in figure 5(c), near the m/n = 3/1 rational flux surface, the rotation speed slightly decreases at r = 0.184 m (green line), but there is no significant change at r = 0.171 m (blue line). At the same time, we observe abrupt changes in Vf and Is, but the radial magnetic field response measured by the locked mode probe shows no significant alteration in amplitude and phase. In summary, when the RMP current is 4 kA, the m/n = 3/1 did not penetrate, while penetration of the m/n = 4/1 is a possibility. As shown in figure 5(f), the sawtooth oscillations did not disappear after adding the ID coil current, and the m/n = 2/1 did not penetrate.
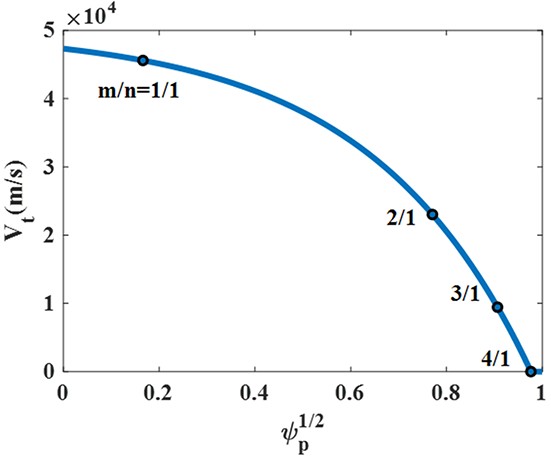
In the MARS-F calculations, we set the resistivity η = 1.4 × 10⁻⁷ and the toroidal rotation frequency ω0 = 3%ωA. Note that the plasma resistivity is normalized in such a way, that the dimensionless resistivity in MARS-F input is exactly equal to the inverse of the Lundquist number S = τR/τA with τR = μ0a2/η and τA = R0/vA. The toroidal rotation profile is shown in figure 6. We reference the vertical rotation velocity measured by DBS in the above experimental analysis and set the rotation velocity to 0 at and outside the m/n = 4/1 rational flux surface.
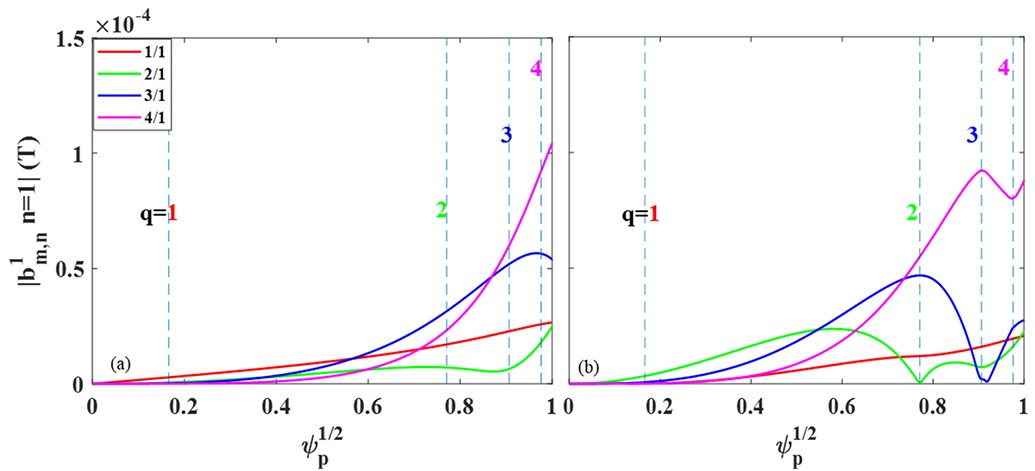
Figure 7(b) shows the magnetic field components of the total perturbation field calculated by MARS-F (including the RMP field and plasma response). Comparing with the vacuum field in figure 7(a) considering the plasma rotation shielding effect, we observed that the m/n = 1/1 component (red solid line) shows minor variations due to its inherently small contribution from the ID coils. The m/n = 2/1 (green solid line) and 3/1 (blue solid line) components exhibit significant reductions due to plasma rotation shielding effect, while the m/n = 4/1 component (pink solid line) shows a slight decrease.
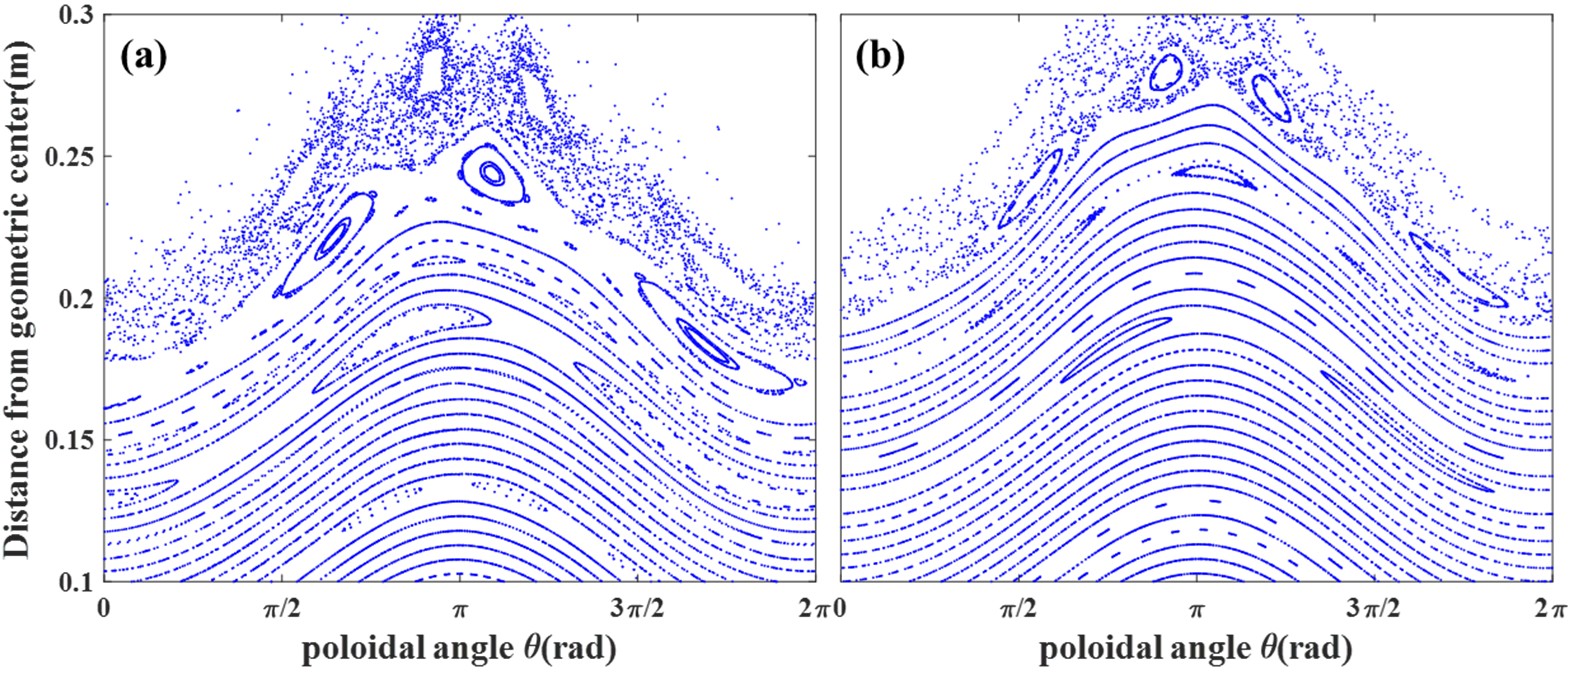
In the previous HINT calculations, the introduction of the perturbation field only involved the vacuum RMP field, without considering the influence of plasma rotation shielding on the RMP field. Figure 8 shows the Poincaré plots obtained from HINT calculations for these two scenarios. When considering the rotational shielding effect with IID = 4 kA, in figure 8(b), we observed a significant reduction in width of the m/n = 2/1 magnetic island. The boundary m/n = 3/1 magnetic island is greatly reduced to almost disappearing, leading to a pronounced change in the boundary magnetic topology, some sideband mode structures disappear, and the degree of stochasticity decreases.
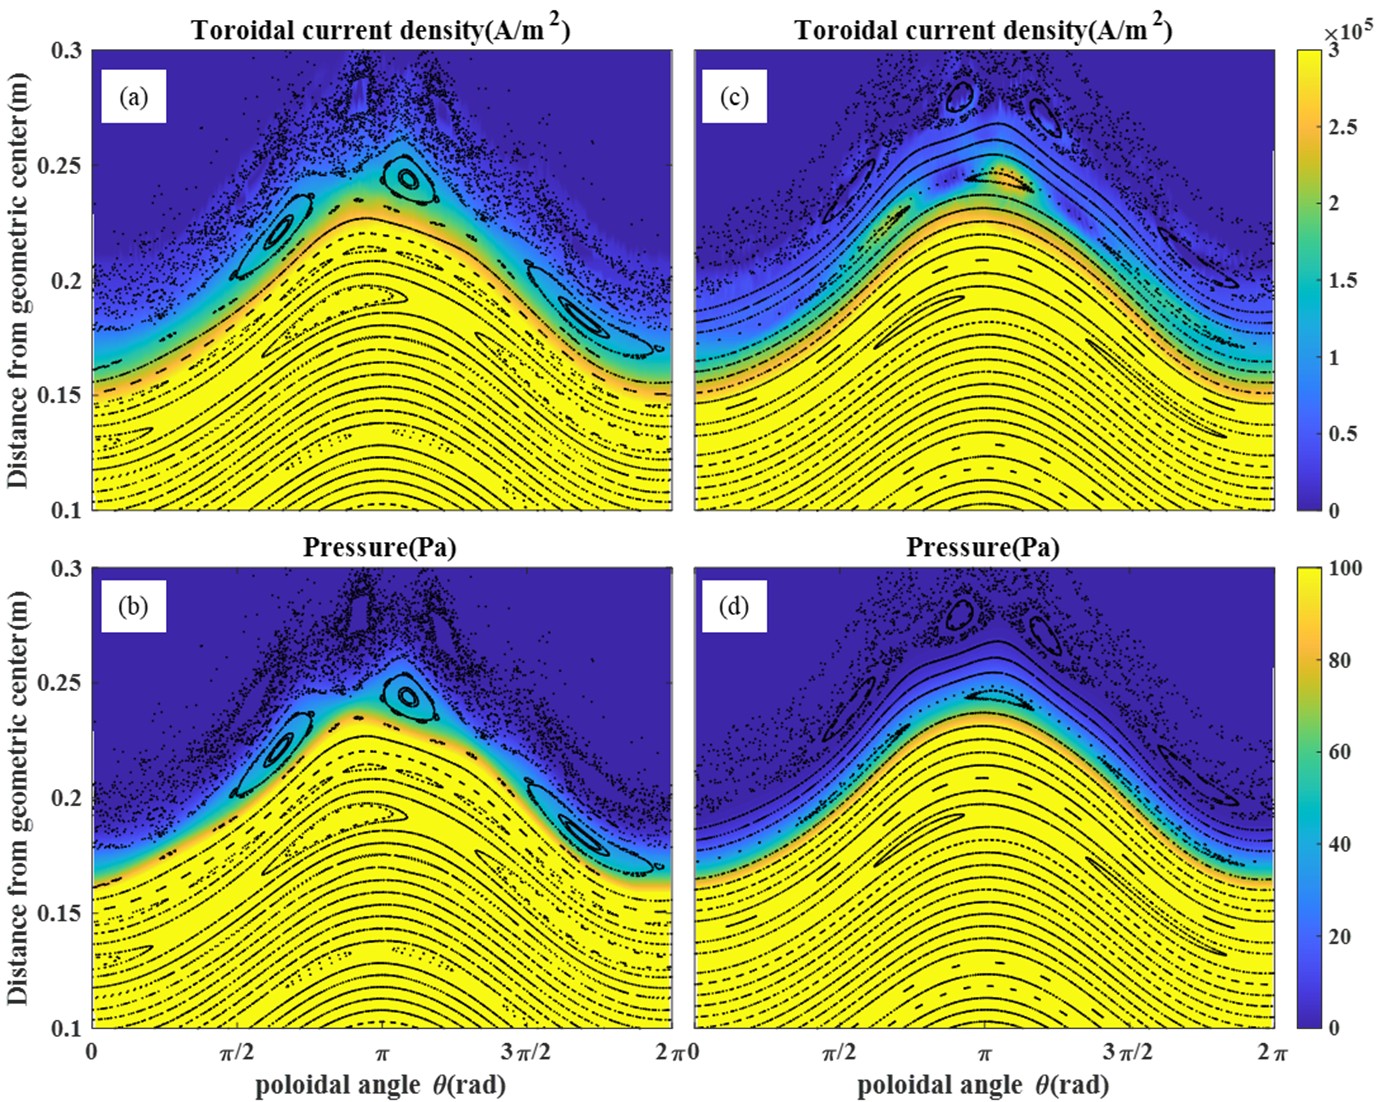
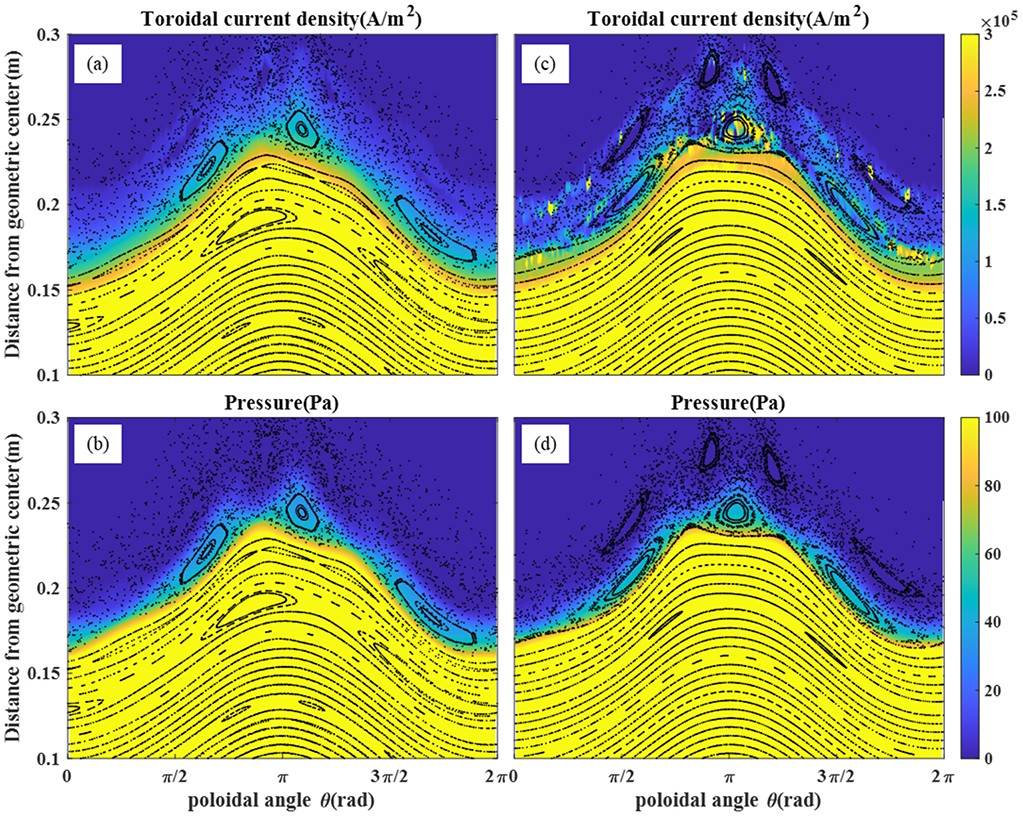
Figure 9 presents contour plots of pressure distribution and toroidal current density. We can observe how the changes in the magnetic island structure affect the distribution of pressure and toroidal current density by HINT calculation. In figure 9(a), comparing the vacuum field results with the results considering the response (c), it is observed that there is a change in the current density near the O-point of the m/n = 3/1 island. This is attributed to the partial penetration resulting from the residual m/n = 3/1 component. In figure 9(b), it is observed that the distribution of pressure parameters changes insignificantly within the magnetic island, but there is a gradual change along the radial direction outside the m/n = 3/1 magnetic island. However, in figure 9(d), this phenomenon disappears as the m/n = 3/1 magnetic island almost vanishes.
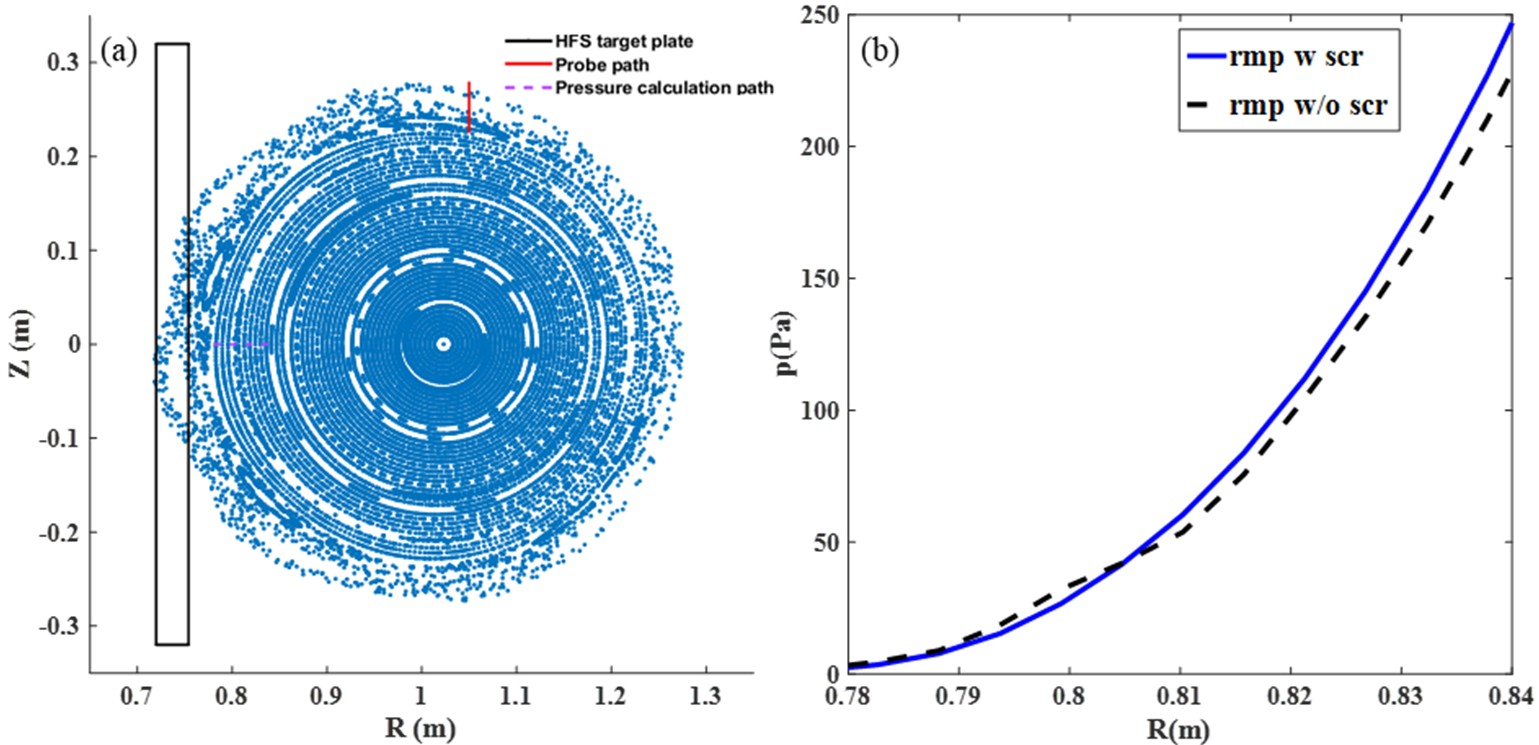
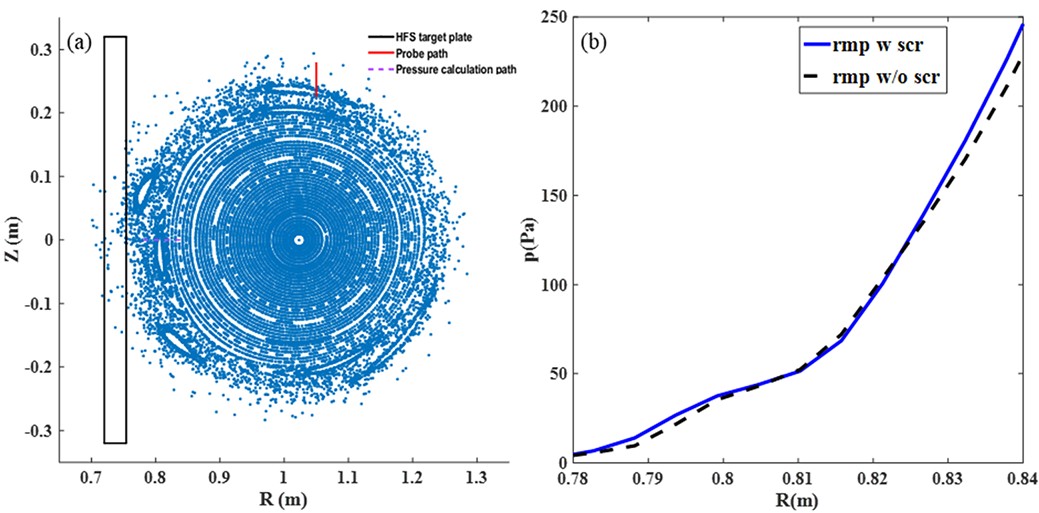
Figure 10(a) shows the Poincaré plot at Φ = 315° when IID = 4 kA, considering the plasma rotation shielding effect, along with the positions of the target plate (black line) and schematic diagrams of the reciprocating Langmuir probe (RLP) measurement paths (red line), which passes through the m/n = 4/1 magnetic island. The purple dashed line passes through the O-point of the m/n = 3/1 magnetic island at the height of the HFS plane. The pressure calculation results at this position are shown in figure 10(b). We observed that when considering only the vacuum RMP equilibrium calculation (black dashed line), the pressure flattens at the corresponding position due to the generated m/n = 3/1 magnetic island. However, when considering the plasma rotation shielding effect (blue solid line), as the m/n = 3/1 magnetic island almost disappears, the pressure at this position regains its gradient.
We used the RLP installed at the toroidal angle position Φ = 315° to measure the boundary distribution of electron temperature Te, density ne, and pressure Pe = Tene. The measured results are compared with the calculated magnetic flux line connection lengths at corresponding positions in figure 11. Possibly because the m/n = 4/1 magnetic island is too small, we did not observe a significant flattening of electron pressure regions when the RMP coil current was at 4 kA. Both electron density and temperature maintained certain gradients. However, compared to the results without coil current in the limiter configuration, the electron temperature (Te) and electron pressure (Pe) have significantly decreased. Additionally, calculations of magnetic field line connection lengths indicate that the m/n = 4/1 magnetic island was not severed by the target plate, no residual magnetic island structures are observed.
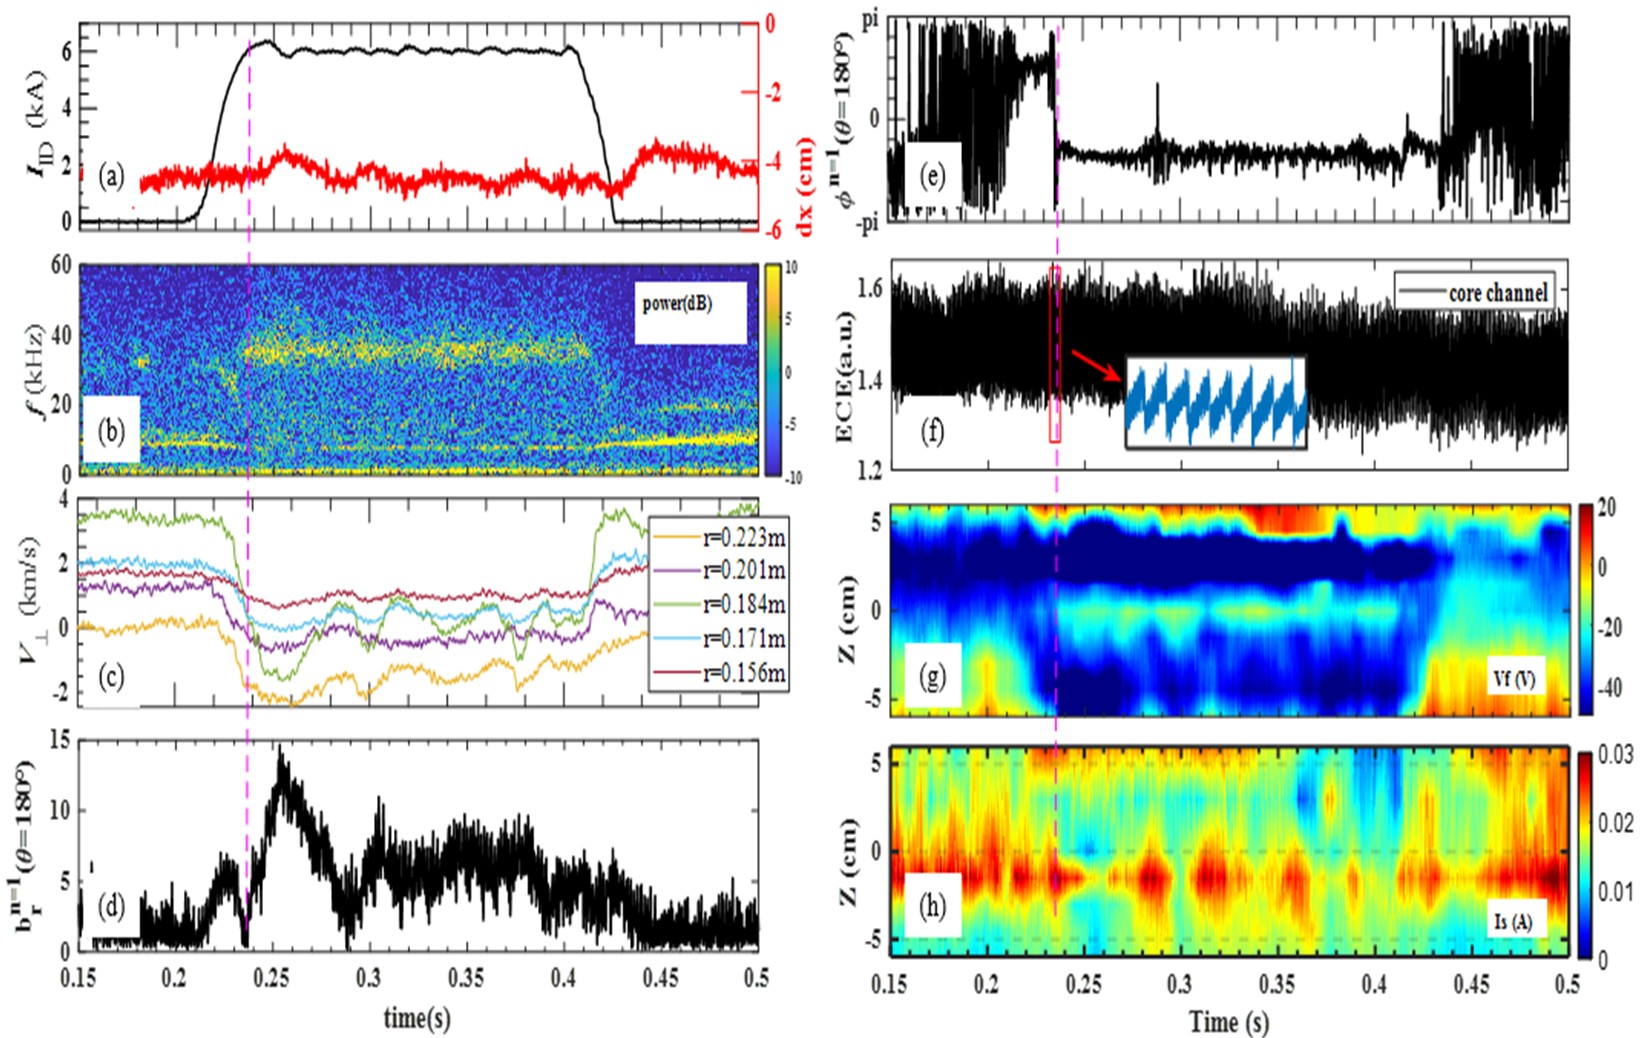
Figure 12 illustrates the time evolution of various plasma parameters during the discharge #1080473, the RMP coil current was increased from 4 to 6 kA. The RMP fields were switched on at t = 0.2 s, and ramped up quickly to the RMP coil current of 6 kA within a duration of 160 ms and finally turned off at t = 0.427 s, as shown in figure 12(a). In the poloidal spectrum of magnetic perturbation signals measured by the Mirnov probes as shown in figure 12(b), based on the analysis mentioned in figure 3(c), high-frequency mode about 30 kHz is attributed to the BAE mode and exhibits a strong correlation with the formation of the 3/1 magnetic island, so we believe that there was a penetration of the m/n = 3/1 mode here. Figure 12(c) illustrates the plasma vertical magnetic field line direction rotation speed. At t = 0.23 s, near the m/n = 4/1 rational flux surface, the rotation of the plasma vertical magnetic field line direction at the boundary positions of r = 0.223 m (orange line) and r = 0.201 m (purple line) undergoes a sudden transition from electron diamagnetic to ion diamagnetic direction. The rotation speeds at positions of r = 0.184 m (green line) and r = 0.171 m (blue line) near the m/n = 3/1 rational flux surface are also flattened. After the removal of the perturbation field (t > 0.427 s), the plasma rotation at various radial positions returns to the horizontal state observed before the application of the perturbation field. Figures 12(d) and (e) present the radial magnetic field response amplitude and phase measured by the locked mode probe for the n = 1 mode. Figures 12(g) and (h) present the time evolution of the floating potential (Vf) and the ion saturation current (Is) along the HFS target plate. We observed that after the introduction of RMP, both of them undergo significant abrupt changes after t = 0.23 s, indicating a notable alteration in the boundary magnetic topology. In summary, penetration of both the m/n = 4/1 and 3/1 resonant perturbation fields occurs when the RMP current is 6 kA.
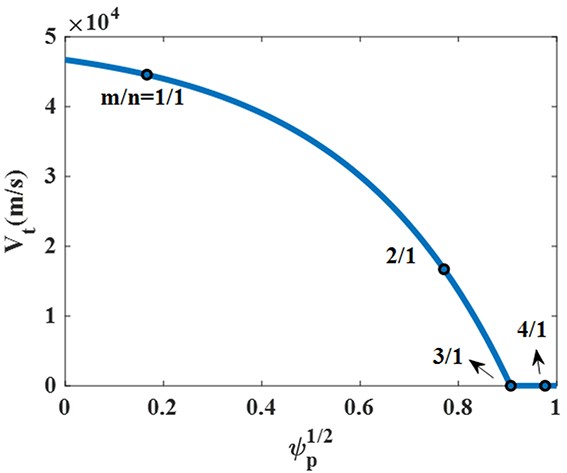
In the MARS-F calculations for the discharge #1080473, we only modified the radial distribution of the toroidal rotation speed and the input RMP coil current. The toroidal rotation profile is shown in figure 13, and the RMP coil current was increased from 4 to 6 kA.
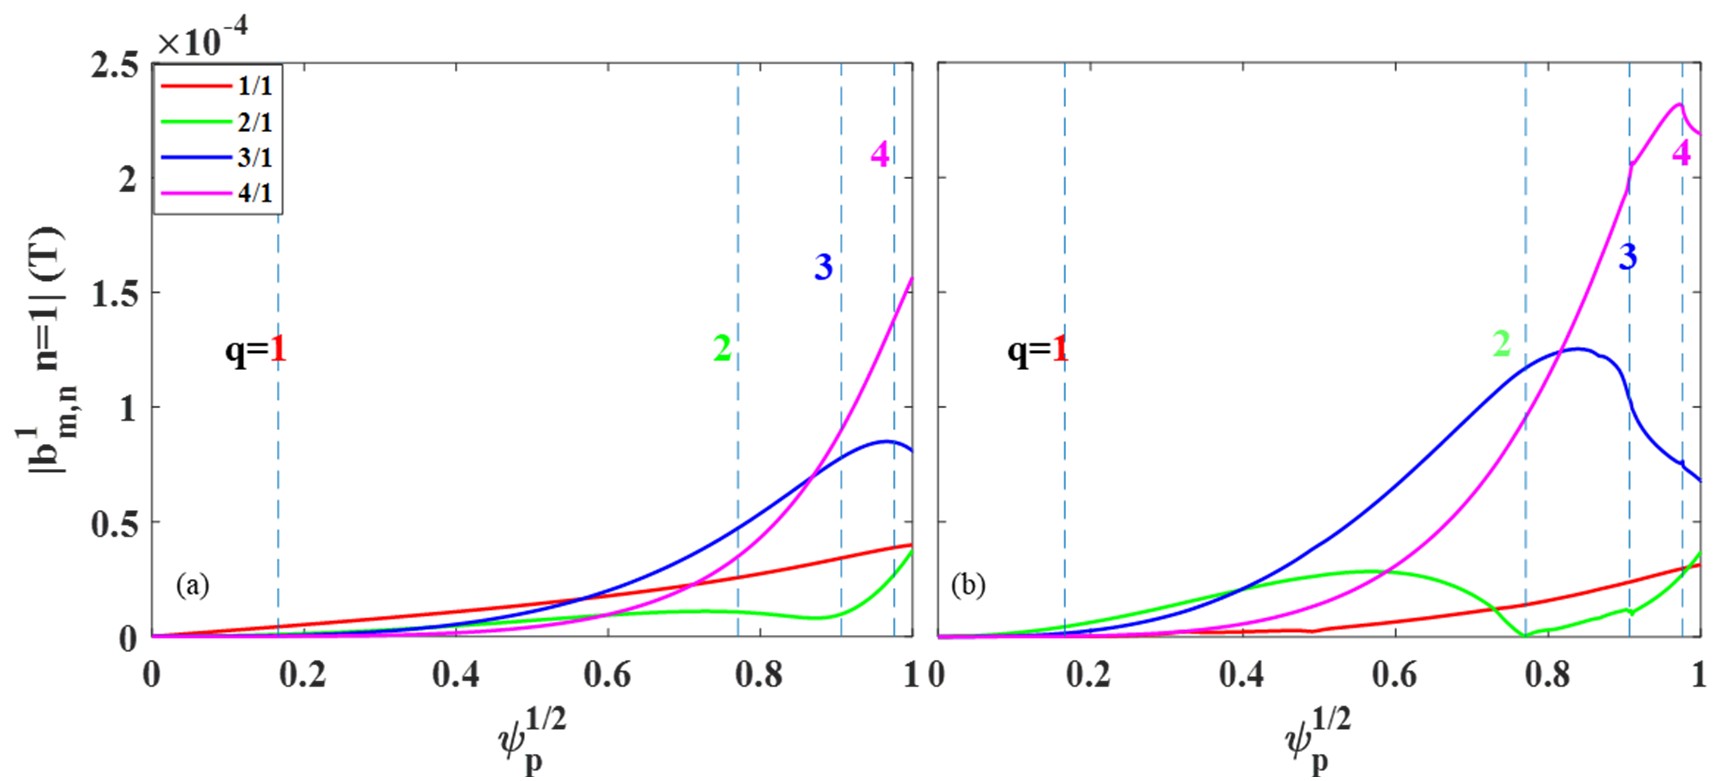
Figure 14(b) presents the magnetic field components of the total perturbation field (including RMP field and plasma response) calculated by MARS-F, considering the plasma rotation shielding effect. By comparing it with the magnetic spectrum of the pure vacuum field in figure 14(a), We observed that, for the RMP current of 6 kA, the m/n = 1/1 and 2/1 components at the corresponding resonant rational flux surface positions are reduced to almost zero. In contrast to the situation with RMP at 4 kA as shown in figure 7, the m/n = 4/1 component significantly increases at the corresponding resonant rational flux surface, while the m/n = 3/1 component increases slightly. This is because the change in the rotational velocity distribution affects the magnetic field penetration results at the corresponding positions.
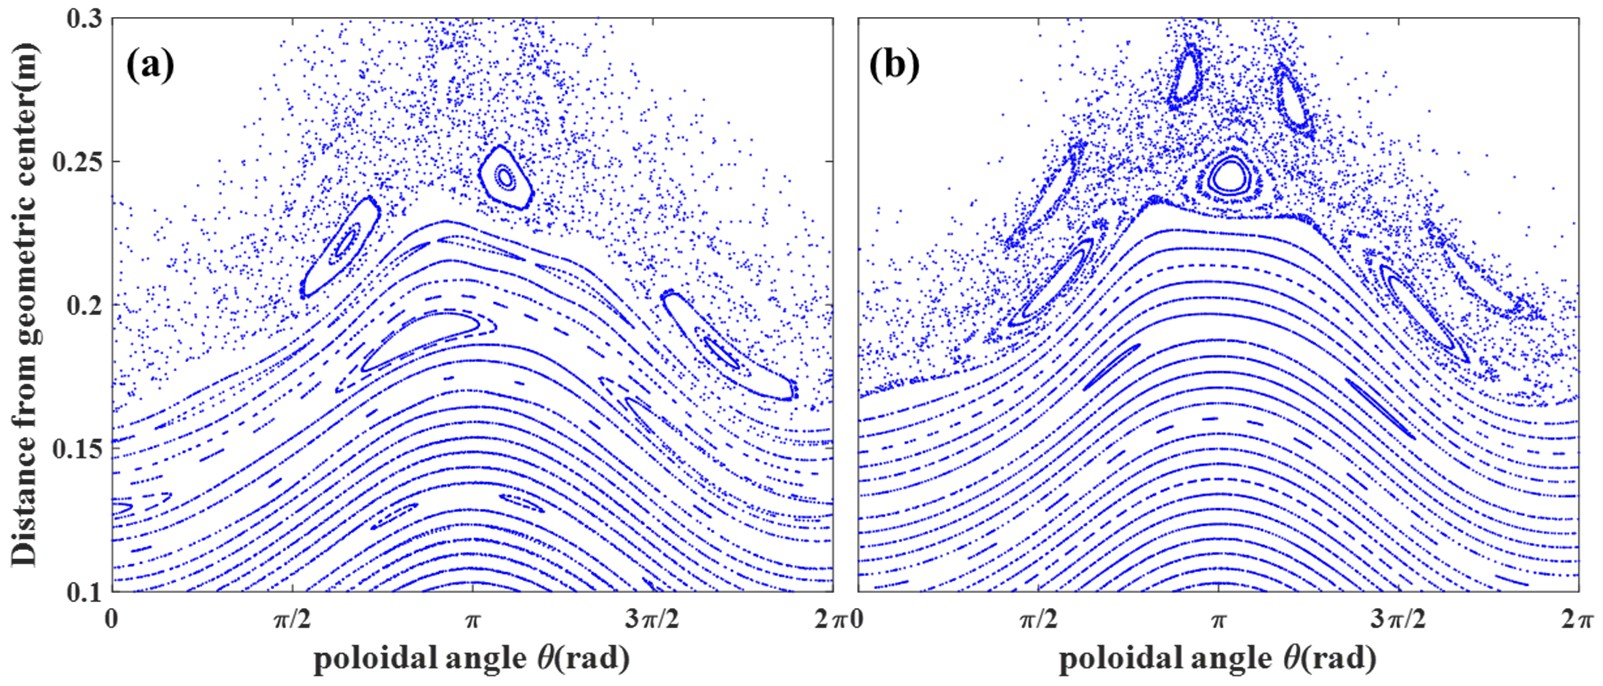
Figure 15 depicts the magnetic topology Poincaré plots from HINT calculations at Φ = 315°, incorporating both the vacuum RMP field and the total perturbation field with the plasma rotation shielding effect for RMP currents of 6 kA. In figure 15(b), the m/n = 2/1 magnetic island significantly diminishes when considering the plasma rotation shielding effect compared to the vacuum RMP field. Under vacuum RMP field conditions, strong stochastic erosion occurs due to the prominent m/n = 3/1 and 4/1 resonant components at the boundary, we observed the same scenario occurring due to the penetration of both m/n = 3/1 and 4/1 in figure 15(b). Additionally, we can see that there are some changes in the phase of the m/n = 3/1 magnetic island.
Figure 16 shows the contour plots of the distribution of pressure and toroidal current density calculated using HINT. In comparing figures 16(c) and (a), we observe a significant change in the current density at the X-point of the magnetic island due to the penetration of the m/n = 3/1 island. This is different from the situation when the m/n = 3/1 island did not penetrate with IID = 4 kA (as shown in figure 9(c)). In figure 16(d), the pressure distribution undergoes corresponding changes due to the alteration in the magnetic island phase, but there is almost no change inside the magnetic island.
Figure 17(a) displays the Poincaré plot at Φ = 315° when IID = 6 kA, considering the plasma rotation shielding effect. The pressure calculation results are shown in figure 17(b). We observed that under vacuum RMP field conditions (black dashed line), the pressure distribution flattens at the boundary due to strong stochastic erosion, and in consideration of the plasma rotation shielding effect (blue solid line), the same situation occurred due to the boundary penetration. This is entirely different from the results shown in figure 10(b) for the 4 kA case.
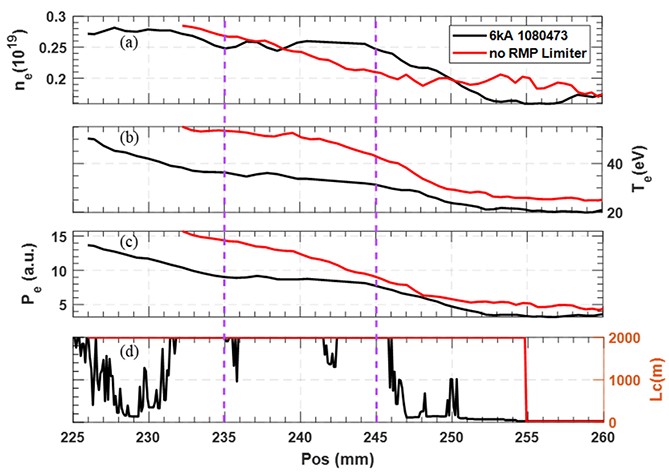
The measured results are compared with the calculated magnetic field line connection lengths at corresponding positions in figure 18. Because the m/n = 4/1 magnetic island is enlarging, we observed a significant flattening of the electron pressure and density around Z = 0.235–0.245 m, corresponding to the position of the m/n = 4/1 magnetic island. However, the electron temperature still maintains a certain gradient. Compared to the limiter configuration without coil current (red line), these parameters have all significantly decreased. Meanwhile, observing the magnetic field line connection length reveals that the m/n = 4/1 magnetic island is cut by the target plate, consistent with the ion saturation current on the target plate shown in figure 12(h).
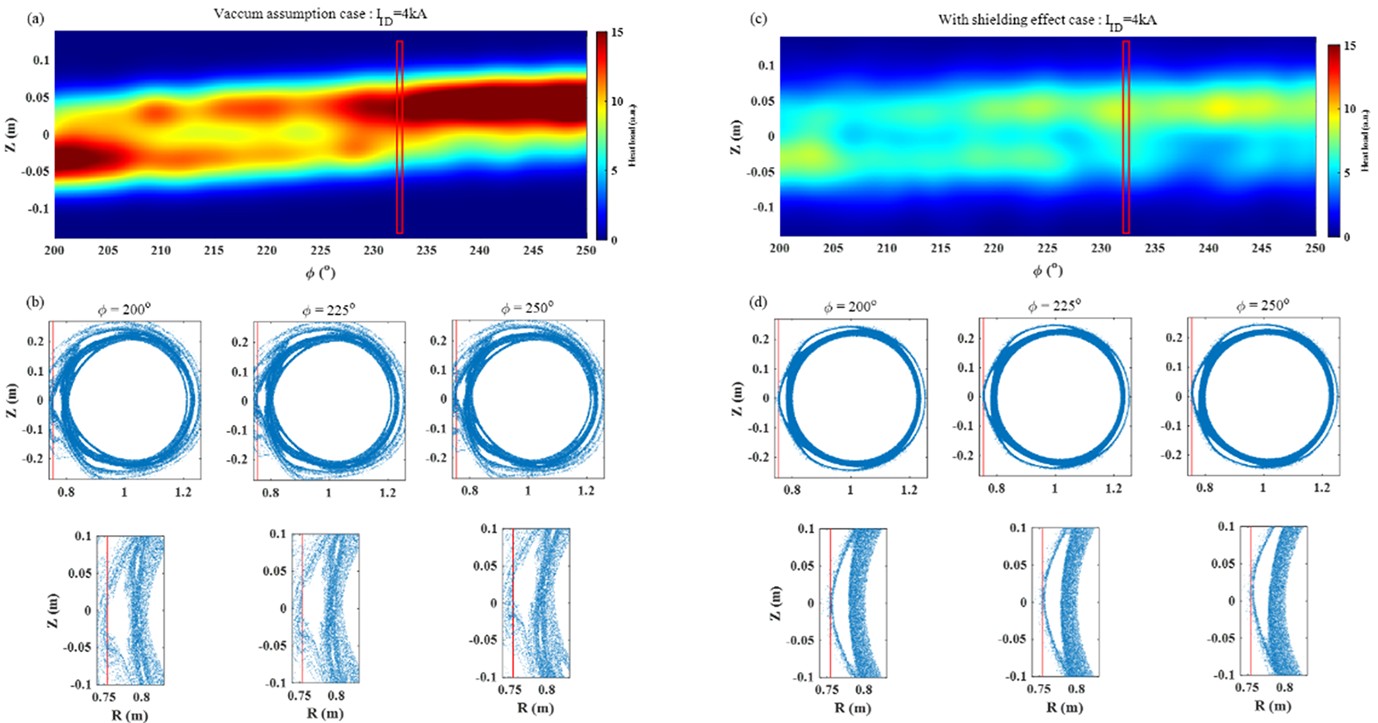
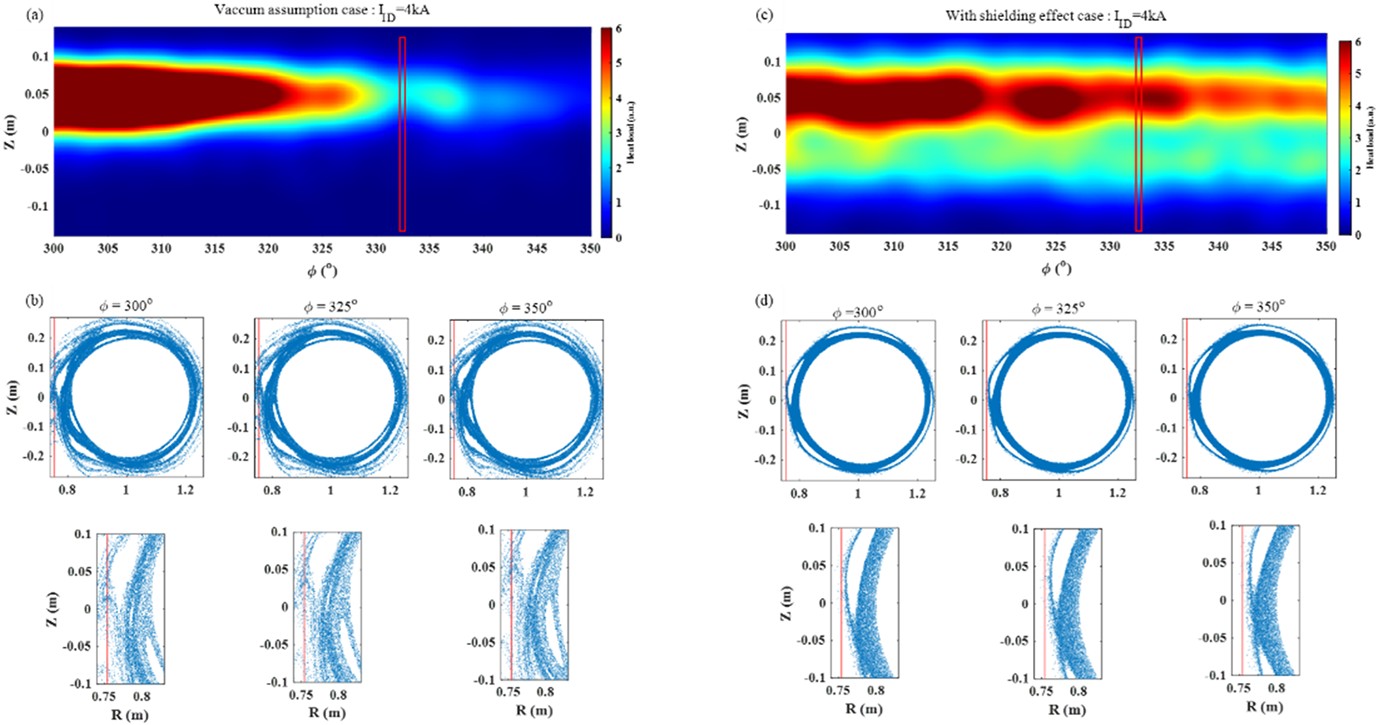
We used a field line diffusion model [41, 42] to predict the heat load on the target plate at port 9, as shown in figure 19. Two cases are selected for the discharge #1080510, case 1 with vacuum assumption and case 2 with plasma rotation shielding effect. Comparison of the predicted heat flux distribution on the target plate under two different conditions is shown in figures 19(a) and (c), the amplitude of the thermal load shows significant differences. We can also observe a clear helical structure between Φ = 200° and 250° under vacuum conditions, which becomes less prominent when considering the rotation shielding effect. This difference is attributed to the varying interaction between the m/n = 4/1 magnetic island and the target plate. As for the case 1, a wider m/n = 4/1 island can be observed and the stochastic region occurs due to the overlapping of m/n = 3/1 and 4/1 islands, which is shown in figure 19(b). The m/n = 4/1 island is cut by target plate, therefore, the predicted heat load shows a helical structure on the target plate. However, as for the case 2, the narrow island has no interaction with target but only changes the shape of LCFS, as shown in figure 19(d). It is similar to a 3D limiter configuration in this case.
The predicted heat flux near port 14 is shown in figure 20, indicating a significant difference in the distribution of heat flux in the toroidal position. In the vacuum assumption scenario, the target plate is located near the X-point of the m/n = 4/1 magnetic island. Additionally, due to the formation of the island divertor configuration, there is almost no heat flux between Φ = 326° and 350°. This implies less interaction in these toroidal angles. However, considering the shielding effect, the 4/1 magnetic island cannot be cut by the target plate, resulting in more heat flux between Φ = 326° and 350°.
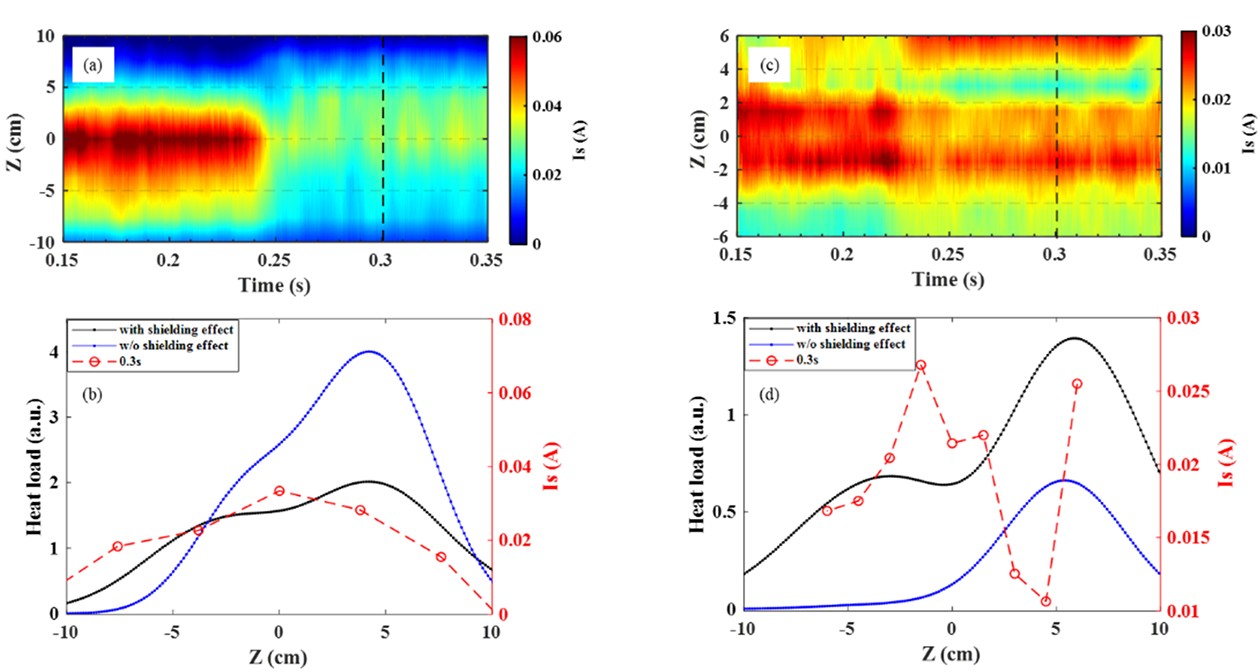
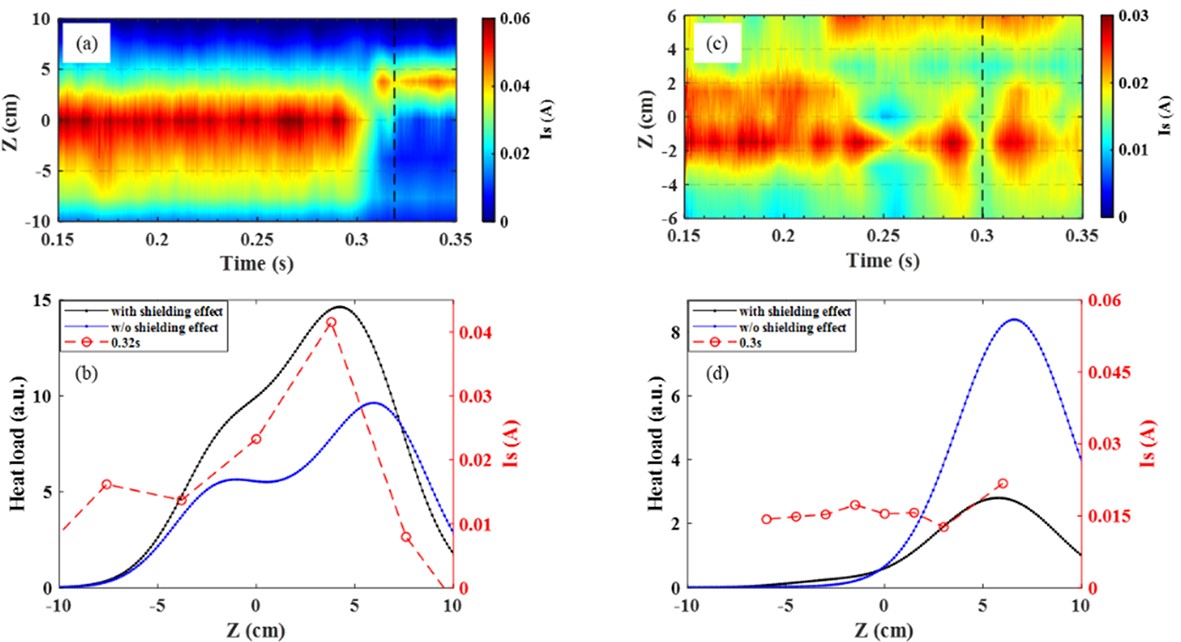
Figures 21(a) and (c) depict the time evolution plots of the ion saturation current at two different locations of the target plate. Note that the HFS LLPA system at port 9 was not applied during discharges #1080510 and #1080473. The experimental results obtained were from additional experiments conducted under the same parameters, with the only difference being the slight variation in the start time of the ID coil current. In figure 21(a), the ID coil current was initiated at t = 0.22 s. We observed that although the thermal load decreases after the addition of the ID coil current, there is no significant bifurcation phenomenon, indicating that the m/n = 4/1 magnetic island only change the shape of LCFS but is not cut by the HFS target plate, which is more consistent with our model prediction results.
Figures 21(b) and (d) show the comparison between the ion saturation current distribution at the corresponding locations at t = 0.3 s and the predicted thermal load results. In the range of −10 cm < Z < 0 cm at port 9, the ion saturation current Is gradually increases, with a region of decreasing gradient. Where Z > 0 cm, Is gradually decreases. The thermal load predictions considering and not considering the shielding effect both show similar overall trends to the ion saturation current, but there are significant differences in magnitude between the two cases, as reflected in figures 19(a) and (c). In the range of −10 cm < Z < 6 cm at port 14, Is first increases, then decreases, and then increases again. At this position, the thermal load prediction considering the shielding effect aligns noticeably better with the trend of Is compared to predictions without considering it, but there are some differences.
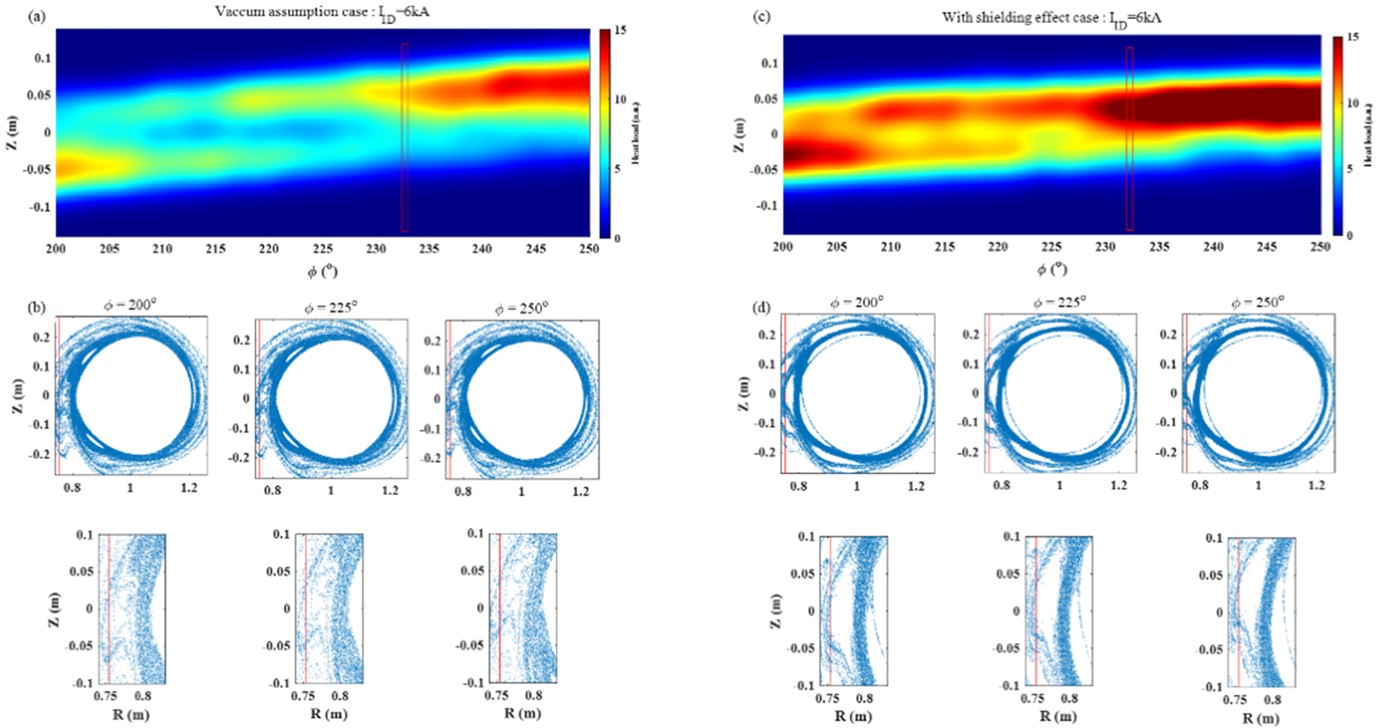
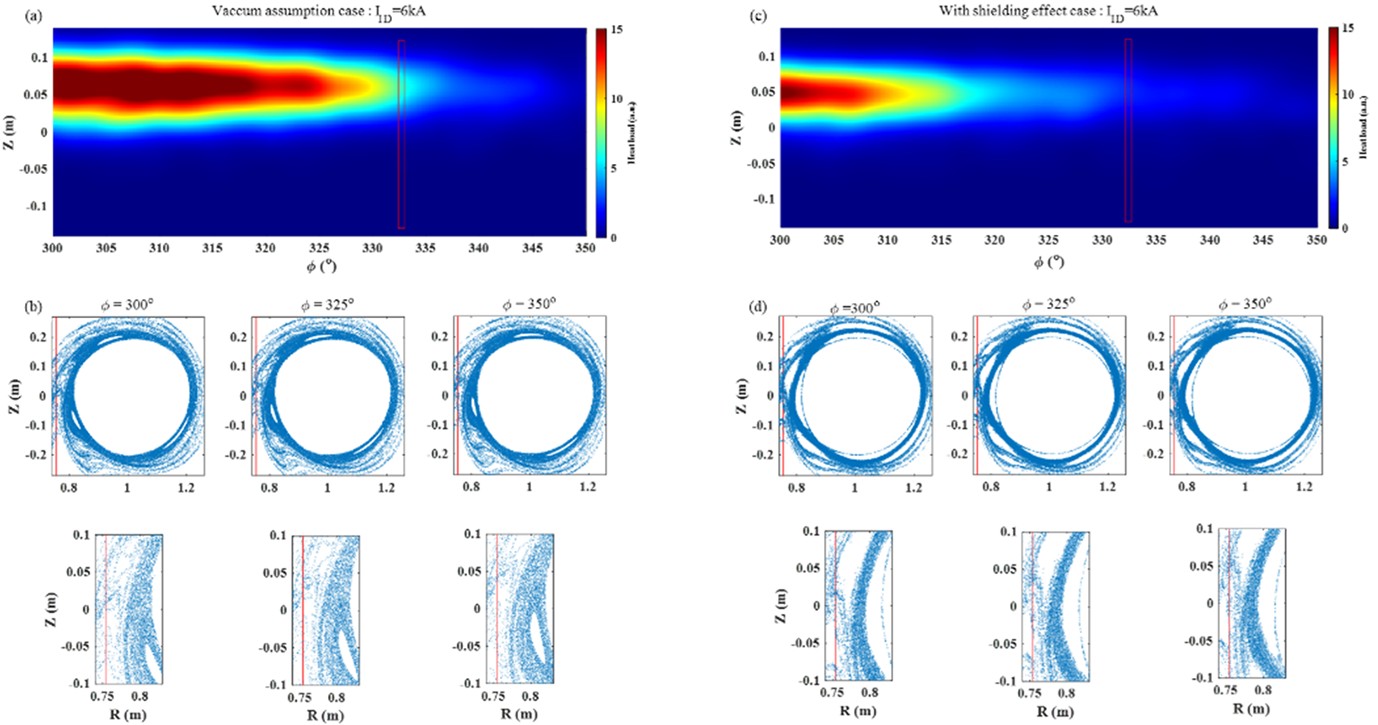
For the discharge #1080473, the predicted heat loads at port 9 and port 14 with IID = 6 kA are shown in figures 22 and 23, respectively. It can be observed that due to the penetration of the m/n = 4/1 and 3/1 components, the heat load distribution considering the shielding effect is more similar to that of the vacuum assumption compared to the actual scenario. As depicted in figure 22(b), under vacuum conditions, strong stochasticity occurs due to the overlapping of the m/n = 3/1 and 4/1 islands, with the m/n = 4/1 island being cut by the target plate. Consequently, the predicted heat load in figure 22(a) exhibits a helical structure on the target plate, and the stochasticity results in a decrease in peak values. However, when considering the shielding effect, the stochasticity weakens, the heat load distribution also shows a clear helical structure but with a higher peak compared to the vacuum case, as shown in figure 22(c).
The predicted heat load near port 14 is illustrated in figures 23(a) and (c). In both scenarios, island divertor structure is formed, resulting in the near disappearance of heat flux between Φ = 335° and 350°. However, the change in magnetic island shape due to the shielding effect leads to differences in heat flux amplitude and distribution at other toroidal positions.
Figures 24(a) and (c) depict the time evolution of the ion saturation current at the target plates in two different port positions. In figure 24(a), the ID coil current is injected at t = 0.27 s. It can be observed that both positions exhibit significant bifurcation phenomena, indicating the intersection of the m/n = 4/1 magnetic island with the target plate, validating the formation of the island divertor structure. Figures 24(b) and (d) show the comparison between the distribution of ion saturation currents at the target plate at t = 0.32 s and t = 0.3 s, respectively, and the predicted heat load results. We can see that the predicted thermal loads on the target plate with and without considering the shielding effect show similar distribution trends, both resembling the distribution trend of the ion saturation current. The main difference lies in the magnitude. At port 9, the predicted thermal load on the target plate is generally higher when considering the shielding effect compared to the case of not considering it. However, at port 14, the peak value of the predicted thermal load on the target plate is significantly lower when considering the shielding effect compared to the case of not considering it. This is explained in the analyses of figures 22 and 23.
This work employs the linear single-fluid resistive MHD code MARS-F and the 3D non-linear MHD equilibrium calculation code HINT to investigate the influence of the plasma rotation shielding effect on the magnetic topology and edge plasma parameters. This will help determine more correct 3D plasma equilibrium, especially for 3D edge magnetic structure. Correct magnetic structure can be used for heat load prediction on the target plate and island divertor design. The effect of plasma rotation shielding on the RMP penetration of the J-TEXT island divertor coil is calculated using the MARS-F code. Subsequently, based on this, the 3D equilibrium and changes in magnetic topology are calculated using HINT. Finally, the distribution of thermal loads is estimated using a field line diffusion model.
The results on J-TEXT indicate that the plasma rotation shielding effect will affect the penetration of RMPs generated by the ID coils, thereby changing the structure of magnetic topology and 3D equilibrium rather than the vacuum assumption case, ultimately impacting the distribution of thermal loads. As described in section 3.3.1, when the ID coil current is low, the rotational shielding prevents the formation of the m/n = 3/1 magnetic island at the boundary, significantly altering the magnetic topology structure at the boundary, which contrasts sharply with the results of calculations using the vacuum RMP field and explains the variation in magnetic disturbances observed in experiments. Meanwhile, the maintenance of a higher rotational speed in the core makes it difficult for magnetic field components to penetrate, preventing the formation of core magnetic islands, and the sawtooth oscillations persist.
In summary, considering the plasma rotation shielding effect in 3D equilibrium calculations on J-TEXT can provide more accurate simulation results compared to those with the vacuum RMP field, leading to a better agreement with experimental observations. In the simulations, the rotation shielding effect significantly influences the magnetic topology structure, resulting in notable differences in the calculated magnetic topology structure, plasma current density, and pressure distribution compared to the vacuum RMP field. The changes in boundary magnetic topology structure consequently alter the distribution of thermal loads on the target plate, which significantly affects the expected effectiveness of the island divertor configuration. These findings highlight the impact of the plasma rotation shielding effect in island divertor design for tokamak.
The authors are very grateful for the help of J-TEXT team. This work was supported by the National Magnetic Confinement Fusion Energy R & D Program of China (No. 2018YFE0309101) and National Natural Science Foundation of China (Nos. 12305243 and 51821005).
| [1] |
Liang Y F 2021 Leveraging 3D magnetic topologies in support of long-pulse high performance plasma operation In: 28th IAEA Fusion Energy Conference FEC (Virtual Event 10–15 May 2021
|
| [2] |
Wang H et al 2021 Plasma Sci. Technol. 23 125103 doi: 10.1088/2058-6272/ac224a
|
| [3] |
Colin C et al 2015 J. Nucl. Mater. 463 654 doi: 10.1016/j.jnucmat.2015.01.019
|
| [4] |
Schmitz O et al 2008 Plasma Phys. Control. Fusion 50 124029 doi: 10.1088/0741-3335/50/12/124029
|
| [5] |
Schmitz O et al 2011 J. Nucl. Mater. 415 S886 doi: 10.1016/j.jnucmat.2011.01.136
|
| [6] |
Ahn J W et al 2017 Plasma Phys. Control. Fusion 59 084002 doi: 10.1088/1361-6587/aa73ea
|
| [7] |
Liang Y et al 2013 Phys. Rev. Lett. 110 235002 doi: 10.1103/PhysRevLett.110.235002
|
| [8] |
Ghendrih P et al 2003 Nucl. Fusion 43 1013 doi: 10.1088/0029-5515/43/10/001
|
| [9] |
Xu S et al 2018 Nucl. Fusion 58 106008 doi: 10.1088/1741-4326/aad296
|
| [10] |
Zhou S et al 2022 Nucl. Fusion 62 106002 doi: 10.1088/1741-4326/ac8439
|
| [11] |
Kobayashi M et al 2019 Nucl. Fusion 59 126003 doi: 10.1088/1741-4326/ab3d14
|
| [12] |
Kim K et al 2017 Phys. Plasmas 24 062302 doi: 10.1063/1.4984991
|
| [13] |
Bader A et al 2013 Nucl. Fusion 53 113036 doi: 10.1088/0029-5515/53/11/113036
|
| [14] |
Pandya S N et al 2016 Nucl. Fusion 56 046002 doi: 10.1088/0029-5515/56/4/046002
|
| [15] |
Liu Y Q, Kirk A and Nardon E 2010 Phys. Plasmas 17 122502 doi: 10.1063/1.3526677
|
| [16] |
Park J K, Boozer A H and Glasser A H 2007 Phys. Plasmas 14 052110 doi: 10.1063/1.2732170
|
| [17] |
Hoelzl M et al 2021 Nucl. Fusion 61 065001 doi: 10.1088/1741-4326/abf99f
|
| [18] |
Krebs I et al 2020 Phys. Plasmas 27 022505 doi: 10.1063/1.5127664
|
| [19] |
Suzuki Y 2017 Plasma Phys. Control. Fusion 59 054008 doi: 10.1088/1361-6587/aa5adc
|
| [20] |
Ma Q et al 2023 Phys. Plasmas 30 122507 doi: 10.1063/5.0170003
|
| [21] |
Frerichs H et al 2023 Nucl. Mater. Energy 34 101380 doi: 10.1016/j.nme.2023.101380
|
| [22] |
Wang X et al 2023 Nucl. Fusion 63 096023 doi: 10.1088/1741-4326/aceb77
|
| [23] |
Izzo V A et al 2022 Nucl. Fusion 62 096029 doi: 10.1088/1741-4326/ac83d8
|
| [24] |
Suzuki Y and Geiger J 2016 Plasma Phys. Control. Fusion 58 064004 doi: 10.1088/0741-3335/58/6/064004
|
| [25] |
Nardon E et al 2010 Nucl. Fusion 50 034002 doi: 10.1088/0029-5515/50/3/034002
|
| [26] |
Ferraro N M et al 2012 Phys. Plasmas 19 056105 doi: 10.1063/1.3694657
|
| [27] |
Hu Q et al 2020 Nucl. Fusion 60 076006 doi: 10.1088/1741-4326/ab8b79
|
| [28] |
Ye C et al 2024 Nucl. Fusion 64 016005 doi: 10.1088/1741-4326/ad0982
|
| [29] |
Hirshman S P and Whitson J C 1983 Phys. Fluids 26 3553 doi: 10.1063/1.864116
|
| [30] |
Wingen A et al 2015 Plasma Phys. Control. Fusion 57 104006 doi: 10.1088/0741-3335/57/10/104006
|
| [31] |
Liu Y Q et al 2011 Nucl. Fusion 51 083002 doi: 10.1088/0029-5515/51/8/083002
|
| [32] |
Wang Z S et al 2021 Plasma Sci. Technol. 23 085104 doi: 10.1088/2058-6272/ac0492
|
| [33] |
Wang N C et al 2022 Nucl. Fusion 62 042016 doi: 10.1088/1741-4326/ac3aff
|
| [34] |
Li C K et al 2024 Plasma Sci. Technol. 26 025101 doi: 10.1088/2058-6272/ad0c1e
|
| [35] |
Liang Y F et al 2022 Plasma Sci. Technol. 24 124021 doi: 10.1088/2058-6272/acaa8d
|
| [36] |
Zhou S et al 2019 Fusion Eng. Des. 146 902 doi: 10.1016/j.fusengdes.2019.01.109
|
| [37] |
Zhou S 1967 First application of the island divertor configuration in the J-TEXT tokamak In: 29th Fusion Energy Conference, EX/P2-21
|
| [38] |
Chen Z P et al 2022 Plasma Sci. Technol. 24 124008 doi: 10.1088/2058-6272/aca0dc
|
| [39] |
Yang J et al 2024 Nucl. Fusion 64 024001 doi: 10.1088/1741-4326/ad1788
|
| [40] |
Mao F Y et al 2022 Plasma Sci. Technol. 24 124002 doi: 10.1088/2058-6272/ac9f2e
|
| [41] |
Knieps A et al 2022 Nucl. Fusion 62 026011 doi: 10.1088/1741-4326/ac3a18
|
| [42] |
Knieps A et al 2022 Plasma Phys. Control. Fusion 64 084001 doi: 10.1088/1361-6587/ac757d
|
Supported by: Beijing Renhe Information Technology Co., Ltd. 
 DownLoad: