Figure
1.
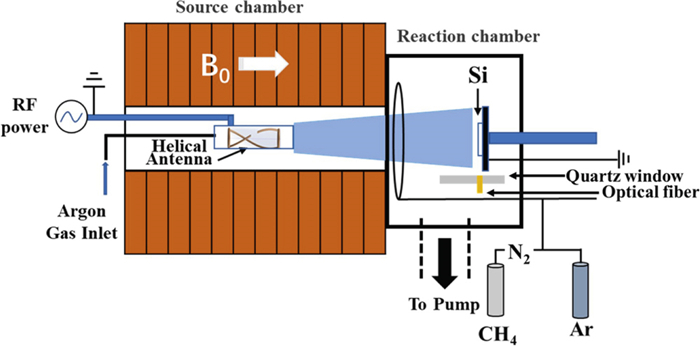
Schematic of HMHX experimental apparatus.
| Citation: |
Yan YANG, Tianyuan HUANG, Maoyang LI, Yaowei YU, Jianjun HUANG, Bin YU, Xuemei WU, Peiyu JI. The effect of nitrogen concentration on the properties of N-DLC prepared by helicon wave plasma chemical vapor deposition[J]. Plasma Science and Technology, 2022, 24(10): 105502. DOI: 10.1088/2058-6272/ac6ec0

|
Nitrogen-doped diamond-like carbon (N-DLC) films were synthesized by helicon wave plasma chemical vapor deposition (HWP-CVD). The mechanism of the plasma influence on the N-DLC structure and properties was revealed by the diagnosis of plasma. The effects of nitrogen doping on the mechanical and hydrophobicity properties of DLC films were studied. The change in the ratio of precursor gas flow reduces the concentration of film-forming groups, resulting in a decrease of growth rate with increasing nitrogen flow rate. The morphology and structure of N-DLC films were characterized by scanning probe microscopy, Raman spectroscopy, and X-ray photoemission spectroscopy. The mechanical properties and wettability of N-DLC were analyzed by an ultra-micro hardness tester and JC2000DM system. The results show that the content ratio of N+ and N2+ is positively correlated with the mechanical properties and wettability of N-DLC films. The enhancement hardness and elastic modulus of N-DLC are attributed to the increase in sp3 carbon–nitrogen bond content in the film, reaching 26.5 GPa and 160 GPa respectively. Water contact measurement shows that the increase in the nitrogen-bond structure in N-DLC gives the film excellent hydrophobic properties, and the optimal water contact angle reaches 111.2°. It is shown that HWP technology has unique advantages in the modulation of functional nanomaterials.
Heteroatomic doping can change the content of coordination defects, sp bond content, and lattice disorder in diamond-like films, thus improving the hardness, friction coefficient, chemical inertia, resistivity, and semiconductor characteristics of diamond-like films [1]. Its applications in optical, mechanical, electronic, and biomedical fields have been expanded [2–6]. The doping of nitrogen can shift the atoms in the film, changing the bond structure and content ratio. Therefore, it can significantly improve the adhesion between the film and substrate, and the residual stress of the coating can be reduced. In addition, it enhances the mechanical and tribological properties of the films. Nitrogen-doped diamond-like carbon (N-DLC) films improve bond strength due to the possible formation of carbon–nitrogen bonds. Therefore, they have many industrial applications, such as critical engine components, hard drives, scratch-resistant glasses, mechanical surface seals, surgical tools, etc. There are many techniques for preparing N-DLC films. Chen and Hong have studied the effect of SiOx-incorporation hydrocarbons on the tribological properties of DLC films using a 13.56 MHz magnetically confined inductively coupled plasma (ICP) system [7]. Paul et al have studied the effect of gold-doped DLC on residual stress using a radiofrequency (RF) capacitively coupled plasma chemical vapor deposition (CCP-CVD) sputtering technique at room temperature [8]. In addition, numerous researchers and groups have synthesized N-DLC thin films using various deposition methods such as microwave surface-wave plasma CVD [9], DC magnetron sputtering [10], electron cyclotron resonance-assisted microwave plasma CVD (ECR-MPCVD) [11], and inductively coupled plasma deposition (ICP) systems [1, 12].
However, the synthesis of N-DLC thin films by helicon wave plasma CVD (HWP-CVD) method has rarely been reported. HWP has high electron density, low electron temperature and strong controllability of plasma parameters. It has become an ideal plasma source for the preparation of nanomaterials. There is no built-in electrode, so it will not pollute the material. In this work, HWP-CVD technology was used to study the preparation of N-DLC thin films [13–15]. The effect of fixed precursor methane changing nitrogen flow was investigated in a previous work [16]. The mechanical properties affected by the structure of the thin film were analyzed. The prepared films present void structures that affect their mechanical properties, so we conducted a new round of experiments by regulating the proportion of nitrogen/carbon atoms in the precursors. The effects of gas-phase species on the morphology, bond content, structure, and properties of N-DLC films in plasma were investigated.
In this work, the effect of nitrogen content on the structure and properties of N-DLC thin films prepared by HWP-CVD technology was investigated. The gas-phase species in the plasma were diagnosed by optical emission spectroscopy (OES) and mass spectrometry (MS). We analyzed the effects of the change of relative content of species on the bond structure and properties of N-DLC films without changing the substrate and other discharge parameters. Scanning electron microscopy (SEM), Raman spectra (Raman), and X-ray photoelectron spectroscopy (XPS) characterized the film morphological structure and chemical bonding state. The effects of bonding state on mechanical properties and wettability were analyzed.
The N-DLC thin films were deposited on a silicon substrate by self-design HWP-CVD, named High Magnetic field Helicon experiment (HMHX) for which more detail can be found in [17]. A schematic illustration of HMHX is shown in figure 1. In brief, the discharge was realized at RF (13.56 MHz) power (1.5 kW) using an internal right helical antenna with a static axial magnetic field from 12 electromagnets that surround the chamber. The silicon substrate was fixed in the reaction chamber about 40 cm away from the plasma source region where the helical antenna was set. Si substrate was cleaned beforehand by acetone for 5 min, absolute ethyl alcohol for 5 min and ultra-pure water for 5 min in an ultrasonic bath. Prior to deposition, the silicon substrate was cleaned for 10 min by argon HWP to remove residual surface contaminants [18]. In the process of N-DLC film deposition, the precursors argon, methane and nitrogen were used as the HWP discharge gas, reaction gas and doping gas respectively. Argon was fed to the source region through the mass flow controller as a discharge gas, with the flow rate set to 50 sccm. At the same time, mixtures of CH4 and N2 with different gas flow ratios fN2 through different mass flow controllers were fed into the reaction chamber, where
In the thin film deposition region, the species composition of the plasma was diagnosed using OES (MS5204i) and mass spectroscopy (EQP, Hiden). XPS (Thermo ESCALAB 250 XI) was used for the chemical states of nitrogen and carbon at the surface. The surface morphology and thickness of N-DLC thin films were characterized by SEM (Hitachi SU8010). Visible Raman (HR 800) were collected with a micro-Raman spectroscopy system using a frequency-doubled Nd: YAG laser operating at an excitation wavelength of 514 nm. The hardness and modulus of elasticity of N-DLC were measured by an ultra-micro hardness tester (DUH-211S). Contact angle measurements were carried out by a JC2000DM system (Beijing Zhongyi Kexin Technology).
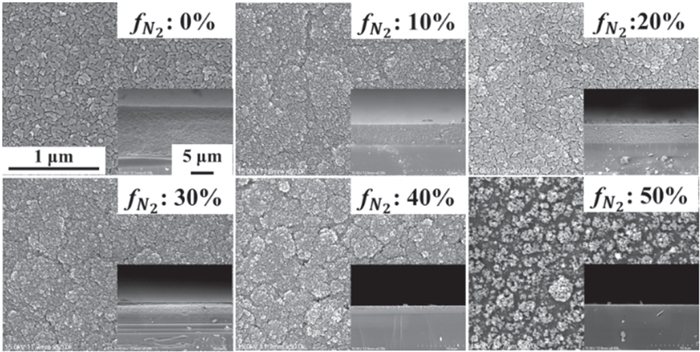
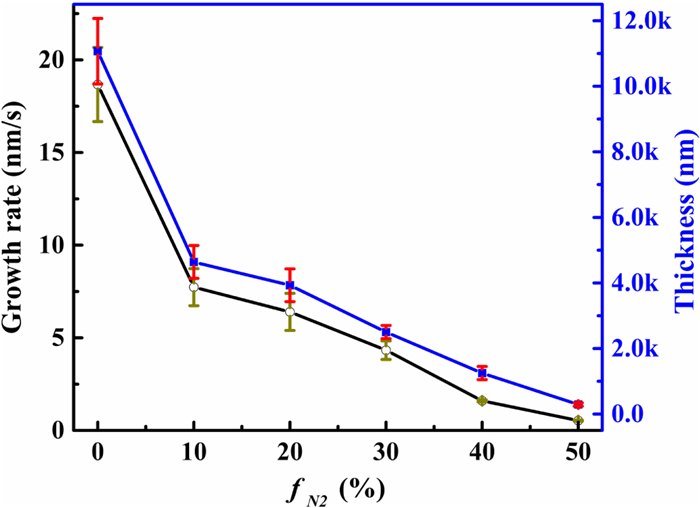
The surface morphologies and the thickness of N-DLC thin films were characterized by SEM. Figure 2 shows the surface and cross-section SEM images of N-DLC deposited at different fN2 (from 0% to 50%). From these images, the influence of the nitrogen flow ratio on the morphology and thickness of the deposition process can be evaluated. It was found that the dopant causes an increase in particle sizes. Raman also corroborates these results. The particle size on the surface of the film increases with increasing fN2. For nitrogen content at 50%, the N-DLC films exhibit a different morphology from those observed. It shows a porous surface, which may be due to the formation of amorphous carbon nitride [10]. There is no gap between the film and the substrate from the cross section, indicating that the adhesion is excellent, and the films all have a dense structure. The thickness and growth rate of the film were calculated by the cross-section of SEM, as shown in figure 3. The growth rate of the films decreases from 18.67 to 0.53 nm s-1 corresponding to fN2 from 0% to 50%. With increasing fN2, the concentration of CH molecules and C+ decreases, resulting in a decrease in growth rate. No matter what, films with different nitrogen content show good homogeneity and adhesion without cracks.
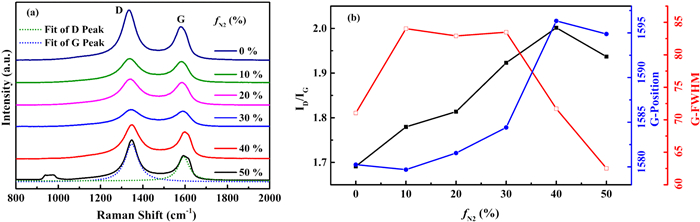
The properties and microstructure of carbon bonding were studied by Raman. Figure 4(a) shows a D peak centered around 1332 cm-1 and a G peak centered at 1580 cm-1, which indicates that the thin films mainly have a diamond-like carbon structure [19, 20]. The D peak results from the breathing modes of sp2 carbon atoms in rings, and the G peak originates from bond stretching of all pairs of sp2 carbon sites in rings and chains [18, 21]. Thus the D peak represents disordered sp2-hybridized carbon with an amount of sp3-hybridized carbon, while the G peak represents graphite-like sp2-hybridized carbon in the deposited thin films [9, 20, 22]. The area integral ratio of peaks D and G, the full width half maximum (FWHM) of the G band, and the position of the G peak were used to study the structure of the thin films [1, 20, 21, 23], as shown in figure 4(b). It was found that the variation of G peak position and the ratio of D to G peak intensity correlated with the increase in nitrogen content, reaching its maximum at 40%, all in the opposite direction of the FWHM of the G peak. The increase in ID/IG and the G peak position shifted to higher-value wavenumbers, which indicates that the dopant causes an increase in the sp2-hybridized carbon cluster size. The sp2 content increases while the CC bonding disorders and sp3 content decrease [10, 24, 25], and the number of rings per cluster increases with a decrease in the fraction of chain groups [21]. Finally, the observed decrease of FWHM of the G peak is also consistent with the increased cluster size [26].
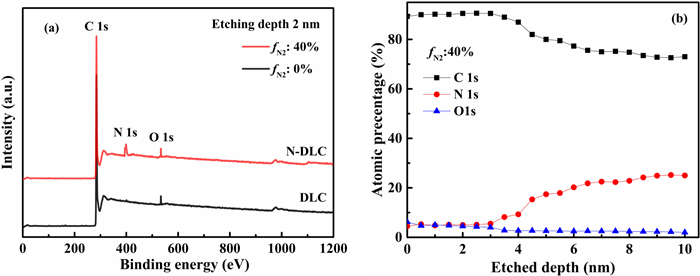
XPS is an important technique to characterize the surface composition and chemical bonding of the N-DLC thin films. Figure 5(a) shows typical XPS spectra of DLC and N-DLC films deposited by fN2 at 0% and 40%, respectively, with an etching depth of 2 nm. The positions of carbon (C1s), nitrogen (N1s), and oxygen (O1s) peaks were measured at 285, 400, and 533 eV, respectively. The etching depth is 2 nm from the surface of the film, and the content of carbon, nitrogen and oxygen in the film varies under different fN2 as shown in table 1. For the deposited DLC, only carbon and oxygen peaks were detected. The peak of nitrogen appeared in N-DLC. Through analyzing the oxygen content in the N-DLC thin films, it was found that oxygen is not only adsorbed on the surface of the sample but also bound to the carbon and nitrogen bonds. As for the presence of oxygen, the gas adsorbed by the wall of the chamber is released by the plasma bombardment during the discharge process, or by the adsorption of oxygen in the atmosphere [23, 25].
| fN2 | 0% | 10% | 20% | 30% | 40% | 50% |
| Atomic | ||||||
| C | 96.5 | 94.08 | 92.4 | 87.2 | 83.14 | 78.62 |
| N | 0 | 2.72 | 3.5 | 8.5 | 12.36 | 18.28 |
| O | 3.5 | 3.2 | 4.1 | 4.3 | 4.5 | 3.1 |
 DownLoad:
CSV
DownLoad:
CSV
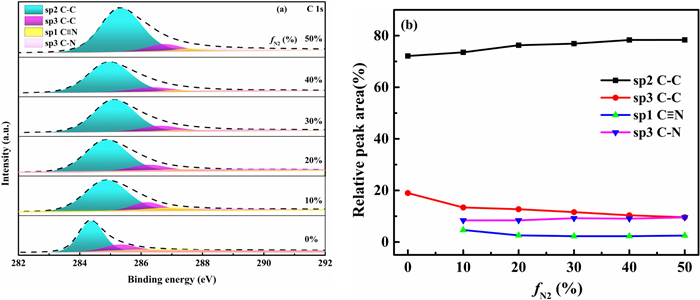
Figure 6(a) shows the fittings of deconvolution XPS spectra of C1s peaks of N-DLC thin films deposited at different fN2 ranging from 0% to 50%. The C1s peak shifts to higher energy and becomes broad with increasing nitrogen concentration in the thin film. This is due to the increase in nitrogen content and the presence of CN bonds [1, 27]. The curve fitting data for peaks located at 284.3, 285.4, 286.7, 288.3 eV were respectively assigned to sp2 CC, sp3 CC, sp1 C≡N, and sp3 CN [25, 26, 28–30]. Figure 6(b) shows all bonding states for the relative behavior as a function of fN2. The formation of CN bonds is accompanied by the increase in sp2 CC bonds, resulting in a decrease in sp3 CC bond content. Therefore, with increasing fN2, the content of sp3 CC decreases significantly [19, 29]. However, the contents of sp3 CN and sp1 C≡N are relatively stable at different fN2 in the films.
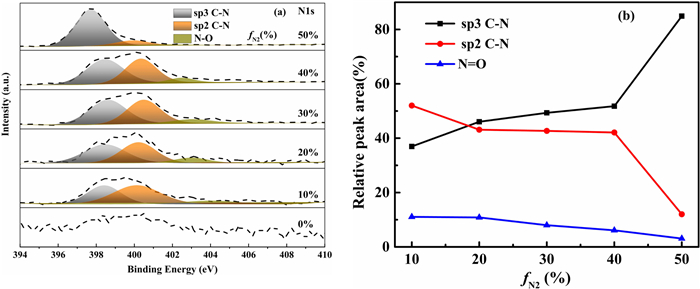
Figure 7(a) shows the fitting of deconvolution XPS spectra of N1s peaks of N-DLC thin films deposited at different fN2. When fN2 was increased from 10% to 40%, the N1s peak split into two peaks, which indicated that the degree of crystallization in the films was enhanced [20]. However, it is difficult to explain the reasons for this change in the N1s peak at 50% of fN2. The N1s peak was deconvoluted into three peaks. The first peak located at 398.2 eV corresponds to sp3 CN and the second peak located at 400.5 eV corresponds to sp2 CN, which allows for crosslinking of curved planes and formation of CNx [31]. The third peak located at 402.6 eV corresponds to N=O, which can be from other types of CN bonding [25, 32]. It is obvious that the sp3 CN bond increases with increasing fN2 and the sp2 CN bond decreases with increasing fN2 from figure 7(b). The results suggest that the initial increase in thin-film nitrogen concentration promotes an increase in the sp3 carbon bonding fraction and lattice disorder [19]. From figure 7(a), it can be concluded that the N–O peak's relative area remains almost constant.
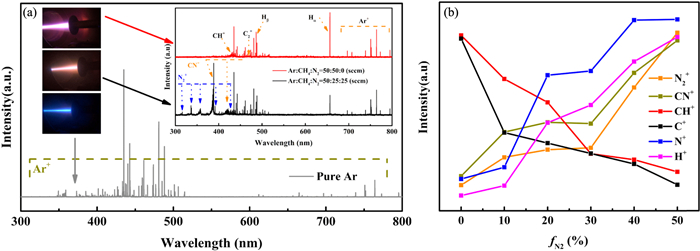
To investigate how the plasma affects the film growth, the film-forming particles and radical species in the plasma were diagnosed by OES. The types of excited species can be determined by the wavelength position of the OES. The relative concentration of the corresponding species can be inferred from the signal strength of the spectral line. As shown in figure 8, there is a typical spectrogram of pure argon (50 sccm), Ar: CH4 (50:50 sccm) and Ar: CH4: N2 (50:25:25 sccm). As can be seen from figure 8, under pure argon conditions, the emission peak corresponds to the ion and excitation state of argon. The radio frequency power excites the argon ionization process through the electromagnetic field excited by the helical antenna. In this process, the plasma is rich in argon ions, excited argon atoms and electrons. Under the condition of Ar: CH4 (50:50 sccm), in addition to the peak of argon, CH (431 nm,
| CH4+e→CH*+H2+H+e | (1) |
| CH4+e→H*+CH3+e | (2) |
| H2+e→H*+H+e | (3) |
| CHx+N→CN+xH | (4) |
| CH*x+N*2→CNHy+N+Hz+e | (5) |
| N2+e→N*2+e,CH*x+N2→CHx+N*2+e | (6) |
| N2+e→N+2+2e | (7) |
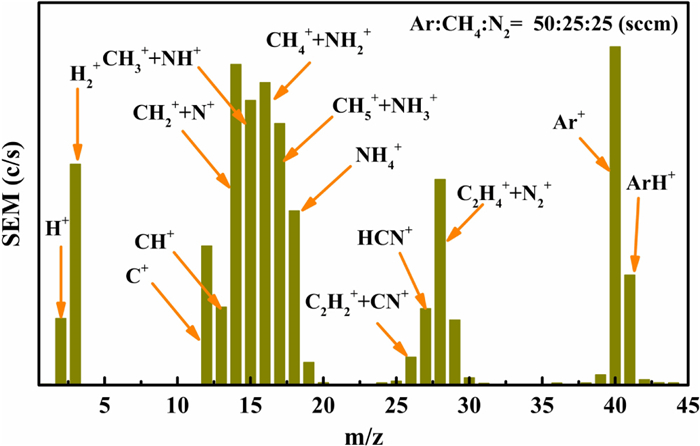
OES can only diagnose information about part of the excited species. To fully understand the composition of plasma, the mass spectrometer was used to determine the plasma particle information by detecting species with different mass and charge ratios. As shown in figure 9, it is a typical positive ion spectrum with a plasma parameter of Ar: CH4: N2 (50:25:25 sccm). CH4 and N2 molecules are enough dissociated and combined under the action of Ar-HWP. The main species components include atomic hydrogen (H+, m/z = 1), molecular hydrogen (
The species information of OES and EQP diagnosis complement each other and provide important support for the analysis of film deposition.
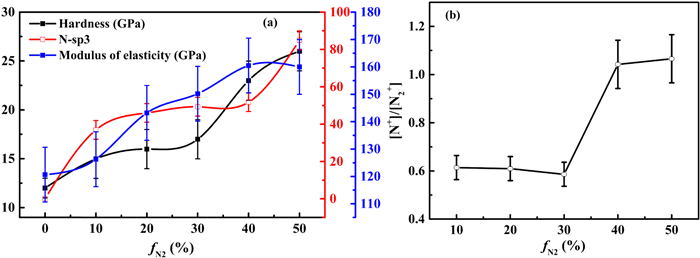
The complex interaction relationship between plasma process parameters and species composition has an important impact on the hardness and elastic modulus of N-DLC. As shown in figure 10(a), both the hardness and elastic modulus of the N-DLC films increase with the proportion of fN2 in the discharge system, because the proportion of nitrogen flow rate in the plasma increases the content ratio of N+ to
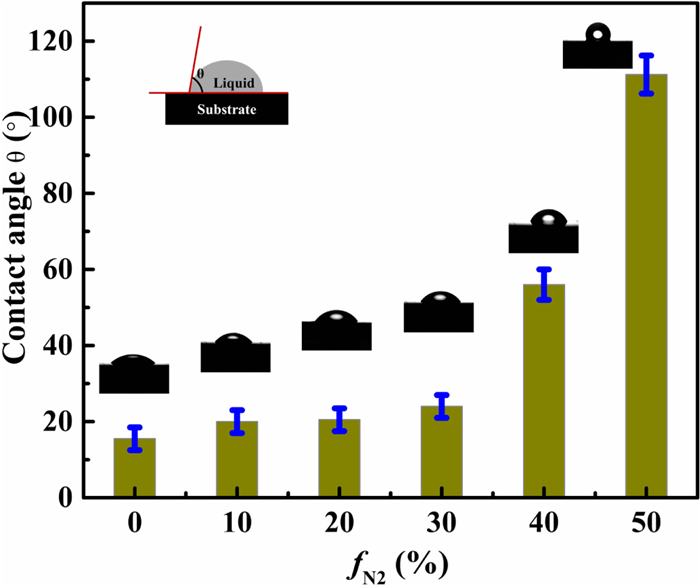
The wettability of N-DLC was researched by measuring the contact angle between the film surface and water. Figure 11 shows the effect of increasing nitrogen content in the discharge system on the water contact angle of the film. A charge-coupled device camera picture of the water contact angle test is shown in figure 11. As the nitrogen content increased in the film, the water contact angle gradually increased to 111.2°. This is mainly because the change in the ratio of sp3 CC and sp2 CC bonding on the film surface affects the hydrophilic/hydrophobic properties. sp2 CC rich surfaces have higher water contact angles than those rich in sp3 CC [36–38]. The enhancement of hydrophobicity reflects the decrease in surface energy of N-DLC.
The effects of increased nitrogen content in plasma on the structure and properties of N-DLC films were investigated by using a self-built HWP-CVD system. The results show that an increase in nitrogen flow in the plasma improves the concentration ratio of nitrogen atomic ions to nitrogen molecular ions. Under the action of argon HWP, methane molecules and nitrogen molecules are sufficiently dissociated to form film-forming particles and active radicals. The combination of carbon-containing radicals and nitrogen ions has become the main species basis for the growth of N-DLC films. Changes in the proportion of species components in plasma affect the content of bond structures and elements in N-DLC films. The CN sp3 bond increases significantly in the film with increasing nitrogen content, which is also the main reason for increasing the film hardness and elastic modulus. Analysis of the water contact angle of the N-DLC film shows that wetting is sensitive to the change of bond structure composition on the surface of the film, and the increase in nitrogen atom doping makes the film more hydrophobic. The work provides new preparation methods and paths for N-DLC in medical and mechanical areas.
This work is supported by National Natural Science Foundation of China (Nos. 11975163, 12175160) and Shenzhen Clean Energy Research Institute.
| [1] |
Khatir S, Hirose A and Xiao C 2015 Diamond Relat. Mater. 58 205 doi: 10.1016/j.diamond.2015.08.003
|
| [2] |
Hauert R 2003 Diamond Relat. Mater. 12 583 doi: 10.1016/S0925-9635(03)00081-5
|
| [3] |
Lee K H et al 2003 Thin Solid Films 435 150 doi: 10.1016/S0040-6090(03)00346-8
|
| [4] |
Nakatani T et al 2007 J. Photopol. Sci. Technol. 20 221 doi: 10.2494/photopolymer.20.221
|
| [5] |
Zeng A P et al 2014 Diamond Relat. Mater. 43 12 doi: 10.1016/j.diamond.2014.01.003
|
| [6] |
Grill A 2003 Diamond Relat. Mater. 12 166 doi: 10.1016/S0925-9635(03)00018-9
|
| [7] |
Chen L Y and Hong F C N 2001 Diamond Relat. Mater. 10 1058 doi: 10.1016/S0925-9635(00)00573-2
|
| [8] |
Paul R et al 2011 Appl. Surf. Sci. 257 10451 doi: 10.1016/j.apsusc.2011.06.144
|
| [9] |
Adhikari S et al 2005 Diamond Relat. Mater. 14 1824 doi: 10.1016/j.diamond.2005.06.028
|
| [10] |
Leal G et al 2017 Surf. Interface Anal. 49 99 doi: 10.1002/sia.6064
|
| [11] |
Fung M K et al 1999 Diamond Relat. Mater. 8 472 doi: 10.1016/S0925-9635(98)00334-3
|
| [12] |
Mousinho A P and Mansano R D 2007 Appl. Surf. Sci. 254 189 doi: 10.1016/j.apsusc.2007.07.115
|
| [13] |
Yu W et al 2007 Thin Solid Films 515 2949 doi: 10.1016/j.tsf.2006.08.038
|
| [14] |
Zhang J Q, Setsuhara Y and Kyoh S M 1997 Jpn. J. Appl. Phys. 36 6894 doi: 10.1143/JJAP.36.6894
|
| [15] |
Tachikawa M and Ikoma H 2000 Jpn. J. Appl. Phys. 39 1022 doi: 10.1143/JJAP.39.1022
|
| [16] |
Chen J L et al 2019 Plasma Sci. Technol. 21 025502 doi: 10.1088/2058-6272/aaee90
|
| [17] |
Huang T Y et al 2016 Sci. China Phys. Mech. Astron. 59 645201 doi: 10.1007/s11433-016-5794-8
|
| [18] |
Menegazzo N et al 2011 Analyst 136 1831 doi: 10.1039/c0an00503g
|
| [19] |
Zou Y S et al 2009 Vacuum 83 1406 doi: 10.1016/j.vacuum.2009.04.072
|
| [20] |
Chen Z Y et al 2000 J. Appl. Phys. 88 7060 doi: 10.1063/1.1326474
|
| [21] |
Safaie P, Eshaghi A and Bakhshi S R 2016 Diamond Relat. Mater. 70 91 doi: 10.1016/j.diamond.2016.10.008
|
| [22] |
Hayashi Y et al 2001 Diamond Relat. Mater. 10 1002 doi: 10.1016/S0925-9635(00)00566-5
|
| [23] |
Maddi C et al 2015 Appl. Surf. Sci. 332 346 doi: 10.1016/j.apsusc.2015.01.123
|
| [24] |
Safaie P, Eshaghi A and Bakhshi S R 2017 J. Non-Cryst. Solids 471 410 doi: 10.1016/j.jnoncrysol.2017.06.034
|
| [25] |
Ishpal P O S et al 2010 Appl. Surf. Sci. 256 7371 doi: 10.1016/j.apsusc.2010.05.075
|
| [26] |
Ferrari A C and Robertson J 2004 Phys. Eng. Sci. 362 2477 doi: 10.1098/rsta.2004.1452
|
| [27] |
Wei B, Zhang B and Johnson K E 1998 J. Appl. Phys. 83 2491 doi: 10.1063/1.367009
|
| [28] |
Tan I H et al 2004 Jpn. J. Appl. Phys. 43 6399 doi: 10.1143/JJAP.43.6399
|
| [29] |
Rahman M A et al 2011 Thin Solid Films 520 294 doi: 10.1016/j.tsf.2011.06.031
|
| [30] |
Zhou K et al 2015 Appl. Surf. Sci. 329 281 doi: 10.1016/j.apsusc.2014.12.162
|
| [31] |
Voevodin A A et al 2002 J. Appl. Phys. 92 4980 doi: 10.1063/1.1509106
|
| [32] |
Voevodin A A et al 2002 J. Appl. Phys. 92 724 doi: 10.1063/1.1481972
|
| [33] |
Clay K J et al 1996 J. Appl. Phys. 79 7227 doi: 10.1063/1.361439
|
| [34] |
Aldea E et al 1997 Jpn. J. Appl. Phys. 36 4686 doi: 10.1143/JJAP.36.4686
|
| [35] |
Bai K H et al 2002 Appl. Phys. Lett. 80 3907 doi: 10.1063/1.1479452
|
| [36] |
Ostrovskaya L Y 2002 Vacuum 68 219 doi: 10.1016/S0042-207X(02)00460-8
|
| [37] |
Gribanova E V et al 2000 Diamond Relat. Mater. 9 1 doi: 10.1016/S0925-9635(99)00184-3
|
| [38] |
Shen Y et al 2012 J. Roy. Soc. Interface 9 313 doi: 10.1098/rsif.2011.0278
|
Figures(11) / Tables(1)
Supported by: Beijing Renhe Information Technology Co., Ltd. 
| fN2 | 0% | 10% | 20% | 30% | 40% | 50% |
| Atomic | ||||||
| C | 96.5 | 94.08 | 92.4 | 87.2 | 83.14 | 78.62 |
| N | 0 | 2.72 | 3.5 | 8.5 | 12.36 | 18.28 |
| O | 3.5 | 3.2 | 4.1 | 4.3 | 4.5 | 3.1 |
DownLoad:
CSV