College of Applied Sciences, Shenzhen University, Shenzhen 518060, Peopleʼs Republic of China
2.
Shenzhen Key Laboratory of Ultraintense Laser and Advanced Material Technology, Center for Advanced Material Diagnostic Technology, and College of Engineering Physics, Shenzhen Technology University, Shenzhen 518118, Peopleʼs Republic of China
As an intense picosecond laser pulse irradiates a hydrocarbon target, the protons therein can be accelerated by the radiation pressure as well as the sheath field behind the target. We investigate the effect of the laser and hydrocarbon target parameters on proton acceleration with two/three-dimensional particle-in-cell simulations. It is found that the resulting two-ion species plasma can generate a multiple peaked charge-separation field that accelerates the protons. In particular, a smaller carbon-to-hydrogen ratio, as well as the thinner and/or lower density of the target, leads to a larger sheath field and thus proton beams with a larger cutoff energy and smoother energy spectrum. These results may be useful in achieving high-flux quasi-monoenergetic proton beams by properly designing the hydrocarbon target.
Target normal sheath acceleration (TNSA) [1–9] and radiation-pressure acceleration (RPA) [10–18] have been widely invoked as schemes for table-top proton acceleration through laser–matter interaction. In TNSA, protons on the target rear surface are accelerated by the intense charge-separation sheath field produced by the hot laser driven electrons that have propagated through the target. In RPA, the radiation pressure of an intense laser pushes forward the affected electrons of a dense target, producing a local charge-separation field that drives forward the target ions. Under suitable conditions, in RPA very energetic fast electrons can also propagate through the target and form behind it a charge-separation field for TNSA of the backside ions [19–28]. That is, ions can be multiply accelerated by the dual-peaked charge-separation field: RPA at the target front and TNSA at the target back. Moreover, with thin targets, relativistic-induced transparency (RIT) of the laser light can also occur [28–33]. The laser light can trap electrons and thus also enhance the backside charge-separation field for ion acceleration [22]. Such a complex ion acceleration process depends sensitively on the laser strength and pulse duration, as well as the target material and density profile [19, 20, 22–25, 28, 34].
In experiments, it is difficult to prepare pure single-ion targets and usually multi-ion targets are employed, such as hydrocarbon targets. In experiments and simulations of table-top proton acceleration, femtosecond lasers and solid hydrocarbon (CH) targets are often invoked [20, 35–42]. The target's massive carbon ions (here C6+) can strongly affect the charge-separation field and the hot-electron dynamics: they can stabilize the RPA process and enhance the resulting proton energy [35, 38–40]. In fact, proton beams with a higher cutoff energy but a broader spectrum are produced [20, 35, 38, 40]. Previous works are mainly based on femtosecond lasers, however proton acceleration from CH targets by longer laser pulses (such as a picosecond laser), as well as the effects of the carbon content, target thickness, and target density, which are important in designing more complex CH targets for achieving high-flux proton beams, still remains unclear.
In this paper, using the particle-in-cell (PIC) simulation code EPOCH [43], we simulate two/three-dimensional (2D/3D) interaction of a picosecond laser pulse with a profiled CH plasma target. The latter partially accounts for the preplasma and target expansion resulting from the laser impact, and can be fabricated by nanosecond laser ablation [25]. The effects of the laser and target parameters on RPA, TNSA, RIT, and the resulting protons are considered. It is found that the resulting two-ion species plasma can generate a multi-peaked charge-separation field that accelerates the protons in a hybrid regime. The hybrid proton acceleration process is analyzed in terms of the strength and multi-peaked distribution of the charge-separation field, which depends critically on the carbon ratio. In addition, it is found that a smaller carbon ratio and target thickness can lead to a higher cutoff and smoother spectrum of the proton beam energy. Our results can be useful in the design of multi-ion targets with inhomogeneous ion species distribution for obtaining tailored proton-beam properties with high flux, high conversion efficiency, and quasi-monoenergetic energy spectra.
2.
Simulation parameters
First we consider 2D simulations, the target is assumed to be pre-ionized and everywhere quasi-neutral, namely ne = np + ZnC, where Z = 6, ne, np and nC are the initial electron, proton, and carbon-ion number densities, given by nj=nj0sech(x/L), where j = e, p, C. Unless stated otherwise, the initial peak electron density is ne0 ~ 15ncr, i.e., in the density regime of 1022 cm−3, where ncr = meω2/4πe2 is the critical density, − e the electron charge, me the electron mass, and ω the laser frequency. Such density distributions can be obtained by nanosecond laser ablation [25]. We shall consider carbon-to-proton density ratios R = nC0/np0 = 9, 1, 1/9 (cases 1 to 3, respectively), corresponding to nC0/ncr = 2.5, 2.2, 1 and np0/ncr = 0.28, 2.2, 9, respectively, representing high to low carbon content of the target. Finding a hydrocarbon with exactly R = 1/9 may be difficult, but it should be possible to fabricate a mixture or compound of hydrogen and hydrocarbon with R = 1/9 as average. In addition, making hydrogen-enriched solid materials with very low R is at currently under intense research [44]. In our simulations, the effects of the peak density and effective thickness L of the target on the resulting protons shall also be studied.
In the simulations, the linearly-polarized spatially Gaussian picosecond laser pulse incidents normally in the x direction on the CH target centered at x = 0, y = 0, as shown in figure 1. The laser parameters are: peak intensity I0 ~ 5 × 10¹⁹ W cm−2, wavelength λ0 = 1.06 μm, spot radius r0 = 3 μm, and a flat-top profile with pulse duration τ = 1 ps. The simulation box is 80 μm by 30 μm, or −20 μm < x < 60 μm, −15 μm < y < 15 μm. It consists of 2500 × 1000 cells, with up to 240 electrons and 120 each of proton and carbon ions per cell. It has verified that these simulation resolutions are sufficient and the results are convergent by doubling the number of cells.
Figure
1.
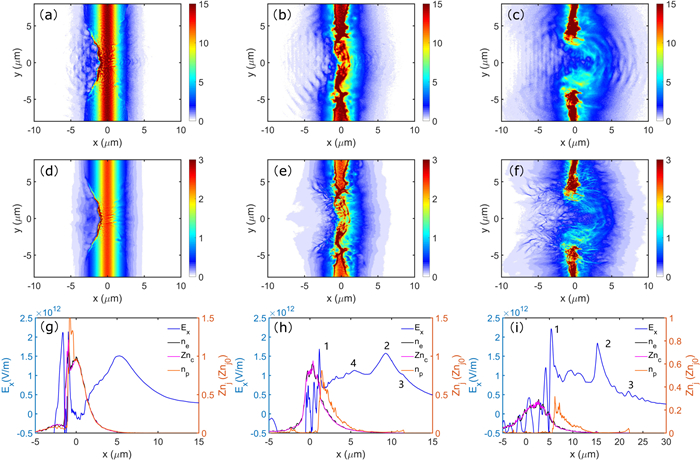
Results for R = 9 (Case 1) with L = 1 μm, at (left to right columns) t = 158 fs, 368 fs, and 578 fs after the laser incidence. Density (in units of ncr, same below) of (a)–(c) electrons and (d)–(f) carbon ions. (g)–(i) The charge-separation electric field Ex (blue, in V m−1), charge density (in units of initial value Znj0) of electron ne (black), carbon nC (purple) and proton np (orange). The numbers 1 to 3 in (i) and (h) refer to the three peaks of the charge separation field Ex associated with RPA, middle TNSA and rear TNSA, respectively. The number 4 in (i) represents the step-like charge-separation field caused by carbon ions.
The protons in the CH target are driven by the charge-separation electric fields created by the hot laser-expelled electrons. In the interaction involving long ps laser pulses and targets with multi-species ions, the fields responsible for the various acceleration mechanisms differ in space and time. In order to see the effect of the massive carbon ions, it is instructive to first consider Case 1 for R = 9. Figure 1 summarizes the distributions of the electrons (upper row) and carbon ions (center row), as well as the charge-separation field Ex and the particle charge densities Zjnj (bottom row) at t = 158, 368, and 578 fs (left to right columns). To see the effect of Ex on the acceleration of different protons, we separately track the protons initially located in x < 0 and x > 0 (recall that the center of the target is at x = 0), referring to them as front and rear protons, respectively. Figures 2(a)–(d) show the electric field and x-axis as experienced by typical highly accelerated front and rear protons, respectively, and figures 2(e) and (f) show the evolution of the maximum forward momentum for the front and rear protons. In the early stage (t < 158 fs), electrons are piled up and compressed by the laser radiation pressure, forming a forward propagating caviton with intense charge-separation field, as can be seen in figures 1(a) and (d). Protons and carbon ions are pulled forward by the intense double-layer field created by the highly compressed electrons. Here the normalized laser electric field is a0 = 6, so that the condition a20/√(1+a20)>0.78n0/nc for collisionless shock acceleration is not satisfied [45, 46]. This corresponds to the so-called hole-boring RPA (HB-RPA) [11, 12]. The proton velocity (~0.08c) obtained from the simulation is roughly twice the theoretical hole-boring velocity vHB=√I/mpnpc3∼0.04c, where I and mp are the laser intensity and proton mass, for a hydrogen plasma [13]. The corresponding electric field Ex is shown in figure 1(g). As can be seen from figures 2(a), (b), (e) and (f), it accelerates mainly the front protons before t = 105 fs. Between t = 105 and 263 fs, both the front and rear protons remain at around x = 0 μm, shown in figures 2(c) and (d). The front protons are between the HB-RPA and TNSA fields and experience a rather weak acceleration field, so that their forward momentum increases slowly in figure 2(e). In contrast, the rear protons are in the strong TNSA field, so that their forward momentum increases faster in figure 2(f).
Figure
2.
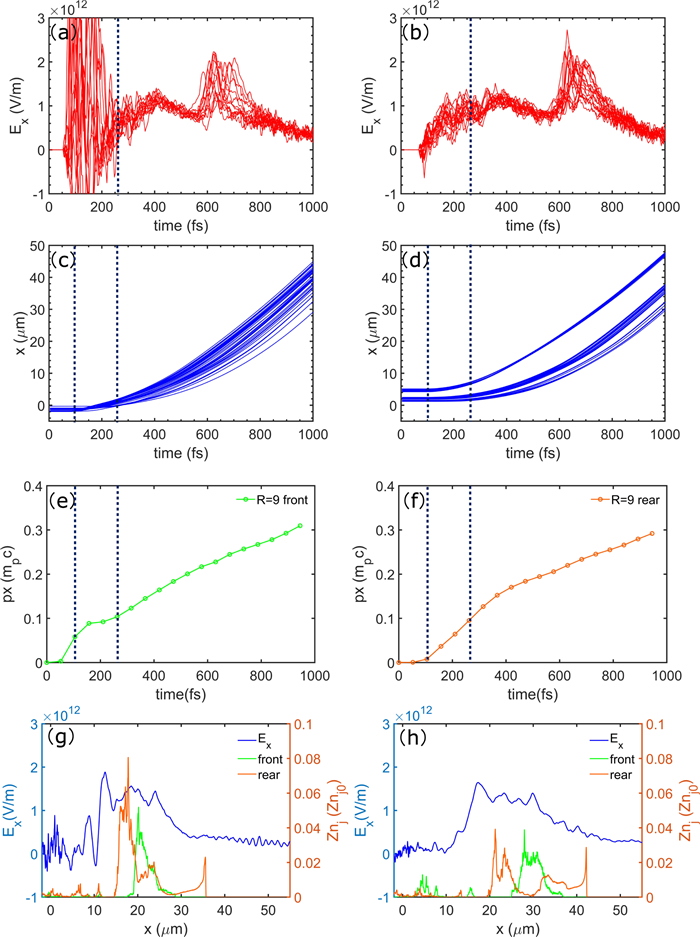
(a) and (b) Charge-separation field Ex (in V m−1) as experienced by typical accelerated energetic front (a) and rear (b) protons. The vertical black dashed lines mark the instant t = 263 fs. (c) and (d) Evolution of typical accelerated energetic front (c) and rear (d) protons along the x-axis (in μm). (e) and (f) Evolution of the maximum forward momentum (in mpc) of the front and rear protons for Case 1 (R = 9). The two vertical black dashed lines mark the instants t = 105, 263 fs. (g) and (h) The charge-separation electric field Ex (blue, in V m−1), charge density (normalized by its initial value Znj0) of the front (green) and rear (orange) protons np at t = 788 fs and t = 893 fs.
The effectiveness of HB-RPA of protons depends on the degree of RIT [47]. In the present case (R = 9) for high carbon content, the target's life time is relatively long, so are that for RPA and RIT. One can see in figures 1(b), (c), (e) and (f) that at t≳ 368 fs the target structure becomes unstable. Irregular local decreases of its density and thickness appear. The plasma layer gradually becomes transparent to the picosecond laser pulse, as the RIT condition a_0 \gg \omega_{\mathrm{e}}^2 L / 2 c \omega_0 [29], with ωe and L here the local plasma frequency and target thickness, becomes satisfied. In the period of 263 fs < t < 578 fs the picosecond laser can accelerate and heat a large number of electrons to enhance the charge-separation fields, as also can be shown in figures 1(h) and (i). Figure 1(h) shows that the charge-separation field is mainly composed of three parts: the RPA field peak (marked by 1), two peaks appear in the charge-separation field behind the target: a strong middle TNSA peak (marked by 2) and a weak rear TNSA peak (marked by 3). It is clarified that before RIT is well developed, the massive and highly charged carbon ions can limit the accelerated electrons from leaving the region, thus preventing the formation of rear TNSA field, but the dragged large portion of electrons is beneficial for the middle TNSA field. In addition, the middle TNSA field is also related to charge density of protons and carbon ions, and the rear TNSA field is also relevant to the proton density front, as indicated in figures 1(h) and (i). Besides, it is noted that a middle peak between peak 1 and peak 2 is affected by carbon ions which move slower than hydrogen at t \gtrsim 368 fs in figure 1(h), quasi-neutrality at the carbon ions front is disrupted and a charge-separation field is generated [48–50], shown as a step-like structure (marked by 4) near x = 5 μm between the RPA field peak and middle TNSA peak.
As the laser continues to push forward, the target becomes less stable and begins to disintegrate, further decreasing its effective thickness and density. RIT becomes fully developed at t \gtrsim 578 fs. The laser can now pass through, together with its trapped electrons. Three peaks in Ex are associated with the laser driven and/or trapped fast electrons and move forward rapidly, as can be seen in figure 1(i). Besides the RPA field peak (marked by 1) that has moved forward, peaks 2 and 3 have also moved about Δx = 5, 10 μm, respectively. The slower moving speed for peak 2 is due to carbon ions which drag hot electrons, while peak 4 merges with the RPA peak 1 and further enhances the RPA peak. The energetic electrons moving ahead of the proton front can also enhance the TNSA field, shown as peak 2 in figures 1(g)–(i). We also note that both the front and rear protons experience the almost same charge-separation field since t \gtrsim 263 fs in figures 2(a), (b) and (e)–(h): peak 4 and middle peak 2 between t \gtrsim 263 fs and t\lesssim 578 fs, then only the middle peak 2 before they enter the rapidly weakening field further behind the target, see figures 1(h) and (i) and 2(a), (b), (g) and (h). Thus, both proton groups can achieve high energies, as can be seen in figure 3(d). The front and rear proton groups experience the similar accelerating fields. However, the front protons were already driven by the RPA field in a short time period before 263 fs, and thus were responsible for the slightly higher cutoff energy in the spectrum, as shown in figure 3(b).
Figure
3.
Proton energy spectrum for Case 1 (R = 9) at t = 945 fs for (a) all protons, (b) front protons (green) and rear protons (orange). (c) The proton phase space px, x at t = 945 fs (color code for the proton number density in arbitrary units). (d) Initial distribution of protons at t = 1050 fs, the colorbar is for the proton energy in MeV.
It should be noted that our results are different compared with previous works which usually used femtosecond lasers and nanometer CH plane targets with uniform solid densities [14, 27, 28]. In the present case, the much longer interaction time for picosecond lasers leads to more complex multi-peaked field structures, in particular, the RPA peak merges peaks 4 (occurring at 578 fs in figure 1(i)) and 2 (occurring at 788 fs in figure 2(g)) successively, however, this merging seems to have little positive effect on proton energy because most of the protons have located in front of the merging peak since 578 fs in figure 1(i). While in the case of femtosecond lasers with short interaction times in previous works, the merging of the RPA peak with other charge-separation fields can greatly enhance proton energy [27, 28].
Next we consider Case 2 (R = 1). Evolution of the charge-separation field is shown in figure 4(a). Here the interaction between the picosecond laser and the CH target can still lead to RIT. As can be seen in figure 4(c), the reflectivity is similar to that of Case 1, and the onset time of RIT is also similar, but now earlier at t = 578 fs. There is still drag of the laser-driven hot electrons by the carbon ions, and the TNSA field is still double peaked. However, with far fewer carbon ions, here the drag is weaker compared with that in Case 1, as shown in figures 4(g)–(h), so that the rear TNSA field is stronger than that in Case 1, as shown in figures 4(a) and 1(i). The front protons undergo a similar acceleration process as in Case 1, namely driven first by the RPA field, then by the middle TNSA field, and finally by the rear TNSA field. The rear protons are driven mainly by the middle and rear TNSA fields. Such a hybrid drive results in larger (comparing to Case 1 in figure 3(a)) cutoff energy, as can be seen in figure 4(f). The less effective middle TNSA field leads to a reduction in the final energy and number of accelerated front protons, as well as a smoother energy spectrum in figure 4(b).
Figure
4.
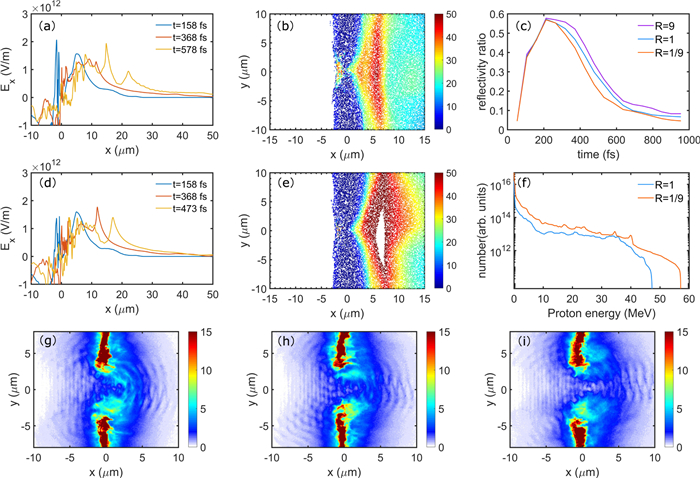
The upper row is for Case 2 (R = 1) and the lower row is for Case 3 (R = 1/9). (a) and (d) The charge-separation field Ex (in V m−1) at t = 158, 368, and (a) 578 and (d) 473 fs. (b) and (e) Initial distribution of the high-energy (colorbar in MeV, at t = 1050 fs) protons. (c) Evolution of the laser reflectivity (purple, blue and orange for Cases 1–3, respectively). (f) Proton energy spectra at t = 945 fs for Cases 2 and 3. (g)–(i) Electron density (in units of ncr) at t = 578 fs for Cases 1–3 (R = 9, 1, 1/9, left to right columns).
In Case 3 (R = 1/9) for still lower carbon content, the much weaker laser reflectivity can lead to early onset of RIT, so that the middle TNSA field has insufficient time to develop and remains weak, as shown in figure 4(d). On the other hand, since drag by the carbon ions is now much weaker than other cases, the laser-driven hot electrons can easily reach the target-back, as shown in figure 4(i), leading to a strong rear TNSA field, as shown in figure 4(d). Moreover, due to much weakened middle TNSA field, the front protons are much less accelerated than the rear protons. In contrast, the strong rear TNSA field can efficiently accelerate the rear protons throughout the interaction, leading to the largest proton cutoff energy among the three R cases. Figures 4(e) and (f) show that the high-energy protons are mainly from the rear of the target and the resulting energy spectrum is relatively smooth due to less energetic front protons.
For completeness, we have calculated the laser-to-proton/electron energy conversion efficiency. The former is 4.5%, 7.2%, 8.4% and the latter is 19%, 18%, 17% for R = 9, 1, 1/9 (Cases 1–3), respectively. That is, proton conversion efficiency is inversely related to the carbon content, while electron conversion efficiency is very close for these cases. Compared to previous results, such as 0.38% for R = 1/2 in [27] using femtosecond lasers, proton energy conversion efficiency is greatly enhanced in our work by the picosecond laser-driven hybrid acceleration mechanism. Meanwhile, the cutoff proton energy increases as the carbon content decreases, as shown in figures 3(a) and 4(f). In particular, if comparing with a pure hydrogen target with R = 0, the quality of the proton beam would be reduced. It is noted that such trend is different with femtosecond proton acceleration situations, where carbon content can modulate the charge-separation field and enhance the proton quality [14, 27, 48]. In the picosecond laser-driven case presented here, more complex field structures and acceleration processes are involved.
4.
Effect of the target density and thickness
We now consider the effects of the density and thickness of the CH target on proton acceleration. Since a comprehensive study of the possible combinations would involve too much computation time and resulting data, here we shall present only a few representative cases.
First we increase the peak plasma density to n0 = 30ncr, with the other parameters unchanged from Case 1. Note that in Case 1, RIT can enhance the RPA field and TNSA field. However, in this case with higher plasma density, the condition for RIT is not satisfied, so that the RPA field and the rear TNSA field are both weak, since the hot electrons are strongly dragged by the carbon ions. In addition, these fields are gradually reduced due to the thermal electron expansions. As a result, the front protons gain less energy in the RPA stage, and are mainly accelerated by the middle TNSA field. Overall, there are less accelerated protons and their energy is smaller than that in Case 1, as can be seen from the yellow curve in figure 5(a). Next we consider the effect of the target thickness, namely for L = 1/2 and 1/3 μm (recall that Case 1 is for L = 1 μm). Unless otherwise stated, the other parameters remain unchanged from Case 1. The steeper target-front density gradients associated with shorter targets can benefit the target-back charge separation field [2], since higher density gradients mean RIT and the middle charge-separation field would appear earlier and grow to higher strength, together with a stronger rear TNSA field. Accordingly, the front and rear protons can quickly merge and are driven by both of the fields. As a result, the cutoff energy in the spectra of the proton beams is much higher, as shown by the red and green curves in figure 5(a). The resulting proton cutoff energy is fifty percent increased compared with that in Case 1 with L = 1 μm.
Figure
5.
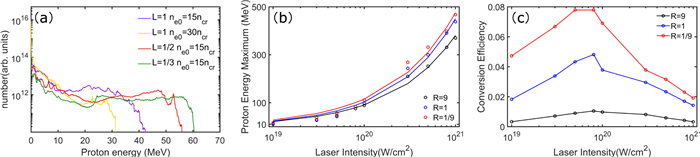
(a) Effects of the target thickness and density. Proton energy spectra at t = 945 fs. The purple curve is for L = 1 μm, ne0 = 15ncr (i.e., Case 1). The yellow curve is for L = 1 μm and ne0 = 30ncr. The red curve is for L = 1/2 μm and ne0 = 15ncr. The green curve is for L = 1/3 μm and ne0 = 15ncr. (b) Scaling of maximum proton energy (in MeV) with laser intensity (in W cm−2). Simulation results (circle dots) and fitted curves for Case 1 (R = 9, black), Case 2 (R = 1, blue) and Case 3 (R = 1/9, red). (c) Proton conversion efficiency versus laser intensity (in W cm−2) for Cases 1–3.
We have also studied the effect of the laser intensity on proton acceleration for I = 1 × 10¹⁹, 3 × 10¹⁹, 5 × 10¹⁹, 8 × 10¹⁹, 1 × 10²⁰, 3 × 10²⁰, 5 × 10²⁰, 8 × 10²⁰, 1 × 10²¹ W cm−2. The resulting maximum proton energy E_{\mathrm{p}, \max } scaling with the incident laser intensity I is shown in figure 5(b). It is shown that the maximum proton energy increases with the laser intensity and lower carbon ratio leads to much higher proton energy for a wide range of laser intensities. In addition, we also provide the relation between the laser-to-proton conversion efficiency and the laser intensity in figure 5(c), which shows that there is an optimal intensity at around ~ 8 × 10¹⁹ for efficient proton acceleration in all the three cases. Electrons are not thoroughly heated when the intensity is less than the optimal value, while RIT is easily triggered and less protons can capture the rapid moving charge separation field when intensity is larger than the optimal value. The lower carbon ratio also leads to a much higher proton energy conversion efficiency. In particular, the maximum proton conversion efficiencies of R = 1 and R = 1/9 are nearly 4.6 and 7.4 times that of R = 9. Additionally, in our considered cases with different plasma density profiles and/or laser intensities, the front and rear protons have similar cutoff energy, due to the fact that they almost merge at an early stage once the RIT is induced and are then driven by the similar fields.
5.
3D simulation results
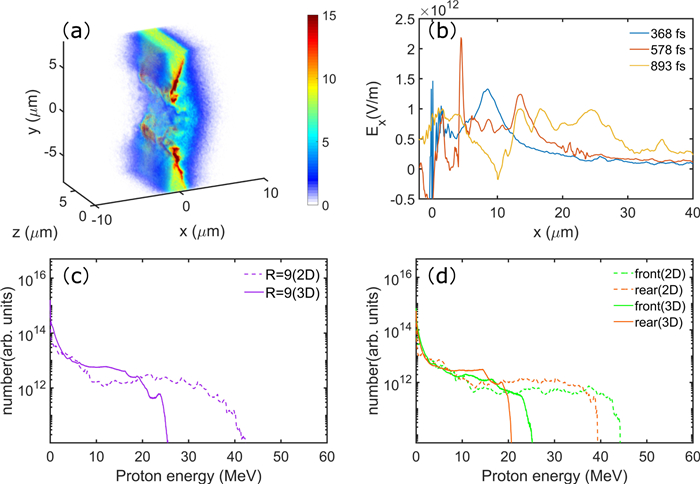
Since the number and cutoff energy of TNSA protons are often overestimated in 2D simulations [7, 51], we have also carried out full 3D simulations of the scheme. The 3D simulation result for the electron density at t = 473 fs is shown in figure 6(a). It shows that RIT occurs and the target becomes transparent to the picosecond laser pulse. The charge-separation field Ex in figure 6(b) also has multiple peaks: the RPA field peak, the strong middle TNSA peak, the weak rear TNSA peak and the middle peak in the early RIT stage at t = 368 fs, which is similar with that in the 2D case. However, the 3D charge-separation field Ex is noticeably weaker than that of the 2D case. The much weaker 3D charge-separation field can be associated with the lower temperature and density of the unconfined hot electrons, which expand more readily in 3D due to the additional degree of freedom. From t > 263 fs, both the front and rear protons are driven by nearly the same charge-separation field and finally driven by the weakened field at t = 893 fs. As shown in figure 6(d), additional acceleration of the front protons by the RPA peak leads to higher cutoff energy, similar to the 2D case. Figures 6(c) and (d) show the energy spectra of the total, front, and rear protons from the 2D and 3D simulations with the same initial parameters. One can see that although the profiles and overall proton number of the 2D and 3D spectra are similar, the cutoff energy of the 3D spectra is noticeably smaller than that of the 2D ones due to the weaker charge-separation field. In addition, the laser-to-proton energy conversion efficiency is 2.3% for the 3D case, and larger than the value 1.08% from [28] (also 3D) using femtosecond lasers. The total number of energetic protons in the 3D case is over 1012, which is also higher than that using femtosecond lasers. This suggests that at least for the parameter regime considered, the picosecond laser-driven hybrid acceleration scheme is more effective.
Figure
6.
3D simulation results for Case 1 (R = 9). (a) Electron density 3D distribution (in units of ncr) at t = 473 fs. (b) Charge-separation electric field Ex (blue, in V m−1) at 368, 578 and 893 fs. The proton energy spectrum for Case 1 (R = 9) at t = 945 fs for (c) all protons, (d) front protons (green) and rear protons (orange), dotted lines for 2D simulation and solid lines for 3D simulation.
We have used 2D and 3D PIC simulation to study the effect of carbon ions on proton acceleration from picosecond laser pulse interaction with a profiled CH target. It is shown that with a high carbon content, proton acceleration is through a modified RPA-TNSA hybrid process with a multi-peaked charge-separation field. The TNSA field, consisting of a mid and a rear component, is due to the competition of continuous electron acceleration/heating by the relatively long laser pulse and the drag of the massive carbon ions. The protons can be consecutively accelerated by the multi-peaked field, and a bunch of nonmonoenergetic protons with moderate peak energy is generated. With lower carbon content, target thickness, or density, the effect of the middle TNSA field is reduced and that of the rear TNSA field is enhanced, leading to proton beams with a larger cutoff energy and a smoother energy spectrum. Our results on the details of the charge-separation fields in long-pulse laser interaction with CH targets may be relevant to the design of composite targets with nonuniform carbon distribution for generating tailored proton beams.
Acknowledgments
This work is supported by the National Key R & D Program of China (No. 2016YFA0401100), National Natural Science Foundation of China (Nos. 12175154, 11875092, and 12005149), the Natural Science Foundation of Top Talent of SZTU (Nos. 2019010801001 and 2019020801001). The EPOCH code is used under UK EPSRC contract (EP/G055165/1 and EP/G056803/1).
Gopalakrishnan B, Khanna N and Das D 2019 Darkfermentative biohydrogen production Biohydrogen: A Volume in Biomass, Biofuels, Biochemicals ed A Pandey et al 2nd edn (Amsterdam: Elsevier) 79
Wei, Y., Wang, W., Zou, D. et al. Generation of quasi-monoenergetic proton beams from near-critical density plasmas irradiated by picosecond laser pulses. Physics of Plasmas, 2024, 31(11): 113105.
DOI:10.1063/5.0230044

 DownLoad: