International Joint Research Laboratory of Magnetic Confinement Fusion and Plasma Physics, State Key Laboratory of Advanced Electromagnetic Engineering and Technology, School of Electrical and Electronic Engineering, Huazhong University of Science and Technology, Wuhan 430074, People's Republic of China
2.
Department of Engineering and Applied Physics School of Physical Sciences, University of Science and Technology of China, Hefei 230026, People's Republic of China
3.
Institute for Fusion Studies, University of Texas, Austin TX 78712, United States of America
4.
Forschungszentrum Jülich GmbH, Institut für Energie- und Klimaforschung—Plasmaphysik, Partner of the Trilateral Euregio Cluster (TEC), Jülich 52425, Germany
5.
Institute of Plasma Physics, Chinese Academy of Sciences, Hefei 230031, People's Republic of China
To extend the operation region of the Joint-Texas Experimental tokamak (J-TEXT) to the divertor configuration and even the H-mode, the divertor configuration discharge has been realized for the first time in the J-TEXT tokamak. Along with the establishment of a power supply for the divertor configuration, the construction of relevant diagnostics, and the installation of the divertor target on the high-field side, divertor discharge has been tested. Through the equilibrium calculation and position stability analysis, the control strategy has evolved to be more stable. High-density experiments and auxiliary heating experiments have been carried out on the divertor configuration. The special midplane single-null (MSN) divertor configuration is shown to be more stable than the limiter configuration in the density limit condition and can reach a higher density in the experiment. In the ECRH experiment, the power injection enhances the electron temperature and density, while more heat outflux is loaded on the divertor target tiles and causes more intensive recycling and impurity release. The future plan for the divertor configuration operation in the J-TEXT tokamak is also included.
As the transition between the plasma core and the vacuum vessel wall, the plasma boundary is critical for the interaction of high-temperature plasma and plasma-facing materials (PFM) in the magnetic confined fusion device. There are two kinds of magnetic topology in the boundary area. One is the limiter configuration, in which a solid target surface directly intersects the magnetic field line and separates the core plasma and the scraped-off layer (SOL) by the last closed flux surface (LCFS). The other is the divertor configuration, in which the separatrix is defined by the point with a poloidal magnetic field of zero (X-point). In the divertor configuration, the target is further away from the plasma bulk than in the limiter configuration. The impurities released from the target are ionized and may be swept back by the plasma flow before entering the confined plasma in the divertor configuration [1].
The joint-Texas experimental tokamak (J-TEXT), formerly named TEXT/TEXT-U in the University of Texas at Austin in the USA, has been reconstructed and obtained the first plasma at the Huazhong University of Science and Technology in 2007 [2]. A typical discharge in J-TEXT is a limiter configuration with three moveable poloidal rail limiter targets at present [3], which limits the extension of its research achievement to the advanced tokamak with a divertor configuration. At Austin, an inner poloidal divertor has been designed in TEXT-U to study particle and energy confinement in the H-mode [4]. Fortunately, the divertor windings are retained in the reconstructed J-TEXT and the upgrade vacuum vessel for the divertor. The recovery of the divertor system was put forward in 2016. Along with the establishment of the divertor power supply, the construction of relevant diagnostics, and the installation of the divertor target in the high-field side (HFS), the divertor discharge has been tested from the end of 2018, and through the equilibrium calculation and position stability analysis, the control strategy has evolved to be more stable.
In this article, the realization of the divertor configuration in J-TEXT tokamak is demonstrated in detail in the sections below. Firstly, the divertor magnet and power system are described in section 2. Then, the design and installation of the divertor target are shown in section 3. In section 4, some diagnostics related to the identification of the divertor configuration are included. The equilibrium and stability in the divertor configuration are illustrated in section 5. Based on the above work, the first result of a stable divertor configuration discharge will be represented with diagnostics signals in section 6. The conclusion and future plans are at the end.
2.
Magnet and power system
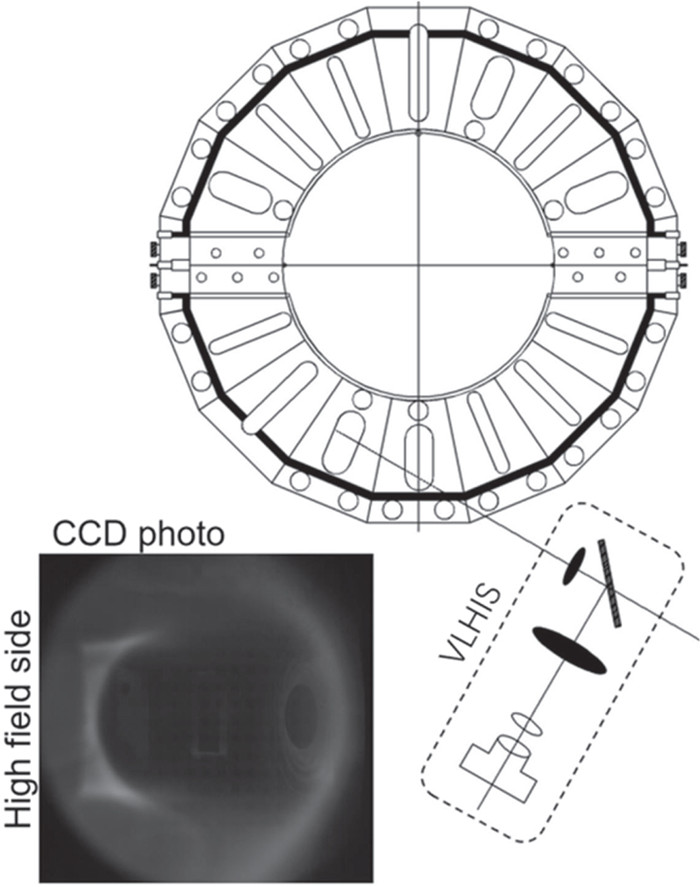
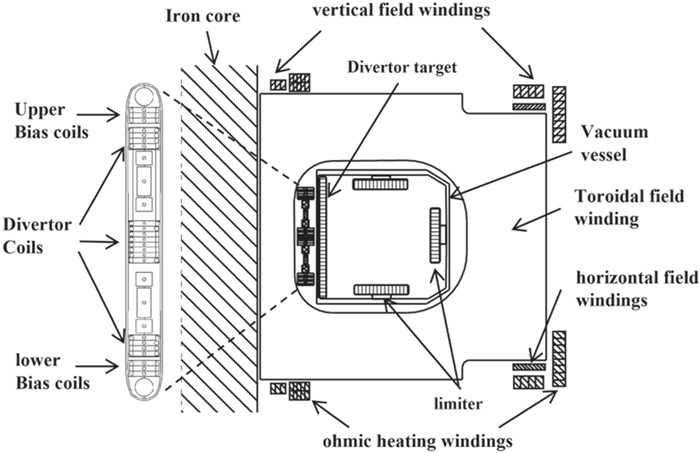
A cross-section of the J-TEXT tokamak and the poloidal coils are shown in figure 1. The inductive heating system includes the ohmic heating (OH) windings and an iron core with two back arms not shown in figure 1. The vertical field (VF) windings and horizontal field (HF) windings are devoted to controlling the plasma position actively. Through the windings above, a limiter configuration could be routinely formed. To discharge with a divertor configuration, divertor windings are necessary, as shown in the enlarged plot in figure 1. The divertor windings contain two functional components, one is the divertor (DV) coils, and the other is the auxiliary bias (BS) coils. The DV coils are divided into three sets with 4, 8, and 4 turns, respectively, distributing at the top, middle, and bottom of the inner cylinder. They are connected in series, and the current direction in the midplane is opposite to those in the top and bottom. The BS coils have an upper set and a lower set with three turns each. They are also connected in series, and their current directions are opposite. Henceforth, the current in the DV or BS coils is defined as positive if it is the same as the plasma current.
Figure
1.
Cross-section of the J-TEXT tokamak and the schematic of coils, vacuum vessel, limiter, divertor target, and iron core.
At present, the power supply for the DV coils has been established. Its control system is designed according to the J-TEXT CODAC (Control, Data Access, and Communication) standard [5]. The DV coils parameters and power requirements are listed in the previous work [6], which was inspired by the ITER CODAC and ITER instrumentation and control system. Because the national power grid cannot meet the pulse power requirements of the system, a 100 MW/6.9 kV/80 Hz pulse generator drives the DV power supply. The power system is designed to be a parallel 12-pulse converter structure and can work in 4-quadrant operation to drive different current directions. In the power supply test, the voltage and the DV current (Idv) have, respectively, achieved 400 V and 25 kA with a flattop of 500 ms.
3.
Divertor target construction
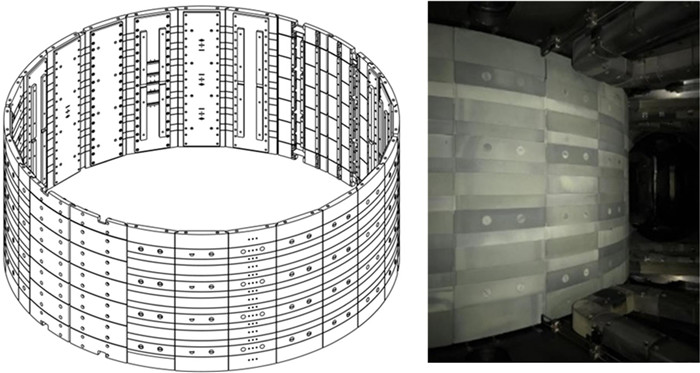
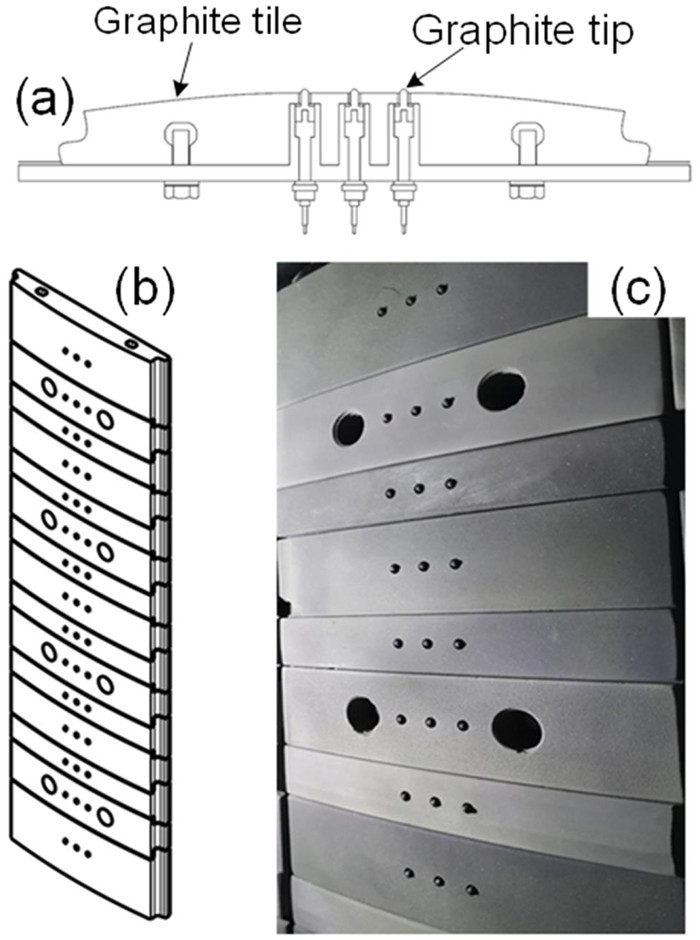
The vacuum vessel cross-section of J-TEXT is designed as a square with two beveled plates, as shown in figure 1. There are three movable poloidal limiters in the vessel at the top, low-field side (LFS), and bottom, which load the heat outflux in the limiter configuration. In the divertor configuration, the divertor is generated at the HFS, where the wall needs to be covered by tiles to bear the heat flow and reduce the impurity sputtering. J-TEXT tokamak previously had 16 vertical tile arrays, curved in the toroidal direction, covering only half of the wall surface at the HFS [7]. Nearly a divertor target fully covering the inner wall has been newly constructed to maximize the heat load handling capability in future research, as the schematic and photo show in figure 2.
Figure
2.
Schematic of fully covering divertor target and photo.
There are 26 vertical SiC-coated graphite tile arrays in this divertor target system. Each array, except the arrays besides the interface of vacuum vessel (VV) half sections, consists of about 15 imbricated tiles, which are mounted on one stainless-steel plate. The adjacent two arrays are also overlapped at the edge to ensure complete protection for the vessel wall, as shown in figure 2. Finally, the divertor target is exhibited as a cylinder from bottom to top with a surface diameter of 1508 mm, equivalently 296 mm from the center of the vacuum vessel (where R0 = 1050 mm). The fact that the minor radius of the divertor target (rtarget = 296 mm) is larger than those of the limiters (rlimiter = 250–290 mm) provides enough space for the divertor configuration, especially for the midplane single-null configuration discussed in the next section.
The installation of the tile arrays is complicated work due to the conflict with the previous in-vessel diagnostics, such as the magnetic probes. This kind of diagnostic is poloidally fixed and will intersect with the tiles. Hence, the support feet of the tile array should be away from the diagnostics, and the tile should also cover the probes. Practically, part of some diagnostics poloidal array, such as some poloidal Mirnov coils, have to be disassembled. Besides that, the tile arrays on both sides of the joint of the two VV half sections should be spatially separated due to the requirement of an insulating toroidal break.
4.
Equilibrium and stability
Plasma equilibrium and position stability are essential for a divertor configuration discharge. However, caused by the presence of the iron core and its back arms, the calculation of the equilibrium and stability becomes complicated. In the previous work [8], a 2-dimensional (2D) spool model considering the top and bottom back arms of the iron core had been developed to construct the corresponding function of the current to the magnetic field. Based on this model, the Grad–Shafranov equation can be solved numerically in the EFIT code [9] in a free condition, in which the currents in the external field coils are known and determine the plasma boundary. However, in the free boundary mode, the convergence of the Picard iteration [10] takes a long time and is even unstable. For stabilization, more constraints should be adopted for the plasma boundary, such as specifying two points expected to lie on the same flux surface or preprocessing through the filament model.
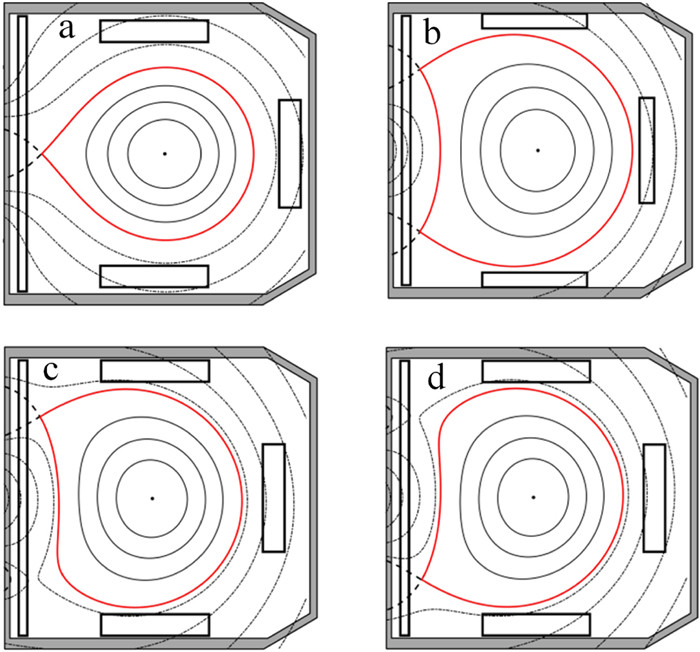
The poloidal flux contours of four baseline divertor configurations have been calculated before the test experiment through the equilibrium EFIT code, shown in figure 3. The positive and negative current in the middle DV coils produces the midplane single-null (MSN) and double-null (DN) configurations with a BS coil current of 0 A, respectively. With the negative current in the middle DV coils, the positive (negative) current in the upper (lower) BS coils produces the upper bias single null (USN), while an opposite current in BS coils would form a lower bias single null (LSN). In these baseline configurations, the particular MSN case is with a divertor at the HFS. The favorable field curvature model suggested that the divertor in the HFS could lower the power threshold for the L–H transition [11].
Figure
3.
Four different divertor configurations of J-TEXT, (a) middle single null (SN), (b) double null (DN) configuration, (c) upper bias single null (USN), and (d) lower bias single null (LSN) calculated with EFIT using spool model of the iron core. The solid red line indicates the last closed magnetic surface.
Position stability analysis is critical for the stable control of the plasma position before the test experiment. With the help of the spool model, the position stability has been analyzed. The MSN configuration faces an in–out radial position instability. Except for the coils, the iron core in the J-TEXT tokamak also destabilizes the plasma equilibrium. It needs to be considered when designing the position feedback system [8]. A proportion-differentiation (P-D) feedback controller could keep the plasma horizontal position stable if the growth time is longer than the response time of the power supply [12]. Nearly, the performance of the proportion-integration (P-I) feedback controller is also studied and a stable control scheme has been achieved from the guidance of the simulation and experiment results [13]. Therefore, the P-I feedback controller, which is also the control scheme in the limiter configuration, is still applied in the divertor configuration by modifying the control parameters.
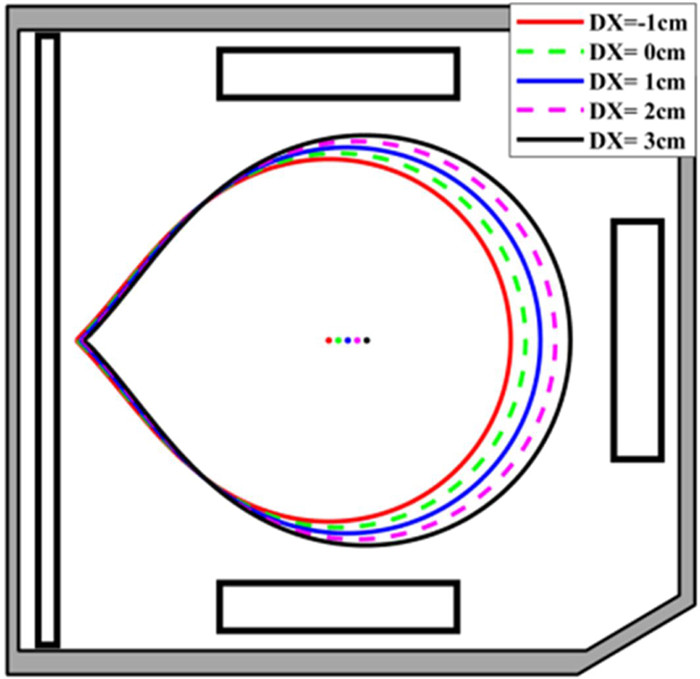
The in–out stability is relevant to magnetic field topology when the plasma is in equilibrium. A detailed study indicates that the Idv mainly contributes to the bad poloidal magnetic field curvature, causing the in–out instability [14]. In contrast, the magnetic field of the vertical field (VF) coils provides a stabilization component. Moving the plasma horizontal equilibrium position outward, which keeps the plasma farther from the DV coil and reduces the value of the Idv required for the X-point formation, can reduce the destabilization effect of the Idv The relationship between the field decay index n in the center of plasma and the plasma horizontal displacement DX relative to R0 has been listed in table 1.
Table
1.
Relationship between in–out instability and plasma position.
With the other aspect, the outward movement of the plasma horizontal position could also expand the plasma volume in the LCFS if the low-field limiter is far from the plasma position, as shown in figure 4. It keeps the accessibility of the diagnostics to the plasma, which is the feature of the J-TEXT tokamak [4].
Figure
4.
Expansion of the LCFS with outward movement of the plasma.
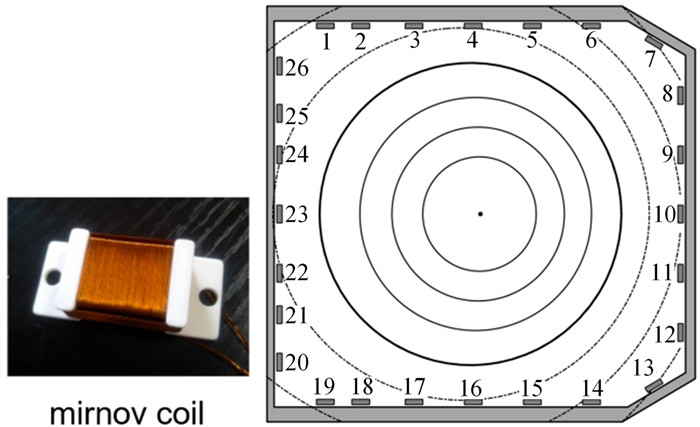
Several basic diagnostics have been established in the J-TEXT tokamak for the monitoring of the divertor configuration. The first one is the rectangular poloidal array of magnetic probes (RAMP) [15]. This array is composed of 26 2D magnetic inductive probes. It is poloidally mounted on the vacuum vessel wall at a single toroidal angle, as shown in figure 5. The effective areas (NS) and bandwidth of these probes are calibrated through the Helmholtz coils. The NS of the tangential direction along the vacuum vessel is 243–265 cm2, while the NS of the normal direction to the vacuum vessel is 336–383 cm2. The magnetic probe signal is integrated to output the intensity of the magnetic field, which is essential for reconstructing the plasma shape and position. The maximum sample frequency of data acquisition is 2 MHz.
Figure
5.
Photo of the magnetic coil (left) and schematic of the distribution of RAMP (right).
A comparison experiment [15] has been carried out to demonstrate that the magnetic field measurement with 4 kA VF coil current agrees with the results of two theoretical models, including the spool model and a three-dimensional numerical finite element model [16]. RAMP has been used for the limiter configuration equilibrium reconstruction by the EFIT code, as shown in figure 5.
A wide-angle visible light high-speed imaging system (VLHIS) has been newly installed on the J-TEXT tokamak to observe the spatial distribution of visible emission in the vacuum chamber [17]. The system views the plasma tangentially from a midplane port, as shown in figure 6. The optical system has been designed for viewing the vacuum chamber's whole cross-section and keeping the camera far from the chamber to avoid the influence of the toroidal magnetic field induced by TF coils. The cameras' parameters and external trigger acquisition system are designed to satisfy the spatial resolution (~1 cm) and temporal requirements (500 Hz with full frame, 10 kHz with a ninth of full frame).
Figure
6.
Schematic of VLHIS and photo of limiter configuration discharge.
In the data analysis, a spatial calibration based on Tsai's method [18] has been adopted to build the relationship between the 3D laboratory coordinate and the 2D image coordinate. Based on the coordinate transform, a tomographic reconstruction technique has been used to calculate the 2D poloidal emission profiles from the camera image with the assumption of toroidal symmetry of the radiation. Several experimental results are achieved, including viewing the discharge process in limiter configuration discharge, and methane injection experiments with a CIII-filter added.
The distribution of physical parameters on the divertor target, especially particle flux and power deposition, is fundamental to the study of SOL physics in the divertor configuration. In the J-TEXT tokamak, a divertor target Langmuir probe array (DVLPA) has been designed and installed simultaneously with the construction of the divertor target system. In the DVLPA, all the probes are fixed under one divertor tile array. Meanwhile, there are three tips inserted in each tile, as shown in figure 7. Finally, the probe tips form a 3 × 15 array. Its vertical space interval is 38 mm except for the top and bottom ones, while the toroidal space interval is 15 mm. The dome-shaped probe tips are graphite and insulated with the tile by the boron nitride (BN) ceramic.
Figure
7.
(a) Side view of DVLPA, (b) layout of array, (c) photo of DVLPA.
To obtain the plasma parameters in the divertor region such as electron temperature, electron density, particle, and heat flux simultaneously, three tips in one tile need to work as a triple probe. In this work mode, the middle tip is usually to measure the floating potential, and the others consist of a double probe with the biasing batteries. A data acquirement records the output signals with up to a 2 MHz sample rate.
6.
MSN divertor configuration discharge
6.1
Divertor discharge
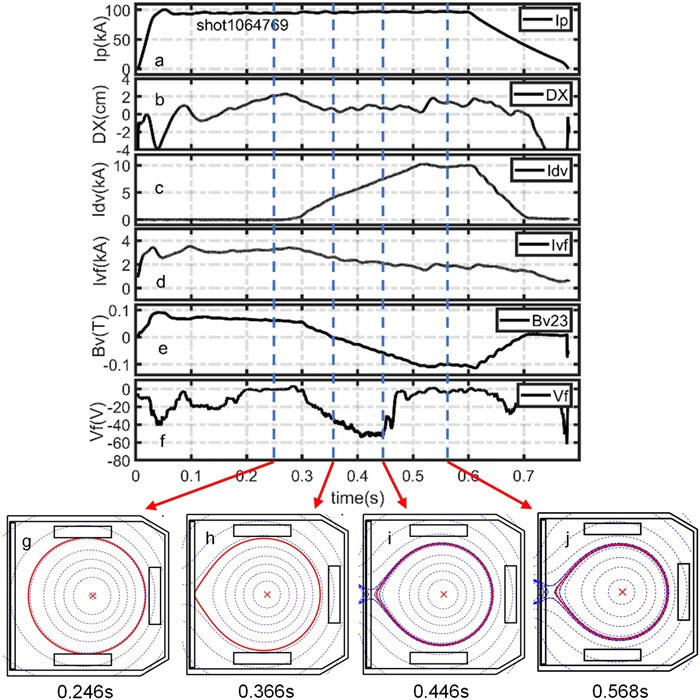
The divertor configuration discharge has been tested since the end of 2018. All the relevant systems, such as the DV and BS coil, the DV coil power supply, the magnetic probe array, VLHIS, and DVLPA, are gradually debugged and improved during the test experiments. Figure 8 shows a typical divertor configuration discharge. A series of the reconstructed flux surface contours exhibit some critical moments during the transition from the limiter to the divertor configuration at the bottom of figure 8. The red lines display the LCFS in limiter configuration or separatrix in divertor configuration.
Figure
8.
Typical divertor configuration discharge. Time evolutions of (a) plasma current, (b) plasma displacement, (c) divertor current, (d) vertical field coil current, (e) signal of number 23 probe in RAMP, (f) floating potential on the midplane divertor target. Slices of reconstructed flux surface contours at four moments (g)–(j).
In this shot, the basic discharge parameters are: Ip = 100 kA, Bt = 2 T, ne ~ 1.5 × 10¹⁹ m-3 with the minor radii of the outer limiter of 290 mm and the top and bottom limiters of 260 mm. The rectangle surrounded by the limiter and divertor target can provide a space for deformation from the circle in the limiter configurations to the oblate shape in the MSN divertor configuration. According to the in–out instability analysis in the previous section, the field decay index is closer to the stable region when the plasma position is near the LFS. So a more stable strategy for displacement control is adopted in this scenario as below. After the plasma current ramp-up, the horizontal position of plasma is firstly pushed outward to 2 cm away from the routine center of the limiter configuration step by step, as shown in figure 8(b). As soon as a buffering of the movement of plasma at 0.25 s, the divertor coil current starts to rise. The climb of Idv takes about 0.2 s to approach the current flattop, as shown in figure 8(c). During the Idv rising from 0.27 to 0.52 s, the plasma moves inward due to the attraction between the DV coil current and the plasma current. The feedback control system of the vertical field reacts to this movement soon, and the VF current IVF reduces simultaneously, as shown in figure 8(d).
The divertor configuration is generated during the ramp-up of the Idv The vertical magnetic field BV measured by the probe of number 23 in RAMP (figure 5) installed behind the divertor target tile in the midplane, starts to vary from positive towards negative at 0.27 s following the Idv shown in figure 8(e). The zero crossing of the BV at 0.366 s presents that an X-point is still behind the target tile, and has not entered the vacuum vessel deeply enough to generate a separatrix. So it is a deformed limiter configuration at this moment. By the DVLPA diagnostics, the floating potential Vf on the divertor target in the midplane can identify the formation of the divertor configuration. Along with the outward movement of plasma, Vf gradually vanishes from 0.15 to 0.2 s, as shown in figure 8(f), which means the plasma edge leaves away from the HFS. Since the Idv increases from 0.27 s, Vf drops firstly and then turns around at 0.446 s. During the period, the LCFS moves to and touches the HFS divertor target (a deformed limiter configuration in figure 8(h)), and then leaves again (figure 8(i)). The movement causes Vf variation. Finally, it comes back to zero for the second time, indicating a private area on the midplane target in the divertor configuration. The EFIT code has reconstructed an equilibrium flux distribution including the RAMP and Polaris data, which shows that the X-point is at Z=0 cm and R=78.75 cm, 3.25 cm away from the divertor target surface (figure 8(j)).
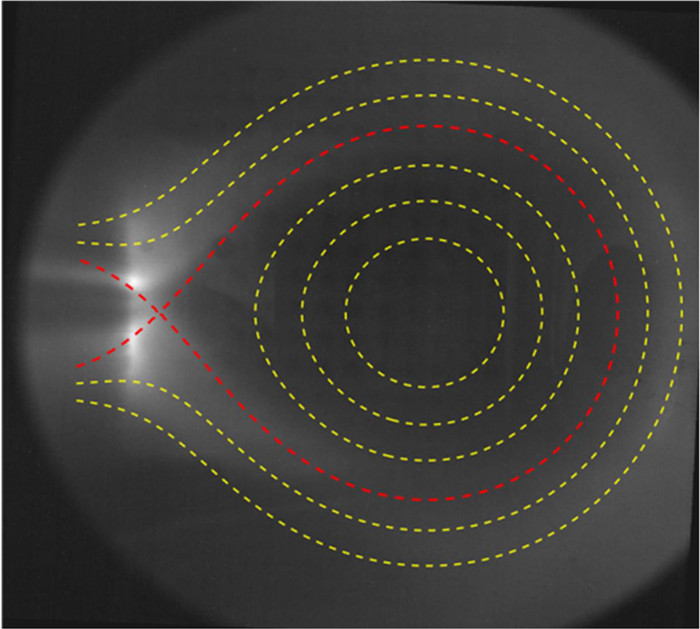
The spatial distribution of visible emission and the equilibrium reconstruction through the magnetic probe array and Polaris [19] provide more experimental observation of the divertor configuration. As shown in figure 9, the VLHIS without a filter captures the visible emission at 0.55 s. Almost all of the radiation is contributed by the Hα line radiation, which mainly distributes outside the LCFS. The most intensive emissions come from the HFS, especially near the divertor target, where most recycling occurs. In this area, between the upper and lower bright belts, a dark region comes to the front, which is the private region between the target and the X-point. A contour plot of the flux distribution overlaps on the visible imaging to demonstrate the divertor configuration in figure 9.
Figure
9.
Visible imaging captured by the VLHIS and equilibrium flux distribution of EFIT.
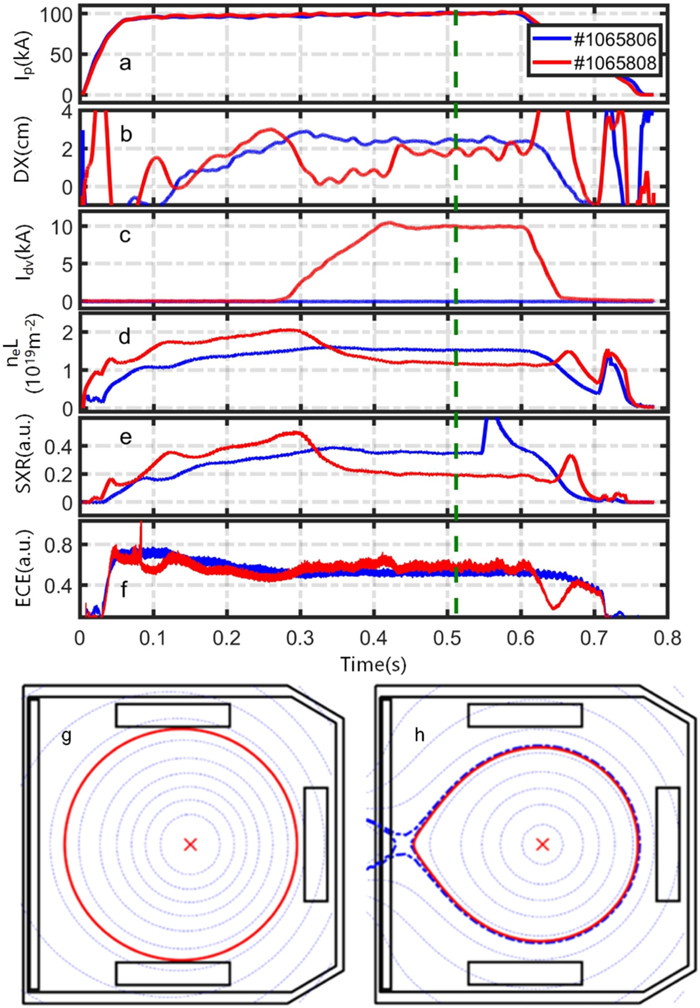
Plasma profiles in the MSN configuration, including density, temperature, and irradiation, are presented by comparison with the limiter configuration discharge in this part. Two shots, of which the shot 1065806 is a limiter configuration, and the shot 1065808 is an MSN configuration, are chosen with similar basic discharge parameters: Ip = 100 kA, DX ~ 2 cm in figures 10(a) and (b), the toroidal magnetic field Bt = 1.92 T, the outer limiter at r = 285 mm, and top and bottom limiters at r = 255 mm. In order to ensure a steady state in the divertor configuration, the Idv flattop remains for~0.2 s after a faster rising, as shown in figure 10(c). In J-TEXT, the line-averaged density is measured by the three-wave far infrared (FIR) laser-based Polarimeter-Interferometer system (POLARIS) [20]. The time traces of the line-averaged density at the rchord = 3 cm, the center-chord soft x-ray (SXR) signal, and the electron cyclotron emission signal (ECE) at r = 3 cm [21], are plotted in figures 10(e), (d) and (f), respectively.
Figure
10.
Time evolution of plasma parameters in limiter configuration (#1065806 blue) and divertor configuration (#1065806 red): (a) plasma current, (b) plasma horizontal displacement, (c) divertor current, (d) line-integrated electron density of rchord = 3 cm, (e) central channel SXR signal, (f) ECE signal (r = 3 cm). When t=0.513 s, the magnetic surface distribution of (g) the limiter configuration and (h) the divertor configuration.
The density and electron temperature are compared first. It is noted that the gas-fueling rate is similar in these two shots without density feedback control, but their wall conditions are different. In figure 10(d), the line-integrated density in the divertor shot is higher than that in the limiter shot before 0.3 s and then decreases with Idv until the current gets to the flattop at 0.42 s. It implies a fast particle loss during the configuration transition. Finally, in the steady phase of the DV configuration, the line-averaged density (red) is less than that (blue) in the limiter configuration. The variation of the SXR signal is similar to that of line-integrated density. From another aspect, they are both chord-integrated signals which are easily affected by the effective length of the chord. The chord effective length is shortened by the horizontal elongation of the magnetic flux surface at the bottom of figure 10. In contrast, the local relative electron temperatures are similar in the two configurations. It is noted that the signal of ECE is local, not chord integrated.
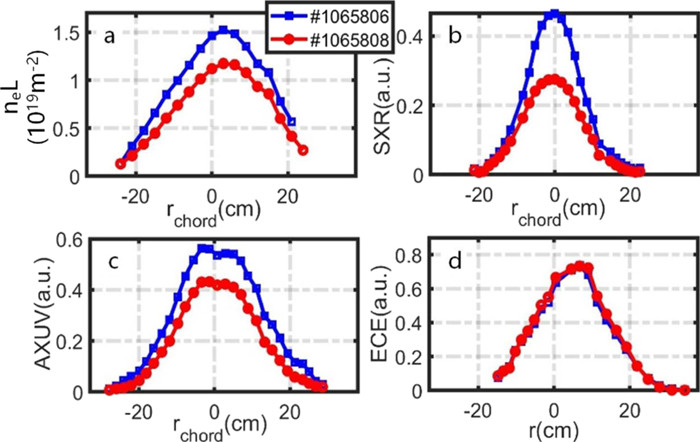
The magnetic flux surface shape affects the measured results of some diagnostics arrays. Figure 11 shows the line-averaged density, SXR, bolometry (AXUV), and electron cyclotron emission (ECE) at t=0.513 s. From these chord-integrated signals (figures 11(a)–(c)), there is an overall decrease in the amplitude distribution in the divertor configuration relative to the limit configuration. However, the relative distributions of local electron temperature are similar in these two configurations in figure 11(d). These results indicate that the plasma electron energy confinement has not to be affected by the reduction in plasma volume.
Figure
11.
At t=0.513 s, the comparison of the diagnostic signal in the limiter configuration (#1065806 blue) and the divertor configuration (#1065808 red): (a) string integral density, (b) soft x-ray array signal, (c) AXUV array signal, (d) ECE signal.
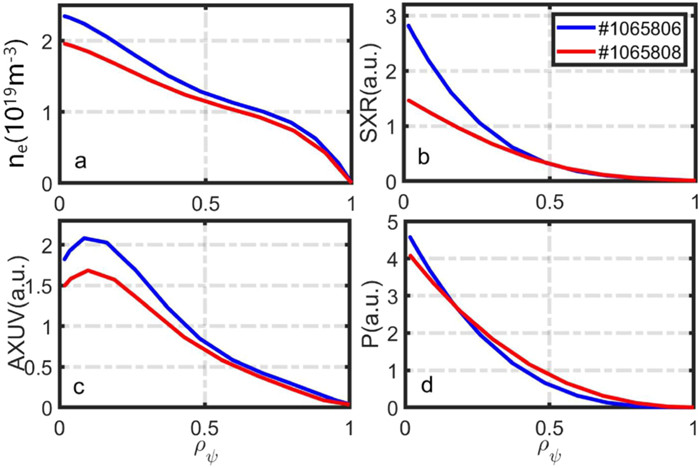
To eliminate the effect of shape varying, the inverse transform of line-integrated signals has been carried out with the cooperation of the EFIT and diagnostics. The resulting parameter profiles are compared in figure 12 with the normalized magnetic flux ρψ coordinate, where ρψ=ψ0−ψψ0−ψLCFS, ψ0 and ψLCFS are, respectively, the magnetic flux at the magnetic axis and the LCFS (limiter) or separatrix (divertor). From the inverse transform result, the plasma density distribution in the divertor configuration is less peaking than that in the limiter configuration, especially where the ρψ is less than 0.5 in figure 12(a). The emissions of SXR and AXUV in figures 12(b) and (c) are consistent with the density.
Figure
12.
At t=0.513 s the local diagnostic signals relative to normalized magnetic flux ρψ in the limiter configuration (#1065806 blue) and divertor configuration (#1065808 red): (a) density, (b) AXUV signal, (c) SXR signal, (d) pressure.
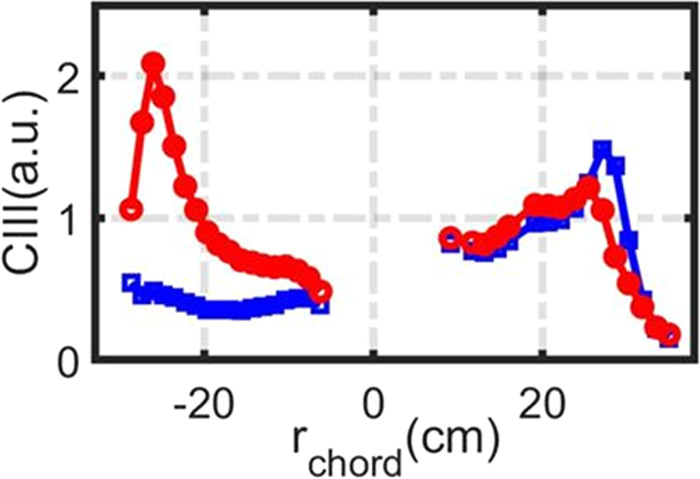
The divertor configuration is beneficial to reduce the heat load on the target and the impurity sputtering, such as carbon. Figure 13 shows the chord-integrated signal distribution given by the CIII array. Two sets of CIII arrays measure the chord-integrated radiation profile on the high and low-field sides, respectively, from top to bottom. From the blue-marked curve in figure 13, the CIII signal intensity in the limiter configuration is higher on the LFS than that on the HFS, and a peak appears close to the outermost closed magnetic surface on the LFS. In the divertor configuration (the red-marked curve), the CIII signal intensity on the HFS is higher than that on the LFS, and there is a peak on both sides. Furthermore, the peak on the HFS is steeper. Since the CIII radiation intensity is closely related to the source of carbon impurities, it is inferred from figure 13 that the carbon source in the limiter configuration mainly comes from the limiter target on the low-field side. In contrast, the carbon source in the divertor configuration primarily comes from the divertor target on the high-field side.
Figure
13.
At t=0.513 s, the CIII signal of high-field and LFS arrays in the limiter configuration (#1065806 blue) and the divertor configuration (#1065808 red).
A high-density experiment has been attempted in the divertor configuration. In these shots, the divertor configuration remains for~0.2 s through a faster rising and an extended flattop of the Idv At the same time, a gas puffing system gradually fuels the plasma to a high density close to the density limit disruption without feedback control. The radius of the top and bottom of the limiter is 255 mm, and the radius of the outer limiter is 285 mm.
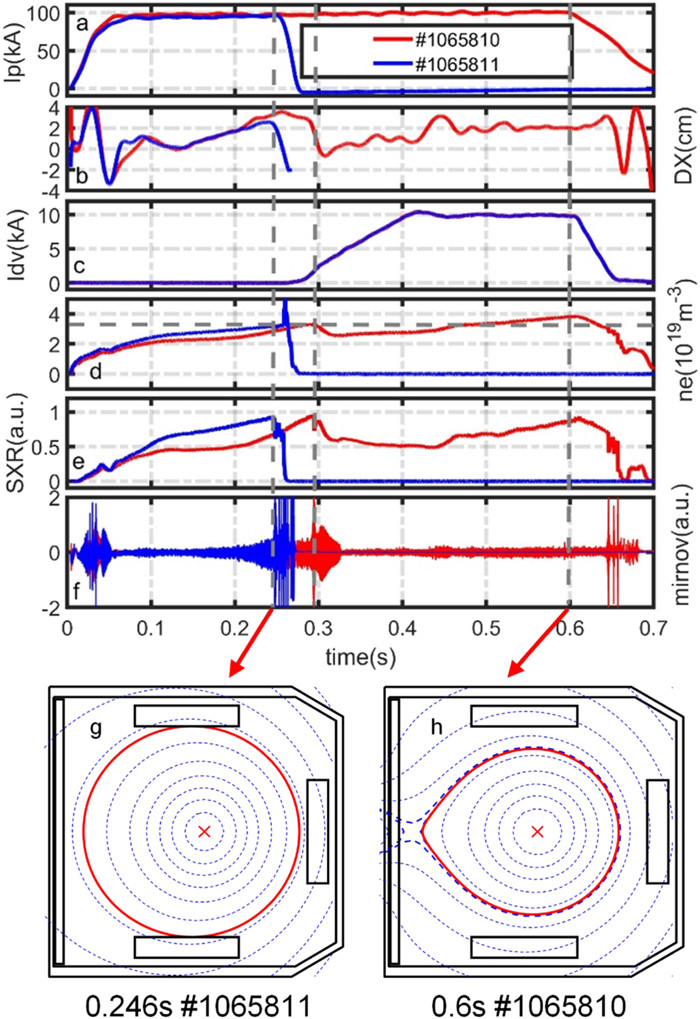
Figure 14 shows a representative shot (#1065810). For comparison, this figure also shows a density limit disruption shot (#1065811) before the rise of the Idv. Without the Idv, it is still in the limiter configuration at the disruption moment (figure 14(g)). In the limiter configuration, the density limit disruption occurs when the line-averaged density at rchord = 3 cm goes up to about 3.1 × 10¹⁹ m-3 at 0.25 s, as shown in figure 14(d). It reaches 63.3% of the corresponding Greenwald density limit nG = 4.9 × 10¹⁹ m-3. In the divertor configuration shot #1065810, though there is also a minor disruption that happens when the line-averaged density reaches 3.1 × 10¹⁹ m-3, the minor disruption does not deteriorate the whole magnetic flux surface topology. Then the discharge enters the divertor configuration during the Idv flattop, and the line-averaged density increases to 3.8 × 10¹⁹ m-3 without disruption at 0.6 s. The calculated Greenwald density limit in this situation is nG = 6.4 × 10¹⁹ m-3 after consideration of the elongation κ = 0.87 and the area of the poloidal cross-section S = 0.137 m2. The line-averaged density is also modified to be 4.9 × 10¹⁹ m-3 with a small vertical radius b = 0.2 m. It achieves 76.5% of the Greenwald density limit without disruption in the divertor configuration.
Figure
14.
High-density discharge (top) of limiter configuration (#1065811) and divertor configuration (#1065810): time evolution of (a) plasma current, (b) plasma displacement, (c) divertor current, (d) line-averaged density at rchord = 3 cm, (e) central soft x-ray, (f) Mirnov signal. Slices of reconstructed flux surface contours of two shots (g) and (h).
The SXR line-integral signals can indirectly illustrate the high line-averaged density in the divertor configuration. Figure 14(e) shows that the intensities of SXR in the two configurations are similar at the moment of the disruptions. It indicates that the enhancement of density eliminates the effect of shorted integral length. Moreover, as shown in figure 14(f), a magnetohydrodynamic instability rapidly grows to a high level before the density limit disruption in shot #1065811. In contrast, the magnetohydrodynamic instability keeps at a much lower level though the density is higher in shot #1065810. It implies that the density limit has not yet been reached. The MSN divertor configuration exhibits to be more stable when the density is near the Greenwald density limit in the experiments.
6.4
ECRH experiment
A 105 GHz electron cyclotron resonant heating system (ECRH) has newly been constructed in the J-TEXT tokamak [6], which is also tested in the divertor configuration discharge. The ECRH is launched in the 2nd harmonic X-mode from the low-field side. In this experiment, the outward push of plasma position and the ramp-up of the Idv are proceeded simultaneously to ensure enough flattop time. An enhancement of confinement is expected and the purpose is to prepare for the H-mode experiment.
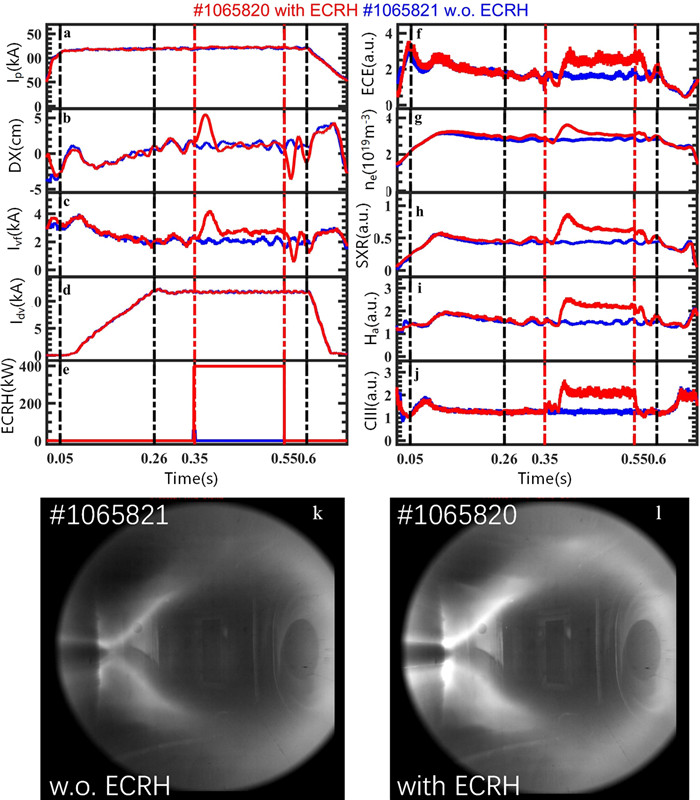
Two shots (#1065820 and #1065821) with/without ECRH are compared in this experiment. The discharges turn into the DV configuration at 0.26 s in shots, as shown in figure 15. Shot #1065820 is a reference shot without ECRH. The ECRH is turned on from 0.35 to 0.55 s with a nominal output power of 400 kW (figure 15(e)). The resonant layer is placed at R = 1.07 m according to the toroidal magnetic field of 1.91 T at R0 = 1.05 m. After the ECRH injection, the plasma moves outward with an enhancement of the electron temperature immediately, as shown in figure 15(b), and when the plasma is pulled back to an equilibrium state by the reaction of the vertical field feedback system, the electron temperature and the density are higher than those in the reference shot during the ECRH injection (figures 15(f) and (g)). At the same time, the intensities of radiation from the Hα and CIII become stronger (figures 15(i) and (j)). This is consistent with the enhanced intensity of the visible emission near the divertor target in figure 15(l). The enhanced radiation illustrates that more heat is loaded on the divertor target tiles and causes more intensive recycling and more release of impurity. So it is hard to conclude that the confinement becomes better.
Figure
15.
Comparison between shots with ECRH and without ECRH: time evolution (top) of (a) plasma current, (b) plasma displacement, (c) vertical field coil current, (d) divertor current, (e) ECRH power, (f) ECE signal, (g) line-averaged density, (h) SXR signal, (i) Ha signal, (j) CIII signal. Visible emission photo (k) and (l).
Based on a series of preparations, such as the divertor power supply, the divertor target, and relevant diagnostics, the divertor configuration discharge has been realized for the first time in the J-TEXT tokamak. There are two functional components of divertor windings: the divertor coils and the auxiliary bias coils. With the different current directions in these coils, they can afford four baseline divertor configurations: middle single-null (MSN), double-null (DN), upper single-null (USN), and lower single-null (LSN). The power system can operate in four quadrants to realize these different configurations, and the Idv has achieved 25 kA with a flattop of 500 ms. Graphite tiles cover the inner chamber wall on the HFS to handle the more considerable power in future research.
Through the equilibrium EFIT code and spool model, both the equilibrium and the position instability have been analyzed. The result shows that, as a unique baseline configuration with a divertor at the HFS, the MSN case faces severe in–out radial instability. Nevertheless, the field decay index is closer to the stable region when the plasma is near the low-field side. In the DV configuration experiment, the low-field limiter is moved outward first. Then in the discharge, the horizontal position (X) of plasma is pushed outward to 2 cm away from the routine center of the limiter configuration step by step before the ramp-up of the Idv Finally, according to the relevant diagnostics and an equilibrium flux distribution reconstruction, a controllable MSN divertor configuration is formed with an X-point at Z=0 cm and R=78.75 cm, 3.25 cm away from the divertor target surface.
High-density experiments and auxiliary heating experiments have been attempted in the divertor configuration to explore the performance of the MSN divertor configuration. In the former, the central density of 4.9 × 10¹⁹ m-3 is achieved, which is 76.5% of the Greenwald density consideration of the elongation and the contraction of the minor radius. The high-density experimental result mentioned above demonstrates that the MSN divertor configuration is more stable than the limiter configuration when the density is near the Greenwald density limit. In the ECRH experiment, the power injection enhances the electron temperature and density. At the same time, more heat outflux is loaded on the divertor target tiles and causes more intensive recycling and impurity release.
In the future, the divertor configuration in the J-TEXT will support the extension of the disruption mitigation research to the divertor regime and even the H-mode scenarios. The special high-field-side poloidal divertor configuration with a midplane single null (HFS-MSN) is more attractive. Its X-point is just in the HFS midplane, where the impurities are easily concentrated such as the multifaceted asymmetric radiation from the edge (MARFEs) in the limiter configuration. The HFS-MSN effects on the density limit, correlated impurity transport, radiating divertor and detachment become future research objects. In addition, based on the electrode biasing system in the J-TEXT, a biasing divertor target is going to be constructed to investigate the impact of electric field on the up–down asymmetry of divertor heat loads and the load distribution on the target, such as the power decay length, λq
Acknowledgments
The authors would like to thank the members of the J-TEXT team for their assistance in the experiment. This work was supported by the National MCF Energy R&D Program of China (Nos. 2018YFE0301104 and 2018YFE0310300), and National Natural Science Foundation of China (No. 51821005).
Edmonds P H et al 1988 The design of an inner poloidal divertor for the TEXT tokamak Fusion Technology ed A M Van Ingen, A Nijsen-Vis and H T Klippel (Amsterdam: Elsevier)
Edmonds P H, Wang S J and Solano E R 1990 Simulation studies of the text upgrade plasma radial stability using an exact power supply model (EMTP) Fusion Technology ed B E Keen et al (Amsterdam: Elsevier)

 DownLoad: