Yu ZHANG, Haozhe WANG, Tao HE, Yan LI, Ying GUO, Jianjun SHI, Yu XU, Jing ZHANG. The effects of radio frequency atmospheric pressure plasma and thermal treatment on the hydrogenation of TiO2 thin film[J]. Plasma Science and Technology, 2023, 25(6): 065504. DOI: 10.1088/2058-6272/acb24e
Citation:
Yu ZHANG, Haozhe WANG, Tao HE, Yan LI, Ying GUO, Jianjun SHI, Yu XU, Jing ZHANG. The effects of radio frequency atmospheric pressure plasma and thermal treatment on the hydrogenation of TiO2 thin film[J]. Plasma Science and Technology, 2023, 25(6): 065504. DOI: 10.1088/2058-6272/acb24e
Yu ZHANG, Haozhe WANG, Tao HE, Yan LI, Ying GUO, Jianjun SHI, Yu XU, Jing ZHANG. The effects of radio frequency atmospheric pressure plasma and thermal treatment on the hydrogenation of TiO2 thin film[J]. Plasma Science and Technology, 2023, 25(6): 065504. DOI: 10.1088/2058-6272/acb24e
Citation:
Yu ZHANG, Haozhe WANG, Tao HE, Yan LI, Ying GUO, Jianjun SHI, Yu XU, Jing ZHANG. The effects of radio frequency atmospheric pressure plasma and thermal treatment on the hydrogenation of TiO2 thin film[J]. Plasma Science and Technology, 2023, 25(6): 065504. DOI: 10.1088/2058-6272/acb24e
New Energy Materials and Devices, College of Science, Donghua University, Shanghai 201620, People's Republic of China
2.
Textile Key Laboratory for Advanced Plasma Technology and Application, China National Textile and Apparel Council, Shanghai 201620, People's Republic of China
3.
Magnetic Confinement Fusion Research Center, Ministry of Education, Shanghai 201620, People's Republic of China
The effects of radio frequency (RF) atmospheric pressure (AP) He/H2 plasma and thermal treatment on the hydrogenation of TiO2 thin films were investigated and compared in this work. The color of the original TiO2 film changes from white to black after being hydrogenated in He/H2 plasma at 160 W (gas temperature ~381 ℃) within 5 min, while the color of the thermally treated TiO2 film did not change significantly even in pure H2 or He/H2 atmosphere with higher temperature (470 ℃) and longer time (30 min). This indicated that a more effective hydrogenation reaction happened through RF AP He/H2 plasma treatment than through pure H2 or He/H2 thermal treatment. The color change of TiO2 film was measured based on the Commission Internationale d'Eclairage L*a*b* color space system. Hydrogenated TiO2 film displayed improved visible light absorption with increased plasma power. The morphology of the cauliflower-like nanoparticles of the TiO2 film surface remained unchanged after plasma processing. X-ray photoelectron spectroscopy results showed that the contents of Ti3+ species and Ti–OH bonds in the plasma-hydrogenated black TiO2 increased compared with those in the thermally treated TiO2. X-ray diffraction (XRD) patterns and Raman spectra indicated that plasma would destroy the crystal structure of the TiO2 surface layer, while thermal annealing would increase the overall crystallinity. The different trends of XRD and Raman spectra results suggested that plasma modification on the TiO2 surface layer is more drastic than on its inner layer, which was also consistent with transmission electron microscopy results. Optical emission spectra results suggest that numerous active species were generated during RF AP He/H2 plasma processing, while there were no peaks detected from thermal processing. A possible mechanism for the TiO2 hydrogenation process by plasma has been proposed. Numerous active species were generated in the bulk plasma region, accelerated in the sheath region, and bumped toward the TiO2 film, which will react with the TiO2 surface to form OVs and disordered layers. This leads to the tailoring of the band gap of black TiO2 and causes its light absorption to extend into the visible region.
Titanium dioxide (TiO2) is a widely used multifunctional n-type semiconductor material with several advantages, such as great accessibility, excellent stability, nontoxicity, high photocatalytic properties and moderate cost, making it an attractive candidate for a wide range of potential applications in H2 production, photovoltaics, photocatalysts, lithium-ion batteries, fuel cells, gas sensors, detoxification and supercapacitors [1–11]. Nevertheless, the light absorption range of TiO2 is limited to the ultraviolet (UV) region (< 5%) due to its wide band gap (anatase: 3.2 eV, rutile: 3.0 eV) [12]. In order to expand and improve the light utilization, many strategies have been developed to tailor the TiO2 band gap, including doping, composite formation, sensitization, co-catalyst loading, etc [13]. Hydrogenation, as one of the common doping strategies, has also been investigated [14–17]. The black coloration and improved visible light response of hydrogenated TiO2 have been considered as promising ways to enhance solar absorption and photocatalytic activity [18–22].
Table 1 summarizes the thermal and plasma hydrogenation strategies, preparation method, reaction conditions and possible hydrogenation mechanism. Chen et al [18] hydrogenated TiO2 nanoparticles in a 20 bar H2 atmosphere at about 200 ℃ for 5 days. Wang et al [19] treated TiO2 in a tube furnace filled with ultrahigh purity H2 atmosphere at 200 ℃‒550 ℃ for 30 min, and Lu et al [23] hydrogenated TiO2 in a 35 bar H2 atmosphere at about 15 ℃ for 3‒20 days. The hydrogenated (black) TiO2 is obviously superior to pristine (white) TiO2 in optical absorbance [18, 19, 23], photocatalytic H2 generation [18, 19, 23] and methylene blue (MB) and phenol degradation [18].
Table
1.
Summary of the literature on the preparation of black TiO2 by hydrogenation. Abbreviations: atmospheric pressure (AP), oxygen vacancy (OV) and inductively coupled plasma (ICP).
However, the practical use of the above thermal methods is limited due to the harsh treatment conditions (high pressure and/or temperature H2 atmosphere, long time). Comparatively, plasma presents an energy efficient and sustainable approach to preparing black TiO2. Wang et al [20] hydrogenated TiO2 in a thermal plasma furnace (200 W) using H2 plasma for 4‒8 h at 500 ℃. Yan et al [21] treated TiO2 using an inductively coupled plasma (3000 W) under a 25.8–27.1 mTorr H2 atmosphere at 150 ℃ for different times (30 s, 1, 3, 5 and 20 min). Ren et al [24] reduced TiO2 using radio frequency (RF) plasma (13.56 MHz, 300 W) under a 200 mTorr Ar/H2 atmosphere at 200 ℃ for 1 min. These cases have shown that low pressure plasma has high hydrogenation efficiency, decreasing preparation time. However, the process needs a vacuum chamber and pump, with expensive costs and complicated operation. Atmospheric pressure (AP) plasma has also been used to prepare black TiO2 and has shown high hydrogenation efficiency, reducing equipment and handling costs [25]. In our previous work [26], TiO2 coated on Ni foam was successfully hydrogenated by RF AP He/H2 plasma within a short time (5 min). The prepared black TiO2 film presented good visible light absorption and photocatalytic activity in MB degradation. The temperature in the reaction chamber was about 425 ℃ at 180 W.
From these previous works, it can be seen that high pressure or AP H2 thermal treatment usually takes a long time and generates both bulk and surface defects [27, 28], while plasma hydrogenation is mainly a surface activated process (high-energy species bombardment) and creates surface defects effectively without deterioration of the bulk [20, 21]. However, the temperature of RF AP plasma discharge usually reaches several hundred degrees Celsius without external heating [26]. Hence, the effects of high-energy species bombardment and high temperature on TiO2 hydrogenation are coupled together for RF AP plasma hydrogenation. It is necessary to clarify what the different effects of the plasma and the discharge gas temperature on the hydrogenation process are. Furthermore, the presence of Ti3+ species, oxygen vacancies (OVs), Ti–OH groups [29] and Ti–H bonds [20] strongly depends on the hydrogenation process and parameters. The role of H2 in creating this defect doping also deserves to be investigated.
In this paper, we report on and compare the TiO2 film hydrogenation process using RF AP He/H2 plasma and thermal annealing at the same discharge gas temperature in order to research the key effects of the processes. The color of the original TiO2 film changes from white to black after being hydrogenated in He/H2 plasma at 160 W (gas temperature ~381 ℃) within 5 min, while the color of the thermally treated TiO2 film did not change obviously, even in pure H2 or He/H2 atmosphere with higher temperature (470 ℃) and longer time (30 min). The effects of He/H2 plasma and thermal treatment on the optical absorbance, chemical composition, crystalline structure and surface morphology of TiO2 film were investigated and discussed. A possible mechanism analysis of the hydrogenation process was also proposed. The investigation will provide a novel insight into the preparation of black TiO2 thin film with high visible light response activity.
2.
Experiment
2.1
Preparation of TiO2 thin films
TiO2 thin films were prepared using AP dielectric barrier discharge-enhanced chemical vapor deposition. An AC power supply of 10 kHz (CTP-2000K, Nanjing Suman Electronic Co., Ltd, China) and a homemade quartz discharge chamber (discharge gap: 2.0 mm) were employed in this experiment. Titanium tetrachloride (TiCl4, ≥98.0%, Sinopharm Chemical Reagent Co., Ltd, China) was selected as the titanium precursor. A bubbler containing TiCl4 was immersed in a water bath which was heated and maintained at 40 ℃. The connecting tube from the bubbler to the discharge chamber was kept at 70 ℃ using a heating band to prevent the TiCl4 vapor from condensing. Ar (99.99%, Shanghai Central Gases Co., Ltd, China) was used as the discharge and carrier gas. O2 (99.99%, Shanghai Central Gases Co. Ltd, China) was used as the reactive gas. The gas flow rates were controlled by mass flow controllers (MFCs, Beijing Sevenstar Electronics Co., Ltd, China) and set as Ar: O2: carrier gas (TiCl4) =600:15:25 ml min−1. A quartz slice (1.5 × 2.0 × 0.5 mm3) was used as the substrate and placed into the discharge chamber after cleaning with ethanol and deionized water. The quartz substrate was heated by an electric heater (at the bottom of the reactor) and the heating temperature was measured and monitored by a thermocouple. More details of the experiment can be found in our previous work [43].
When the substrate was heated to and maintained at 300 ℃, discharge gas (Ar) was put into the chamber for about 5 min to remove the air in the device. The precursor gas (TiCl4) and O2 were put in the reactor and the discharge was on. The input voltage and current were set at about 8.2 kV and 13.0 mA, respectively. The discharge frequency was adjusted to 14.68 kHz. After 30 min deposition, a white TiO2 thin film was obtained, and this was named Original.
2.2
H2 plasma treatment
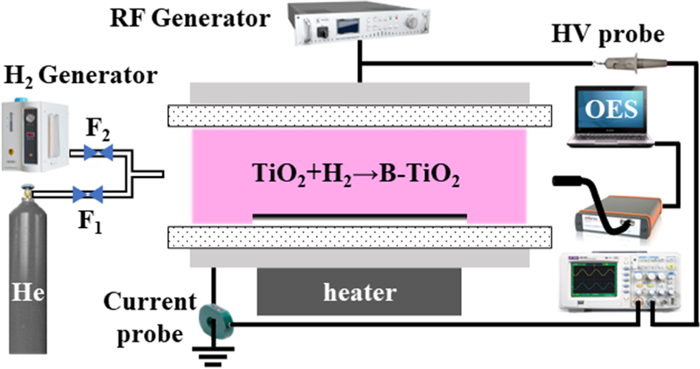
TiO2 thin films as-deposited were hydrogenated by RF AP He/H2 plasma. Figure 1 presents a schematic diagram of the experimental setup for the hydrogenation process. The hydrogenation process of TiO2 thin film was operated in the same quartz discharge chamber. An RF generator (RF-10S/PWT, Advanced Energy Co. Ltd, USA) was employed, and the discharge power was set at four different powers (40, 80, 120 and 160 W). He (99.99%, Shanghai Central Gases Co., Ltd, China) was used as the discharge gas and H2 was used as the reduced agent. The H2 was supplied by decomposing deionized water via a H2 generator (QL-300, Shandong Saikesaisi Hydrogen Energy Co., Ltd). The gas flow rates were controlled by MFCs and set as He: H2 = 600:15 ml min−1. The treatment time was 5 min. The treated samples were obtained and were named P40, P80, P120 and P160, respectively.
Figure
1.
Schematic diagram of the experimental setup for the hydrogenation process.
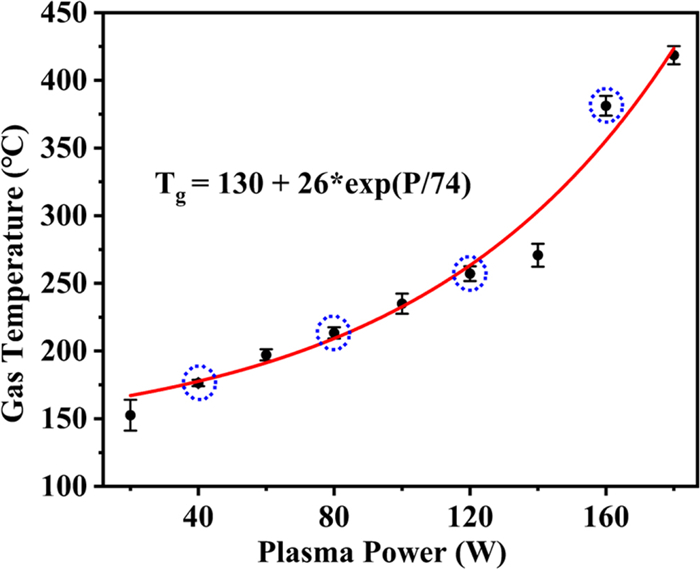
There was no external heating during the plasma discharge. The gas temperatures (Tg) during different plasma power applications were obtained through simulation analysis based on the OH peak (309 nm) of the plasma optical emission spectroscopy (OES) images, measured five times. The results are displayed in figure 2 and show that Tg increases with plasma power. The four values (176 ℃, 213 ℃, 257 ℃ and 381 ℃) marked by blue dashed circles correspond to the plasma hydrogenation temperature when the plasma power was 40, 80, 120 and 160 W, respectively.
Figure
2.
The gas temperature (Tg) increases with the plasma power.
H2 thermal treatment of samples was conducted in the same quartz chamber. The four temperatures (176 ℃, 213 ℃, 257 ℃ and 381 ℃) corresponding to the four different powers of plasma hydrogenation and a higher value (470 ℃) were selected as the H2 thermal annealing temperatures. The annealing time was 30 min. The atmosphere was He/H2 (same as in the He/H2 plasma treatment) and pure H2. The flow rates were also controlled by MFCs and set as He: H2 = 600:15 ml min−1 and H2 = 15 ml min−1, respectively. The treated samples were named T176, T213, T257, T381, T470, H176, H213, H257, H381 and H470, and the treatment modes are shown in table 2.
Table
2.
The various treatment modes and conditions and the corresponding sample names.
Treatment mode
Treatment conditions
Sample name
Untreated
Ar: O2: carrier gas (TiCl4) = 600:15:25 ml min−1, 300 ℃, 18.00 kV, 1.00 mA, 30 min
OES of the RF plasma was investigated using an Avantes AvaSpec-ULS4096CL-EVO spectrometer. The gas temperatures at different discharge powers were simulated with MTO software (a spectral simulation program written in python 3.7) using the OH radical peak (309 nm) in the plasma OES images [44, 45]. The morphologies of samples were examined using a field emission scanning electron microscope (FE-SEM, Hitachi S-4800, Japan) operated at 5.0 kV and transmission electron microscopy (TEM, JEM-2100, Japan). For the TEM measurements, a few samples of TiO2 were scraped from the film surface with a clean stainless-steel knife and ultrasonically dispersed in alcohol. The crystalline phase analysis of samples was completed using x-ray diffraction (XRD, D/max-2550 PC, Japan) in a grazing incidence mode with Cu-Kα radiation (λ = 0.154 056 nm). The accelerating voltage and the applied current were 40 kV and 100 mA, respectively. XRD spectra were recorded from a 2θ angle of 10–80 degrees with a step size of 0.020 degrees at a rate of 5 degrees min–1. The surface structural fingerprints were obtained using Raman spectroscopy (Renishaw inVia-Reflex, United Kingdom). The chemical states of the samples were investigated using x-ray photoelectron spectroscopy (XPS, ThermoFisher Scientific ESCALAB 250Xi, United States of America) equipped with Al-Kα x-ray radiation (1486.6 eV). For XPS analysis, Avantage software was employed to deconvolve and analyze the detailed binding energy and ratios of species. The binding energy was calibrated using the C 1s photoelectron peak at 284.8 eV as the reference. The optical properties (absorbance and reflectance) of samples were acquired using a UV–vis spectrophotometer (Shimadzu UV-2600, Japan) equipped with an integrating sphere accessory and using BaSO4 as a reference (for reflectance). The data were recorded in the range of 200–800 nm.
3.
Results and discussion
3.1
Comparison of blackening effects on TiO2 films after modification treatment
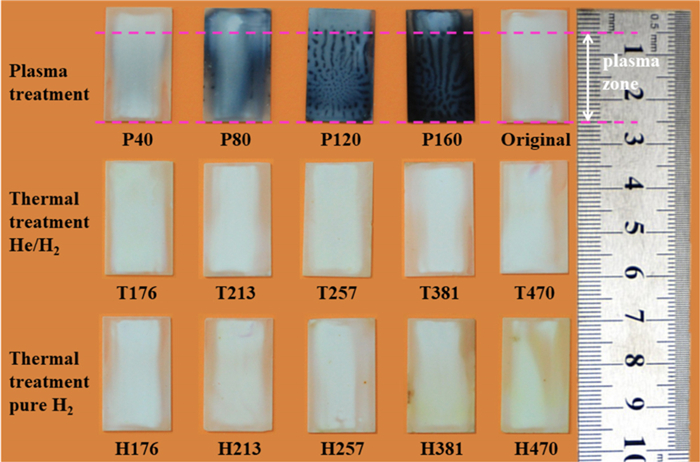
Figure 3 shows photographs of samples treated by various modes. In the first row, the colors of plasma treated samples (P40, P80, P120 and P160) exhibit a blackening trend with plasma power. For sample P160, the surface in the plasma zone presents as almost totally black with some accompanying dark spots sometimes. Generally, such a black TiO2 sample has highly concentrated defects on the surface [46], which will be further discussed in the XPS, XRD and Raman analyses. While thermal annealing samples (in the second and third row) do not present a black color even under a pure H2 atmosphere with higher temperature (470 ℃) and longer time (30 min), it is clearly shown that plasma can effectively blacken TiO2 film under lower temperature, which suggests that some factors in the plasma can promote the TiO2 hydrogenation process.
Figure
3.
Photographs of samples before and after treatment with various modes. The length of the plasma is 20 mm and is marked by the pink dotted lines.
It was found that the black spots present on the surface of P80, P120 and P160 strongly depended on the hydrogenation processes and plasma parameters. The heterogeneity of the plasma hydrogenation process is beyond the scope of this work and will be further studied later.
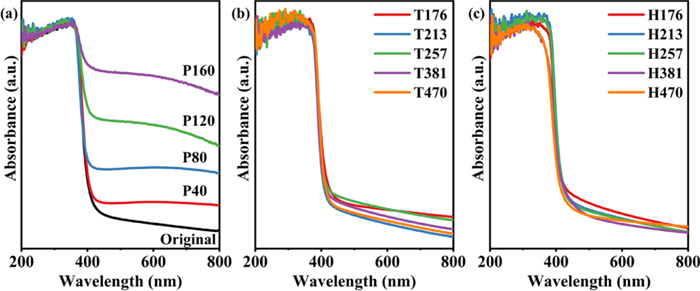
Figure 4 shows the optical absorbance of samples. In figure 4(a), it can be seen that plasma treated films present improved visible light response, and the absorbance intensity in the visible region increases with plasma power. This suggests that the electron energy level structure of black TiO2 has been reconstructed and the optical band gap has been tailored [18, 20]. For thermally treated samples (figures 4(b) and (c)), the absorbance spectra exhibit an almost identical trend to the original ones. The optical absorbance results are consistent with those of their photographs (figure 3).
Figure
4.
The absorbance in the UV–vis region (200‒800 nm) of samples treated by (a) plasma and ((b), (c)) thermal annealing.
The color change of samples was measured based on the CIE L*a*b* color space system, which was introduced in 1976 and is recommended by the International Commission on Illumination [47]. This system expresses color as a combination of three values, L*, a* and b*. The overall change of the colorimetric value ΔE is calculated using the following equation:
ΔE=[(L∗m−L∗o)2+(a∗m−a∗o)2+(b∗m−b∗o)2]1/2.
(1)
Here, L* is the lightness ranging from 0 (black) to 100 (white), and a* and b* represent the red–green and yellow–blue chromaticity indices which take both negative and positive values. The subscript o denotes the original sample, and the subscript m signifies the modified sample. The L*, a* and b* values of various samples were calculated by transforming the optical reflectance spectra.
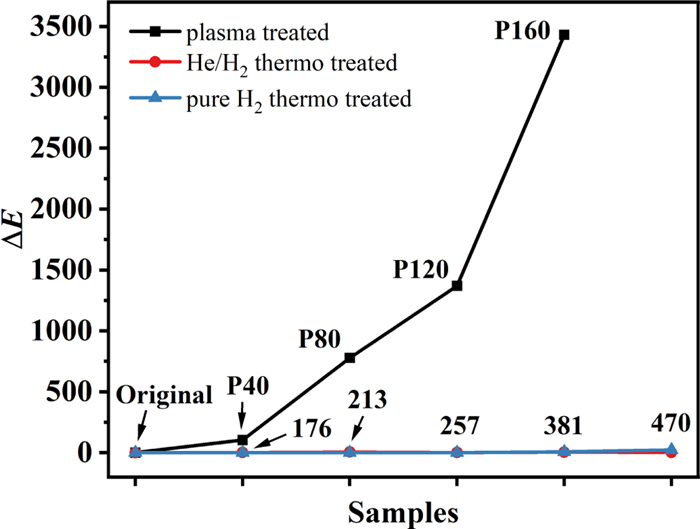
TiO2 film color changes (ΔE) are presented in figure 5. The average overall color changes ΔE for plasma treated films are 103.79 (P40), 778.11 (P80), 1369.16 (P120) and 3430.19 (P160). The ΔE values for thermally annealed films are lower than 22.26 (H470). He/H2 plasma treatment results in dramatic ΔE change, while thermal annealing shows low ΔE change.
Figure
5.
The color change (ΔE) of TiO2 films treated by various modes.
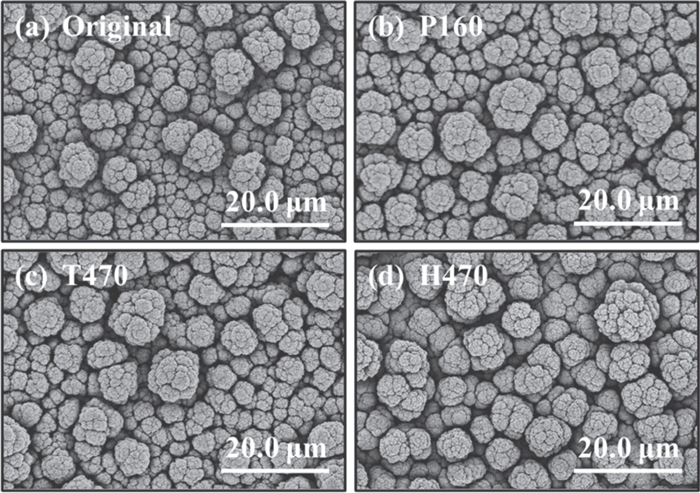
The surface morphologies of samples have no significant changes after being modified by various modes, and FE-SEM images of the Original, P160, T470 and H470 samples are presented in figure 6. All TiO2 film surfaces consist of many clusters and present a cauliflower-like structure. These clusters are composed of many smaller nanospheres. The FE-SEM results suggest that the surface morphologies of the TiO2 films were not significantly changed through plasma or thermal hydrogenation.
Figure
6.
FE-SEM images of samples before and after being treated by various modes. (a) Original, (b) P160, (c) T470 and (d) H470.
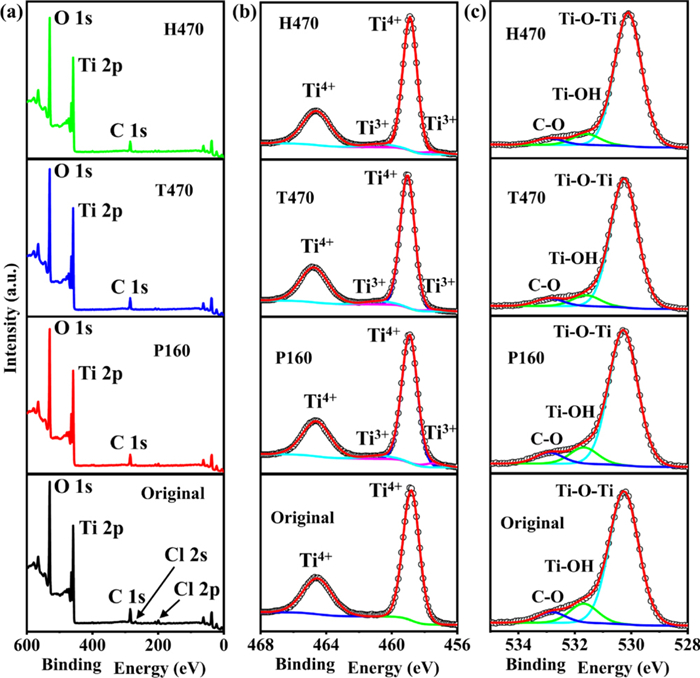
XPS was performed to detect the chemical composition and binding environment of the TiO2 surface and the results are shown in figure 7. Curve fitting analyses of Ti 2p and O 1s were done based on Gaussian equations. The XPS survey scan spectra (figure 7(a)) collected from Original, P160, T470 and H470 are very similar. In addition to the Ti and O signals that are expected for TiO2, C peaks were detected on the samples' surfaces. The C element content is low compared with the O and Ti elements and is believed to be included during sample preparation, storage and subsequent testing. Meanwhile, for Original, a very weak peak at 199.26 eV can be attributed to a Cl 2p peak, while for modified samples, this peak disappears. This is owing to the small amount of residual TiCl4 or HCl on the Original surface during the deposition process, and these residues have been removed completely after modification processing. The results prove that the H2 treatment is a clean process and, more importantly, the hydrogenated TiO2 is not doped with other elements.
Figure
7.
(a) XPS survey scan spectra, and high-resolution XPS spectra of (b) Ti 2p and (c) O 1s. Open circles and lines represent the experimental and the fitted data, respectively.
The core level XPS spectra of Ti 2p are displayed in figure 7(b). For Original, two obvious peaks at 458.9 and 464.6 eV can be attributed to Ti4+ 2p3/2 and Ti4+ 2p1/2 with typical characteristic Ti4+ binding energies [48]. Usually, Ti3+ species will be created on the TiO2 surface after He/H2 plasma treatment [39]. For P160, two new peaks appear at positions of 457.4 and 460.8 eV, attributed to Ti3+ 2p3/2 and Ti3+ 2p1/2 [49]. Similarly, the Ti3+ peaks are also present in T470 and H470. The percentages of integrated areas of various Ti 2p species are listed in table 3. The content of Ti4+ species in the modified samples (P160, T470 and H470) is reduced compared with that of Original. The content of Ti3+ species for thermally annealed samples (T470 and H470) is very similar, while the content of Ti3+ species for P160 is about 1.5 times that for thermally annealed samples. The results indicate that the Ti atom has a different chemical bonding environment before and after modification processing, and He/H2 plasma can create more Ti3+ species on the TiO2 surface than thermal annealing.
Table
3.
The percentage of integrated area of the high-resolution Ti 2p and O 1s XPS spectra.
The core level XPS spectra of O 1s were divided into three peaks and are displayed in figure 7(c). The first component at 530.0 eV can be ascribed to the Ti–O–Ti bond, which means the lattice O2− bonded to the Ti4+ ion [50]. The second component centered at 531.5 eV can be assigned to the Ti–OH bond, which is related to hydroxyl groups [19] or OVs [22]. The third component at around 532.8 eV can be attributed to the C–O bonded species on the TiO2 surface [51]. Additionally, the percentage of integrated area of O 1s is also shown in table 3. The C–O bond content is very low, which suggests a small amount of C contamination during storage or testing processing. It is consistent with the results of the XPS survey spectra (figure 7(a)). For Original, the peak at 531.5 eV may be relate to OH species adsorbed on the surface [39]. For P160, the Ti–OH bond content increases to 11.34%, which indicates the possible formation of H2O from the interaction of H+ ions with the TiO2 film and the creation of OVs [49, 52]. However, for T470 and H470, the content of Ti–OH is almost the same, suggesting that the two thermal treatments do not have different effects on the production of OVs or hydroxyl groups on the TiO2 surface. Therefore, He/H2 plasma treatment plays a critical role in the hydrogenation of TiO2 as compared with thermal treatment.
3.4
Crystallographic structure of TiO2 films
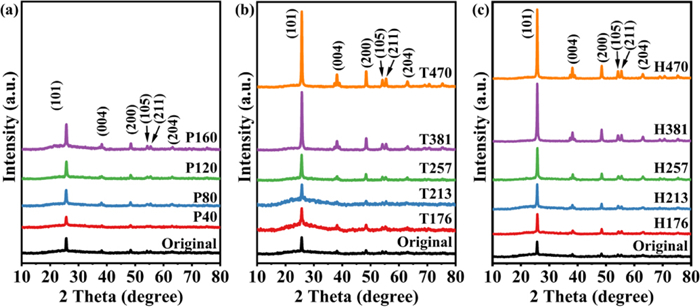
Figure 8 shows the XRD patterns of samples treated by various modes. The peaks identified at 2θ values of 25.4°, 37.8°, 48.1°, 53.8°, 55.0° and 62.7° correspond, respectively, to the crystal planes of (101), (004), (200), (105), (211) and (204) in the standard XRD pattern of anatase TiO2 (JCPDS No. 21–1272). All samples show similar XRD patterns, indicating that no phase transformation occurred during the plasma or thermal processing. Comparing with Original, the (101) peak intensity of P40 decreases, which can be assumed to indicate that defects (such as OVs and surface hydroxyl groups) were introduced into the TiO2 crystal by the bombardment of high-energy active species [24]. With increasing plasma power, the (101) peak intensity of samples P40, P80, P120 and P160 increases, indicating the improvement of samples' crystallinity. This can be attributed to the increase of substrate temperature. For thermally treated samples, the (101) peak intensities increase with the annealing temperature, also indicating the crystallinity improvement of the samples.
Figure
8.
XRD patterns of samples treated by (a) He/H2 RF plasma, (b) He/H2 and (c) pure H2 thermal annealing.
The XRD spectrum intensity of plasma treated samples is weaker than that of thermally treated samples at the same temperature, which indicates that some factors attenuate the effects of high substrate temperature, such as high-energy species collision. Generally, the crystallization of TiO2 will be improved by pure Ar or He plasma [53], while defects can be introduced into TiO2 when treated by H2 or N2 plasma [20, 54]. Therefore, the XRD spectrum intensity of plasma treated samples is weaker than that of thermally treated samples, and this can be attributed to the defects introduced by He/H2 plasma bombardment of the TiO2 surface.
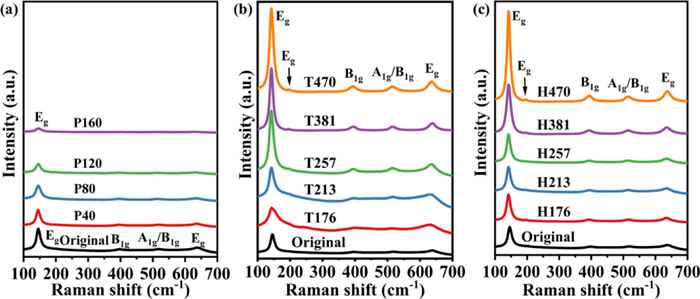
As the penetration depth of Cu-Kα x-rays is ~15 μm [39], XRD is known as a bulk sensitive method. Raman spectroscopy, as a very sensitive technique, contains more signals from the surface region than from the bulk region of the TiO2 samples. Hence, to understand more deeply the effect of He/H2 plasma treatment and thermal annealing on the phase transformation of TiO2, Raman spectroscopy was also employed in the present study to assess the surface crystalline structure of the samples. The major Raman bands of the anatase phase appear at 144, 197, 399, 515, 519 (superimposed with the 515 cm−1 band) and 639 cm−1, which can be ascribed to the six Raman-active modes of the anatase phase with the symmetries of Eg, Eg, B1g, A1g, B1g and Eg, respectively [39].
Figure 9 presents the Raman shift spectra of samples modified by various modes. All samples display anatase TiO2 major Raman vibrational modes, consistent with the XRD results. In figure 9(a), the peak intensities, especially for the main peak (144 cm−1), clearly decline with increasing plasma power, which exhibits a different result from the XRD. The reduction in Raman peak intensity indicates the increased disorder of the TiO2 surface due to the bombardment of the He/H2 plasma. It also suggests that, for the plasma treated samples, defects (disordered layers) are mainly concentrated on the TiO2 film surface rather than inside the bulk. For the thermally treated samples, however, the intensity of the peak increases with the annealing temperature, indicating that the crystallization of TiO2 film was promoted by increasing the annealing temperature [55]. The results for the thermally treated samples are in good agreement with the above XRD results, indicating that thermal annealing did not introduce the defects into the surface or bulk of the TiO2 thin films. This is different from the results of Wang and Chou [34], and the reason may be that the temperature is not high enough. The above Raman results indicate that the hydrogenation occurs mainly on the surface of the films during He/H2 plasma treatment processing.
Figure
9.
Raman shift spectra of samples treated by (a) He/H2 RF plasma, (b) He/H2 and (c) pure H2 thermal treatment.
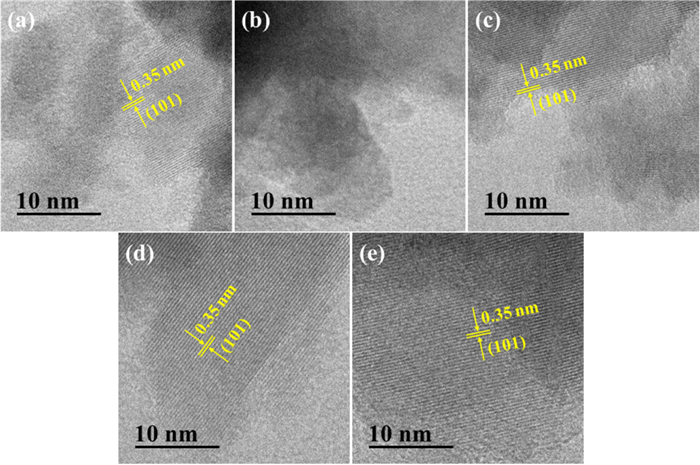
Figure 10 shows the TEM results for Original, P160, T470 and H470, where the (101) lattice planes of anatase TiO2 were confirmed on the basis of a lattice fringe of d = 0.35 nm. Compared with Original (figure 10(a)), the surface layer of P160 (figure 10(b)) seems to contain some degree of imperfection, while the inner layer (figure 10(c)) exhibits improved crystallinity. T470 (figure 10(d)) and H470 (figure 10(e)) show well-defined crystal structure with minimal lattice imperfection. The TEM results suggest that the bombardment of high-energy active species disrupted the crystal structure on the TiO2 surface [56], while the high temperature increased the overall crystallinity of TiO2. This validates the conjecture obtained from the XRD and Raman measurements.
Figure
10.
TEM images of samples. (a) Original, (b) surface and (c) inner of P160, and (d) T470 and (e) H470.
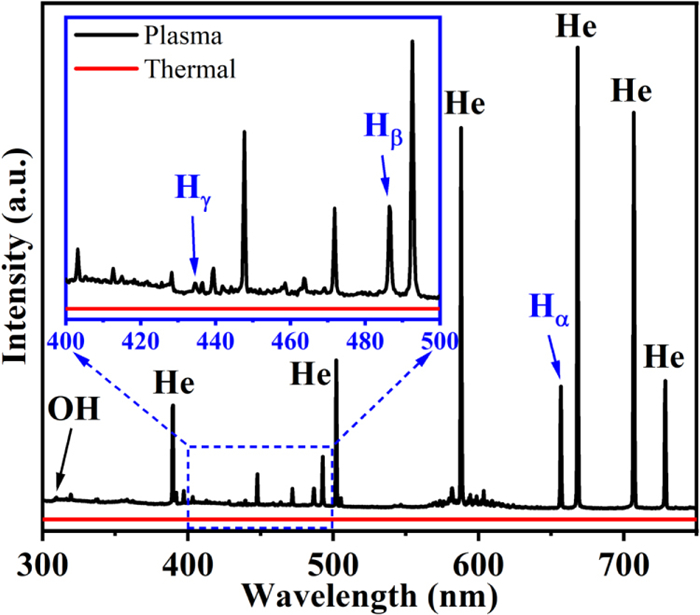
Figure 11 presents OES of the plasma (160 W) and thermal (470 ℃) processes. For RF He/H2 plasma (black line), the main emission peaks at 728.46, 706.78, 668.11, 578.91, 502.01 and 389.62 nm are detected and identified as He species [48]. The peaks at 656.62, 486.49 and 434.49 nm correspond to Hα, Hβ and Hγ, respectively [57], which belong to the Balmer series. A weak peak at 309.23 nm is also detected and is attributed to the OH radical peak [58], which has been used to estimate the gas temperature of the RF He/H2 plasma mentioned above. The presence of the OH peak is a common phenomenon observed typically in AP plasma. The OH peak originates from H2O that was desorbed from the gas pipe wall or traces in the He or H2 used. Obviously, the appearance of these emission lines demonstrates that RF plasma has a stronger ability to split the reduced agent (H2) and generate H2 active species. The process of H2 agent splitting caused by high-energy electron collisions in the bulk plasma region can be summarized according to the chemical reactions in equations (2) and (3).
Figure
11.
OES of He/H2 plasma at 160 W and thermal annealing at 470 ℃.
However, for thermal processing (red line at the bottom), no peak was detected in the spectra, suggesting almost no active species. OES results suggest that the reduced agent (H2) and He were successfully split, and numerous active species were generated in the RF He/H2 plasma due to the bombardment of high-energy electrons rather than high temperature. The high-energy species are beneficial to the surface activated process during hydrogenation processing [21].
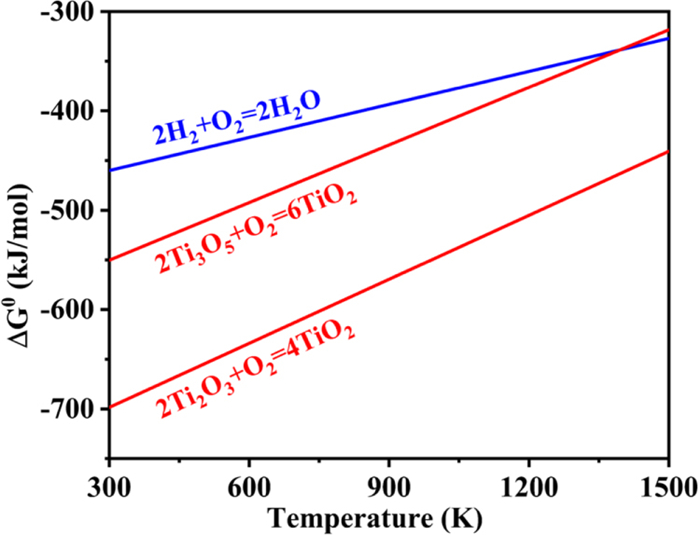
Figure 12 shows the Gibbs free energy changes of ΔG0(T) related to oxidation reactions of TiO2 involving one mole of gaseous O2. Such a figure is called an Ellingham diagram [59]. The thermodynamic data used in figure 12 are cited from the compilation by Kubaschewski [60]. The relationship for oxidation of H and Ti approximates to a straight line over the temperature ranges in which no phase transformations occurred. Thermodynamically, the straight lines represent the Gibbs free energy changes ΔG0(T) at different temperatures, which indicates the relative stability of oxides. It is possible to directly visualize the affinities of elements for O2 in their standard conditions by observing the relative positions of their lines in the diagram. A given element can reduce the oxides of all other elements whose lines lie above others in the diagram [59]. From figure 12, the lines of Ti3O5 and Ti2O3 unfortunately lie below the H2 line, so elemental H cannot reduce TiO2 at low temperature (< 1400 K). This explains why H2 gas hardly reduced crystalline TiO2 by thermal annealing below 470 ℃ in our experiment. However, for plasma processing, in addition to the thermal effect, He/H2 plasma interacted with the TiO2 surface and greatly promoted the hydrogenation process.
Figure
12.
Ellingham diagram of ΔG0 versus temperature.
The ionization degree of H2 was calculated using the Saha equation:
χ21−χ2P=3.2×10⁻²T5/2exp(−eVikBT).
(4)
Here, χ, P, T, e, Vi and kB are the ionization degree, pressure (in Pa), gas temperature (in K), electronic charge, gas ionization energy (13.59 V for H2), and Boltzmann's constant. The ionization degree of H2 for 470 ℃ thermal annealing is about 1.958 × 10−46. Therefore, no characteristic peak was detected in OES during 470 ℃ thermal annealing due to such a low decomposition rate.
Although there are a lot of articles on TiO2 hydrogenation through H2 thermal annealing [34], the black TiO2 was prepared in H2 atmosphere at 600 ℃ for 6 h. The ionization degree of H2 at 600 ℃ estimated by the Saha equation is about 1.724 × 10−39. It is seven orders of magnitude higher than that at 470 ℃ and 14 orders higher than that at 381 ℃ (9.031 × 10−53). Therefore, according to the ionization degree of H2 and the annealing time of Wang and Chou (6 h) [34], the reaction time of TiO2 blackening in this experiment through thermal annealing is about 5.28 × 10⁷ h (more than 6030 years) at 470 ℃ and is about 1.15 × 10¹⁴ h (more than 13 billion years) at 381 ℃. High enough temperature and long enough treatment time are the key factors for successful thermal annealing in the TiO2 hydrogenation process. From these analyses, the hydrogenation process using plasma in our experiment displays the obvious advantages of moderate temperature (below 381 ℃) and less time (less than 5 min) due to the bombardment of energetic species.
3.7
A possible hydrogenation mechanism
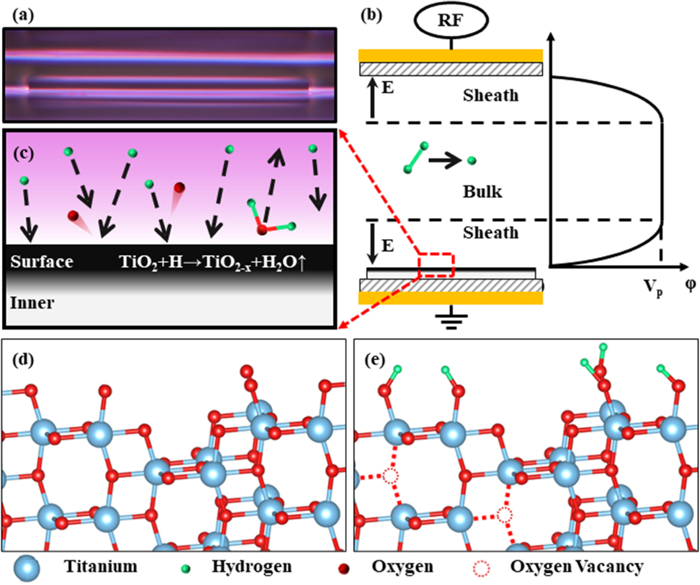
Based on the above experimental results and discussion, a possible hydrogenation mechanism was proposed as follows. Figure 13(a) is a photograph of the RF AP plasma discharge in our experiment. A sheath can be observed on the surface of the TiO2 film and quartz dielectric. The schematic structure of our RF AP plasma discharge is shown in figure 13(b). The potential (φ) decreases gradually, and the direction of the electric field (E) is directed from the bulk plasma to the dielectric inside the sheath region. H active species are abundantly generated in the bulk region due to the collision of high-energy electrons with H2 and diffuse toward the sheath region due to the concentration differences. Figure 13(c) shows how the charged species (H+) are accelerated by the strong electric field in the sheath and bombard the TiO2 surface with sufficient energy. The interactions between the H2 plasma and the TiO2 film surface result in the dissociation of Ti–O bonds and desorption of O atoms [46], which can be summarized according to the chemical reaction in equation (5)
Figure
13.
Schematic diagram of a possible hydrogenation mechanism for RF AP He/H2 plasma treatment. (a) The photograph (front view), (b) schematic diagram of RF AP plasma structure during the TiO2 hydrogenation process, (c) the interaction of the He/H2 plasma with the TiO2 film during the blackening process, and the representative microstructures of (d) pristine and (e) black TiO2 films. Size of the species is not to scale.
The formation of volatile molecules of H2O is possibly responsible for the desorption of O atoms from the film surface after He/H2 plasma treatment [39], creating Ti3+ species. This behavior may be associated with the high energy transferred to the sample during the plasma treatment, which favored the reduction of Ti4+ to Ti3+. Another point to be discussed is that some ions can be implanted into the TiO2 film at depths of several nm, promoting the disordering by the formation of OVs [20, 39]. The representative microstructures of pristine and black TiO2 films are exhibited in figures 13(d) and (e), respectively. After plasma hydrogenation, H species combine with surface O atoms to form hydroxyl groups (Ti–OH bonds) on the surface of the black TiO2 film. Some O atoms are removed, forming OVs in the subsurface.
Therefore, it is the high dissociation rate of H2 and the acceleration of its ion species through the sheath in the plasma that greatly modifies the surface structure and chemical bonding environment of TiO2, creating OVs and Ti3+ and causing disorder in the film surface under relatively mild conditions. The existence of defects leads to the tailoring of the band gap of black TiO2 and causes the light absorption to extend into the visible region.
4.
Conclusion
The effects of He/H2 plasma and thermal treatment on the hydrogenation process of TiO2 film are investigated in this work. The samples treated by RF AP He/H2 plasma have been successfully blackened within a short time (5 min), while the color of the samples treated with He/H2 or pure H2 thermal treatment at higher temperature and with longer time (30 min) did not change obviously. The surface morphologies of the samples remained almost unchanged before and after plasma or thermal hydrogenation processing. XPS results indicate that OVs and Ti3+ species were introduced into the TiO2 surface after He/H2 plasma treatment. XRD and Raman results suggest that plasma hydrogenation improved the overall crystallinity of TiO2 film, and at the same time, this process also created some defects in its surface crystalline structure. TEM results indicate that the surface layer of plasma treated TiO2 film was amorphous, while the crystallinity of the inner layer was slightly improved compared with the original sample. TEM results validate the conjecture obtained from XRD and Raman spectroscopy (crystalline-disordered core–shell structure).
OES results suggest that numerous active H or He species were generated in RF He/H2 plasma, while there were no peaks detected in the thermal processing. A photograph of the RF He/H2 plasma was taken and a possible mechanism for the TiO2 hydrogenation process by plasma has been proposed. Numerous active species were generated in the bulk plasma region, accelerated in the sheath region, and bumped toward the TiO2 film, which will react with the TiO2 surface to form OVs and disordered layers. This leads to the tailoring of the band gap of black TiO2 and causes its light absorption to extend into the visible region, resulting in enhanced visible light absorption.
It is the high dissociation rate and the acceleration of the sheath that led to the better effects of plasma treatment than of heat treatment in the hydrogenation of TiO2 films under a lower gas temperature and short time. It is worth noting that the hydrogenation on the surface of the TiO2 film was uneven, which we will research in the future. Finally, RF AP He/H2 plasma treatment, as a simple hydrogenation method, opens new opportunities for the design of advanced photocatalysts with enhanced solar energy utilization.
Acknowledgments
This research was financially supported by National Natural Science Foundation of China (Nos. 12075054, 12205040, 12175036 and 11875104).
Table
1.
Summary of the literature on the preparation of black TiO2 by hydrogenation. Abbreviations: atmospheric pressure (AP), oxygen vacancy (OV) and inductively coupled plasma (ICP).

 DownLoad: