Figure
1.
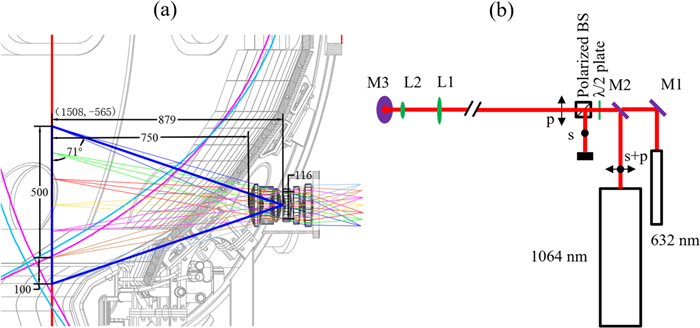
(a) Field of view in ETS system on HL-2M. (b) Top view of the incident optics.
| Citation: |
Shaobo GONG, Zhongbing SHI, Yixuan ZHOU, Tongchuan ZHANG, Jinming GAO, Dianlin ZHENG, Ping SUN, Liming YU, Wei CHEN, Wulyu ZHONG, Min XU, Xuru DUAN. Optical design of vertical edge Thomson scattering on HL-2M tokamak[J]. Plasma Science and Technology, 2023, 25(7): 075601. DOI: 10.1088/2058-6272/acbd8d

|
A vertical edge Thomson scattering (ETS) diagnostic system on HL-2M tokamak has been designed. The ETS system collects the scattered light from Nd: YAG laser (1064 nm, 2 J, 30 Hz, 15 ns). The laser beam propagates vertically through the plasma region and the polarization is parallel to the toroidal magnetic field. A special designed Galileo-type telescope with long Rayleigh length is applied to focus the laser size and ensure collimation. A group of double-Gaussian collection lenses image the 600 mm vertical scattered region onto rectangular fiber arrays with a spatial resolution of 10 mm. The 2.20 mm × 2.86 mm fiber optic bundle consists of 130 low hydroxyl (OH) 200/220 μm (core/cladding) diameter fibers with numerical aperture NA = 0.22, carrying the light to remotely located multi-channel polychromators. Effect of oblique incidence on narrow band filter has been analyzed. The designed electron temperatures range from 5 to 1000 eV and electron densities from 5 × 10¹⁸ to 1 × 10²⁰ m-3.
The construction of HL-2M tokamak has been completed in December, 2020. The plasma current of HL-2M is up to 2.5 MA and the toroidal magnetic field is 2.2 T. The major and minor radii of HL-2M are 1.78 m and 0.65 m, respectively [1, 2]. HL-2M can produce conventional single and double null configurations with a vertical elongation ratio of 2 and a triangularity larger than 0.5, and has ability to establish other equilibrium configurations, such as anti-triangle transformation, snowflake divertor, etc. In the later stage, an efficient heating and current drive system will be gradually developed to improve the coupling efficiency, making the ion temperature exceed 100 million degrees, which enables HL-2M to study high performance plasmas relevant to ITER. Physical research and experimental verification related to helium transport and ash control will also be carried out under a variety of advanced divertor configurations.
The plasma boundary region connects the core and the divertor plasma. Especially, the edge transport barrier helps achieve high confinement mode (H-mode). However, the steep pedestal gradients drive the edge localized modes, which can be large enough to cause damage to the divertor target and plasma facing components [3, 4]. An accurate understanding of the physical behavior of boundary plasma is helpful to improve the understanding of the operation of tokamak plasma and the global energy confinement time scaling law. It is important to study the plasma information in pedestal region, in order to understand the core confinement and the steady-state operation of the tokamak, and to understand the energy deposition on the divertor. Thomson scattering is a powerful tool to measure plasma electron temperature and density profiles on tokamaks, ranging from 1 to ~104 eV and 1017 to 1020 m-3, respectively [5–10].
In this article, we present the optical design of edge Thomson scattering (ETS) on HL-2M. The designed vertical spatial resolution is 10 mm so that the projected resolution inside the flux surface (marked by blue and magenta lines) will be ~5 mm at the midplane when the plasma elongation is considered. Therefore, ETS on HL-2M is able to provide essential information of the edge pedestal (usually 5% of plasma minor radius). There are nearly 6 spatial points in pedestal region, which can help reconstruct the plasma equilibrium with high accuracy.
The ETS system on HL-2M is designed to use Nd: YAG laser (1064 nm) as the probe beam. The repetition rate and output energy of the Nd: YAG laser are 30 Hz and 2 J, respectively. The pulse width of a single laser shot is ~15 ns. As shown in figure 1, the laser beam passes through the vacuum vessel vertically and the viewing window is in the horizontal direction. The collection lens is perpendicular to the laser in the poloidal plane. In order to maximize the cross section of scattered light, the polarization of incident laser should be perpendicular to the poloidal plane. Consequently, the beam has to be polarized horizontally before it is reflected by the 45° mirror underneath the tokamak, as shown by the p- polarized arrow in figure 1(b).
Considering the structure of the open divertor and the location of the observing port, the field of view (FOV) is designed to be 600 mm. A group of double Gaussian lenses are specially designed to enable such a wide view, while the lens diameter is limited less than 164 mm. The object distance is set to be 750 mm, where the lenses are hiding behind the first wall of HL-2M, protecting the lenses from the damaging of plasma heat flux. The wide FOV provides not only the information of edge plasma but also the profiles of divertor plasma, which is essential for the research of pedestal and divertor physics.
The Nd: YAG laser propagates 6.52 m in the air before reaching the first lens L1, as shown in figure 1(b). For the convenience of optical adjusting, the laser power is attenuated by the combination of a half-wave plate and a polarized beam splitter. The half-wave plate rotates the polarization direction of laser while the beam splitter separates the s- and p- polarized light. Only p- polarized light can pass through the beam splitter and the s- polarized light will be absorbed by a beam dump.
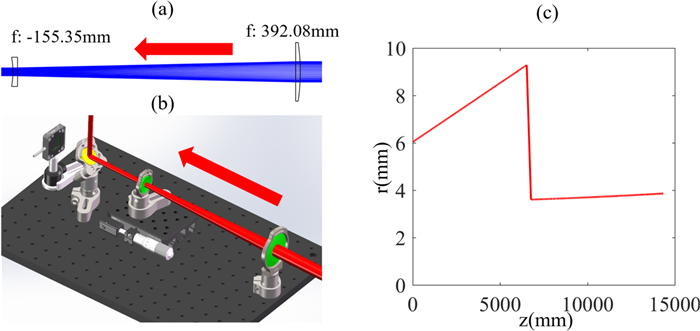
Before entering into the vacuum, a pair of lenses forming a Galileo-type telescope is designed to focus the diameter of laser beam to 7 mm, which is shown in figure 2(a). Galileo-type telescope consists of a convex lens and a concave lens so that there is no focusing point between the two lenses, avoiding the danger of air ionization. Fused silica with anti-reflective coating is chosen as the base material, where the damage threshold is up to 20 J cm-2 at 1064 nm. The telescope is carefully optimized to ensure the collimation of the output laser, where the Rayleigh length is 35.40 m. The focal lengths of the telescope are 392.08 mm and -155.35 mm, respectively. Compared with single focusing lens used in Thomson scattering systems of other tokamak devices, optimized Galileo-type telescope prevents the laser beam from diverging or converging when passing through the whole plasma. It must be noted that even though the energy density is theoretically safe, in practice the reliability of Galileo-type telescope should be evaluated systematically before application. Any change/fluctuation in the laser beam profile or divergence can increase the energy density locally. Any dust can decrease the damage threshold of the mirror. Therefore, the laser distribution (generally nonideal Gaussian beam) and its propagation should be fully understood. The full laser path should be closed to prevent dust pollution. The damage tests of the mirror and the entrance window need to be done to find out the energy threshold.
In figure 2(b), both the telescope and the 45° reflecting mirror are fixed on an optical table beneath the vacuum port. Localization of the laser beam is monitored by a photoelectric detector behind the reflecting mirror, taking use of the transmitted energy (< 1%) of the laser beam. After passing through the plasma, the outgoing laser will be collected by a beam dump which is located on the top of HL-2M tokamak. Figure 2(c) illustrates the calculated beam radius varying with space locations. The total propagating length is 14.35 m and the focused laser radius changes from 3.61 to 3.86 mm.
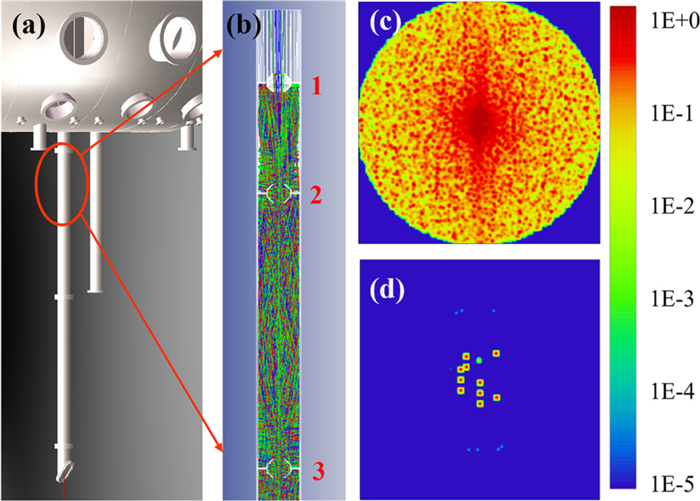
Due to the weak signal in Thomson scattering theory, stray light reduction is one of the most important issues in diagnostic development. There are a wide range of stray light sources in tokamak, including scattered light from the window surface, multiple reflection by the vacuum chamber, diffraction of the Gaussian beam tail and so on. It has been proved that the use of baffles in the vacuum pipe is an effective way to suppress stray light. JT-60SA found that the use of baffles spaced at a geometric series (40% of unit length) is an effective way to reduce the stray light [11]. Results on EAST suggested that the 45° cone angel has the best effect for baffles to suppress stray light [12]. Based on these studies, a group of three 45° cone double edged baffles have been designed in HL-2M, as shown in figures 3(a) and (b). The total length of the vacuum pipe is 2200 mm and the locations of the baffles are 880 mm, 352 mm and 141 mm, respectively. Considering that the diameter of the laser beam is 7 mm, the aperture size is set as 20 mm. Using the non-sequential ray tracing module of ZEMAX, a simulation analysis has been done to evaluate the impact of baffles on stray light reduction. Reflectivity of baffles and long-pipe wall is assumed as 50%. The width and angle of stray light resource are assumed as 7 mm and 30°, respectively. Figures 3(c) and (d) show the total stray light power at the end of the pipe without/with baffles. Compared with the case of no baffles, the result of ray tracing illustrates that the amount of stray light can be reduced to ~0.5% using three baffles.
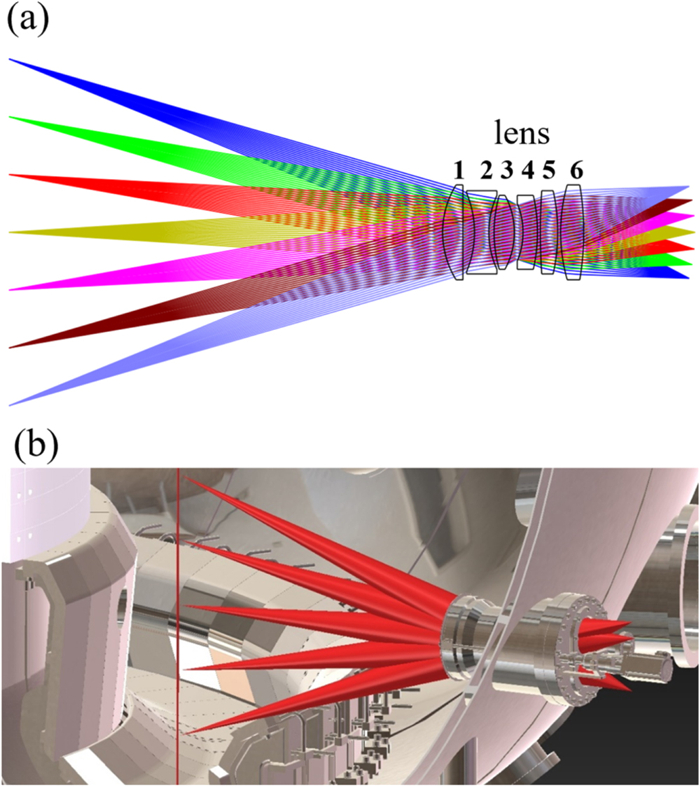
The designed parameters of collection optics are listed in table 1, including curvature, thickness, diameter and glass. The working spectral range of the optics (900‒1100 nm), for the expected electron temperatures (5‒1000 eV), is not very wide and spectral aberrations are negligible, as illustrated in figure 5(a). Therefore, all the six lenses are made of BK7, which is a commonly used visual and near-infrared material. The size of the vacuum port is 200 mm and the lens diameter is limited to 164 mm. Schematic of the double Gaussian collection lenses for ETS is shown in figure 4(a). In figure 4(b), the collection optics is sealed inside the vacuum vessel in order to reduce the object distance and thus increase the solid angle. The intensity of collected scattered light is proportional to the solid angle. It is noted that a coated planar window and a safety shutter are designed in front of Lens 1 to protect the whole optics. Detailed characteristics of the collection optics include: (1) object half cone angle: 3.8°. The object half cone angle θ/2 defines the collection solid angle by Ω = 2π(1-cos(θ/2)); (2) object distance: 750 mm, defined as the distance between object plane and the surface of lens 1; (3) solid angle: 0.0138 sr; (4) image space numerical aperture: 0.22; (5) field of view: 600 mm; (6) paraxial magnification: -0.29; (7) effective focal length: 205 mm.
| Surface | Curvature (mm) | Thickness (mm) | Diameter (mm) | Glass |
| Lens 1 | 156.9 | 35 | 164 | BK7 |
| inf | ||||
| Lens 2 | -177.1 | 25 | 144 | BK7 |
| 154.8 | ||||
| Lens 3 | 235.7 | 35 | 128 | BK7 |
| -134.4 | ||||
| Lens 4 | -129.4 | 25 | 128 | BK7 |
| -289.4 | ||||
| Lens 5 | 1115.7 | 30 | 144 | BK7 |
| -332.3 | ||||
| Lens 6 | 300.4 | 40 | 164 | BK7 |
| -493.1 |
 DownLoad:
CSV
DownLoad:
CSV
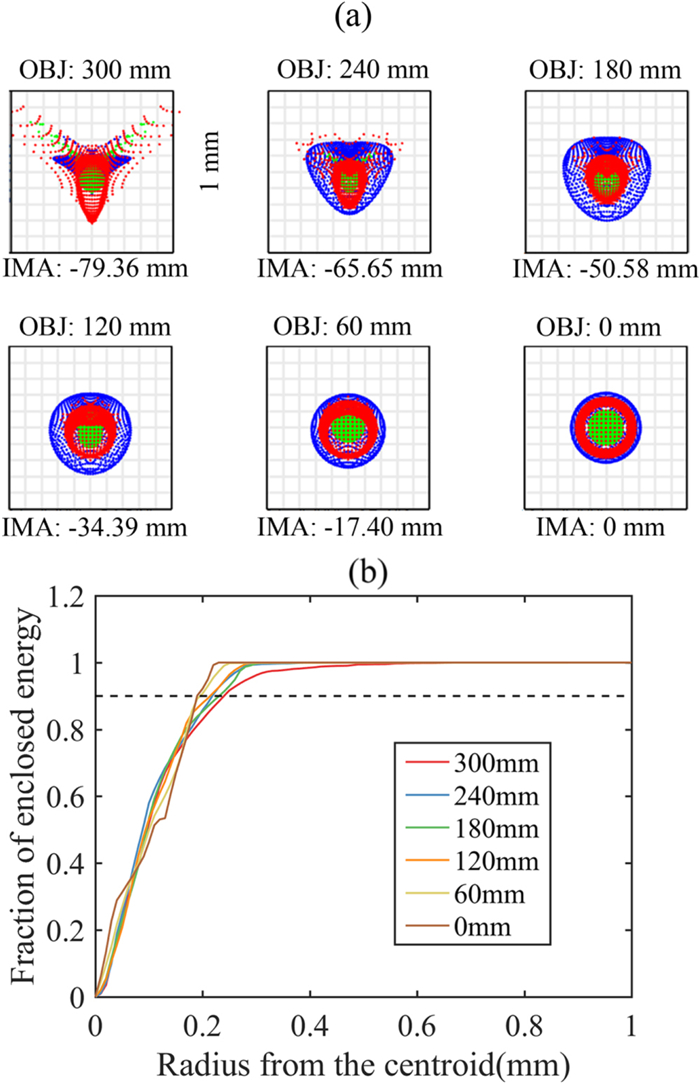
Figure 5(a) shows the spot diagrams at image plane of different wavelengths, including 900 nm, 1000 nm and 1100 nm, distinguished by different colors. The plot scale in figure 5(a) is set to be 1000 μm. Compared with central part, spherical aberration is evident at the marginal region of the object plane. On the other hand, chromatic aberration in the range of 900‒1100 nm can be ignored from the spot diagrams. The associated geometric enclosed energy is presented in figure 5(b). The radii of the circle for which 90% of the energy is included are about 0.2 mm, indicating a high imaging quality when compared with the fiber bundle. The 2.20 mm × 2.86 mm fiber optic bundle consists of 130 (10 × 13) low-OH 200/220 μm (core/cladding) diameter fibers with numerical aperture NA = 0.22, carrying the light to remotely located multi-channel polychromators. The total length of the fiber bundle is 35 m.
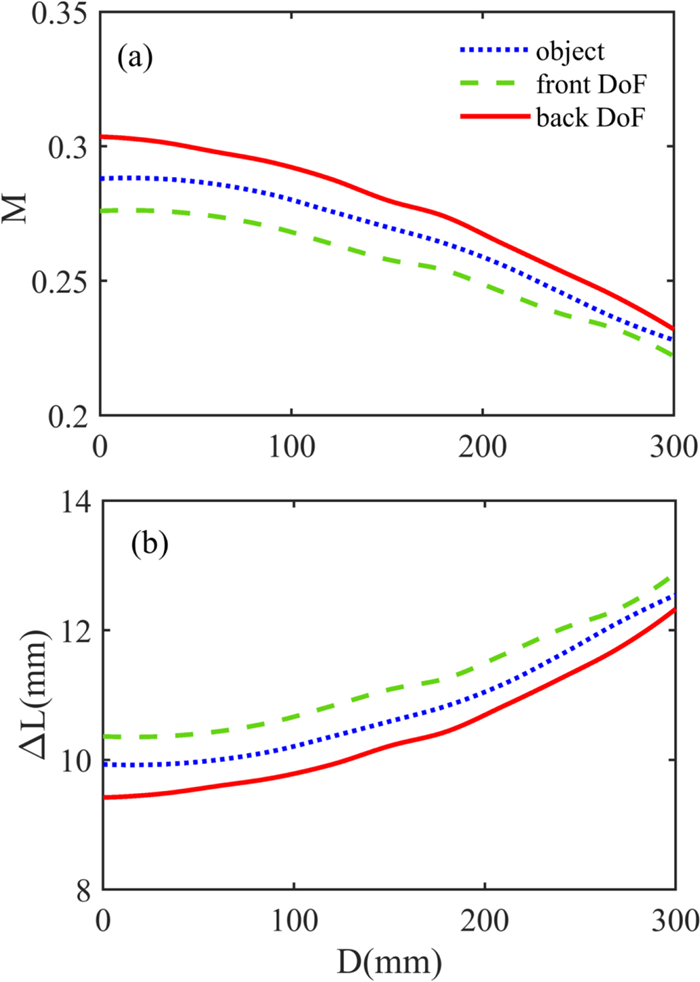
For an exact optical system, there is a permissible dispersion circle before and after the focus, and the distance between the two dispersion circles is called depth of focus. That is, before and after the subject, the image still has a clear range, which is defined as depth of field (DOF). In other words, the front and back depths of the subject are all within the limited range of the permissible dispersion circle. DOF of the collection optics can be estimated by DOF = △L2 + △L1, where
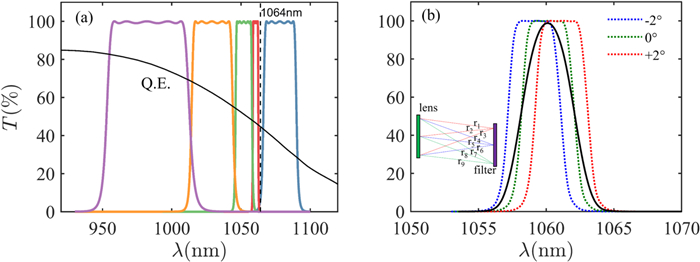
The designed polychromators consist of five interference filters so as to divide the scattered light into five parts, as is shown in figure 7(a). The central wavelengths and associated FWHM of the filters are 1078 nm/24 nm, 1060.5 nm/4 nm, 1052 nm/12 nm, 1029 nm/30 nm, and 982 nm/60 nm, respectively. The interference filters have good performances of in-band transmission (> 90%) and out-band reflection. The designed reflection characteristics are 600–1100 nm @ OD 5 and 400–600 nm @ OD 4, where OD = log10
Since the cascaded structure is used in the multi-channel polychromators, the collimated incident condition for filtering is unable to be satisfied. Oblique incidence together with cone angle will be a serious challenge for the narrow band filter (1060.5 nm/4 nm), whose transmission curve is especially sensitive to the angle. In this design, the incident angle of the chief ray is 3.7° and the half cone angle is 2°, as shown in the sub graph of figure 7(b). The film structure of each filter has been optimized for the oblique chief ray (3.7°), however, the wavelength drift resulted from the cone angle cannot be ignored. In order to simply the analysis, the distribution of light intensity on the fiber bundle plane is assumed to be uniform. Therefore, transmittance of the filter can be estimated by calculating the arithmetic mean of each ray. Figure 7(b) shows the effect of incident angle, where the green dash line is 3.7° (marked as 0°). It is found that a 2° angle variation leads to a 0.9 nm wavelength shift, while the curve shapes are nearly unchanged. The black line represents the average of each ray, which is much different from the designed green line. The expanded cut-off range of wavelength could bring in several problems, such as enhanced stray light from 1064 nm. Careful calibration must be done to acquire the real transmittance, especially for the narrow band filter. When filters are assembled in the polychromator, the possible leaked stray light from the chassis should be measured at first. Then a high-power laser diode of 1064 nm is recommended to test the cut-off depth of the filter. The measured cut-off depth will probably be worse than the designed. Finally, the transmission curve should be calibrated by a scanning monochromator.
The scattered photoelectrons ns of each channel in the polychromator can be estimated by integrating the scattered spectrum S(λ) in each wavelength band [13]:
| ns(Te)=Tr△Ωr2ene△l∫λ2λ1λE0hcS(λ)Q.E.(λ)dλ | (1) |
| S(λ)=c2√2πkTe/mesinθ2λ0×(1-72△λλ0+mec2△λ38kTeλ30sin2θ2)×exp(-mec2△λ8kTeλ20sin2θ2), | (2) |
where Tr denotes the total estimated transmittance including window, collection lens, fiber and filters, △Ω the scattered solid angle, re the classical electron radius, ne the electron density, △l the spatial resolution, E0 the pulsed energy of incident laser, Q.E. the quantum efficiency, λ0 the wavelength of incident laser. The necessary parameters in table 2.
| Parameters | Values |
| Tr | 0.24 |
| △Ω | 0.0138 sr |
| re | 2.82 × 10⁻¹⁵ m |
| ne | 5 × 10¹⁸ m-3 |
| △l | 0.01 m |
| E0 | 2 J |
| h | 6.63 × 10⁻³⁴ J·s |
| c | 3 × 10⁸ m s-1 |
| θ | 90° |
| λ0 | 1064 nm |
| k | 1.38 × 10⁻²³ J K-1 |
| me | 9.1 × 10⁻³¹ kg |
| △λ | λ-λ0 |
DownLoad:
CSV
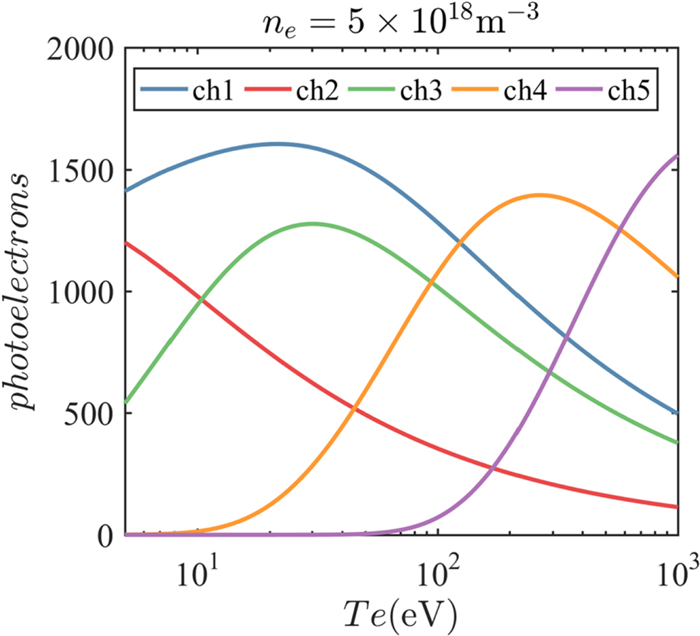
Figure 8 shows the distribution of the scattered photoelectrons of different channels in the polychromator at ne = 5 × 10¹⁸ m-3. The order of magnitude of scattered photons is ~103. The estimated output photocurrent Is is ~1 μA (Is = ens/△t, where △t = 15 ns is the pulse width of incident laser). For the plasma discharge of low electron density, a wideband amplifier with R = 200 kΩ in the feedback loop would be suitable to get a voltage output of ~200 mV. The total circuit noise is expected to be 5 mV and the equivalent photoelectron noise will be 25, which means that the designed polychromator is able to measure plasma density as low as ~1017 m-3. On the other hand, if the feedback resistance remains the same, the circuit output could be easily saturated when HL-2M is operated at relatively high density such as ne ~ 1 × 10²⁰ m-3. The circuit design should provide variability of gain to adapt on different plasma regimes.
The temperature and density measurement are basically a finding of the best match between measured and expected signals in all channels. Te and ne are obtained by finding the minimum of the following equations [14, 15]:
| χ2=Σ | (3) |
| (4) |
Here n is the number of spectral channels, Ii is the photoelectrons measured in each of the channels, Fi(Te) = ns/ne is the expected signal in each channel for unit density, ne is the plasma electron density,
| (5) |
Here X stands for Te or ne. The expressions of
A vertical ETS diagnostic system on HL-2M tokamak has been designed. The laser beam passes through the vacuum vessel vertically and the scattered light is collected horizontally. The Galileo-type telescope with long Rayleigh length is designed to focus the diameter of laser beam to 7 mm. A group of double Gaussian lenses are specially designed to enable a field of view of 600 mm and a solid angle of 0.0138 sr. The designed vertical spatial resolution is 10 mm. A polychromators consisting of five interference filters is designed to transfer the scattered light to detectors. The order of magnitude of scattered photoelectrons is ~103 at ne = 5 × 10¹⁸ m-3. The designed electron temperatures range from 5 to 1000 eV and electron densities from 5 × 10¹⁸ to 1 × 10²⁰ m-3. The proper amplifying circuits for different plasma regimes are being designed and will be discussed elsewhere.
The authors thank the HL-2M team for their informative comments and advice. This work was supported by the National Key Research and Development Program of China (Nos. 2019YFE0302002, 2017YFE0301203 and 2017YFE0301202) and National Natural Science Foundation of China (No. 12175055).
| [1] |
Li Q HL-2M Team 2015 Fusion Eng. Des. 96–97 338 doi: 10.1016/j.fusengdes.2015.06.106
|
| [2] |
Liu Y et al 2020 China Nucl. Power 13 6(in Chinese)
|
| [3] |
Kinsey J E et al 2011 Nucl. Fusion 51 083001 doi: 10.1088/0029-5515/51/8/083001
|
| [4] |
Leonard A W 2014 Phys. Plasmas 21 090501 doi: 10.1063/1.4894742
|
| [5] |
Scannel R et al 2006 Rev. Sci. Instrum. 7710E510 doi: 10.1063/1.2237488
|
| [6] |
Huang Y et al 2007 Rev. Sci. Instrum. 78 113501 doi: 10.1063/1.2804105
|
| [7] |
Yamada I et al 2010 Fusion Sci. Technol. 58 1 doi: 10.13182/FST58-1
|
| [8] |
Zang Q et al 2010 Plasma Sci. Technol. 12 144 doi: 10.1088/1009-0630/12/2/04
|
| [9] |
Lee J H Oh S T and Wi H M 2010 Rev. Sci. Instrum. 81 10D528 doi: 10.1063/1.3494275
|
| [10] |
Carlstrom T N et al 2018 Rev. Sci. Instrum. 89 10C111 doi: 10.1063/1.5036968
|
| [11] |
Tojo H et al 2017 Fusion Eng. Des. 123 678 doi: 10.1016/j.fusengdes.2017.06.037
|
| [12] |
Xiao S M et al 2016 Fusion Eng. Des. 105 33 doi: 10.1016/j.fusengdes.2016.02.071
|
| [13] |
Sheffield J 1972 Plasma Phys. 14 783 doi: 10.1088/0032-1028/14/8/003
|
| [14] |
Maslov M et al 2012 Rev. Sci. Instrum. 83 096106 doi: 10.1063/1.4755809
|
| [15] |
Yatsuka E et al 2013 J. Instrum. 8 C12001 doi: 10.1088/1748-0221/8/12/C12001
|
| 1. | Tong, R., Zhou, Y., Zhong, W. et al. A new Q-band comb-based multi-channel microwave Doppler backward scattering diagnostic developed on the HL-3 tokamak. Plasma Science and Technology, 2025, 27(1): 015102. DOI:10.1088/2058-6272/ad8c86 |
| 2. | Wang, Z.H., Zhang, B., Gong, X.Z. et al. Electron ITB formation in EAST high poloidal beta plasmas under dominant electron heating. Plasma Physics and Controlled Fusion, 2024, 66(6): 065002. DOI:10.1088/1361-6587/ad3c1a |
| 3. | Gong, S.B., Zhang, T.C., Guo, W.P. et al. Edge Thomson scattering diagnostic with compact polychromators on the HL-3 Tokamak. Journal of Instrumentation, 2023, 18(10): C10019. DOI:10.1088/1748-0221/18/10/C10019 |
Figures(9) / Tables(2)
Supported by: Beijing Renhe Information Technology Co., Ltd. 
| Surface | Curvature (mm) | Thickness (mm) | Diameter (mm) | Glass |
| Lens 1 | 156.9 | 35 | 164 | BK7 |
| inf | ||||
| Lens 2 | -177.1 | 25 | 144 | BK7 |
| 154.8 | ||||
| Lens 3 | 235.7 | 35 | 128 | BK7 |
| -134.4 | ||||
| Lens 4 | -129.4 | 25 | 128 | BK7 |
| -289.4 | ||||
| Lens 5 | 1115.7 | 30 | 144 | BK7 |
| -332.3 | ||||
| Lens 6 | 300.4 | 40 | 164 | BK7 |
| -493.1 |
DownLoad:
CSV
| Parameters | Values |
| Tr | 0.24 |
| △Ω | 0.0138 sr |
| re | 2.82 × 10⁻¹⁵ m |
| ne | 5 × 10¹⁸ m-3 |
| △l | 0.01 m |
| E0 | 2 J |
| h | 6.63 × 10⁻³⁴ J·s |
| c | 3 × 10⁸ m s-1 |
| θ | 90° |
| λ0 | 1064 nm |
| k | 1.38 × 10⁻²³ J K-1 |
| me | 9.1 × 10⁻³¹ kg |
| △λ | λ-λ0 |
DownLoad:
CSV