Quanfa ZHAO, Haixia WU, Wang SHEN, Xiao HAN, Bin ZHENG, Jiawei FAN. Comparative study on the degradation of phenol by a high-voltage pulsed discharge above a liquid surface and under a liquid surface[J]. Plasma Science and Technology, 2023, 25(10): 104002. DOI: 10.1088/2058-6272/accf66
Citation:
Quanfa ZHAO, Haixia WU, Wang SHEN, Xiao HAN, Bin ZHENG, Jiawei FAN. Comparative study on the degradation of phenol by a high-voltage pulsed discharge above a liquid surface and under a liquid surface[J]. Plasma Science and Technology, 2023, 25(10): 104002. DOI: 10.1088/2058-6272/accf66
Quanfa ZHAO, Haixia WU, Wang SHEN, Xiao HAN, Bin ZHENG, Jiawei FAN. Comparative study on the degradation of phenol by a high-voltage pulsed discharge above a liquid surface and under a liquid surface[J]. Plasma Science and Technology, 2023, 25(10): 104002. DOI: 10.1088/2058-6272/accf66
Citation:
Quanfa ZHAO, Haixia WU, Wang SHEN, Xiao HAN, Bin ZHENG, Jiawei FAN. Comparative study on the degradation of phenol by a high-voltage pulsed discharge above a liquid surface and under a liquid surface[J]. Plasma Science and Technology, 2023, 25(10): 104002. DOI: 10.1088/2058-6272/accf66
The degradation of phenol by pulsed discharge plasma above a liquid surface (APDP) and under a liquid surface (UPDP) was compared. The effects of discharge voltage, discharge distance, initial solution conductivity and initial pH on the removal of phenol were studied. It was concluded that the removal of phenol increases with increasing discharge voltage and with decreasing discharge distance in both APDP and UPDP systems. An increase in the initial solution's conductivity has a positive effect in the APDP system but a negative effect in the UPDP system. In addition, alkaline conditions are conducive to the degradation of phenol in the APDP system, while acidic conditions are conducive in the UPDP system. Free radical quenching experiments revealed that ·O2- has an important influence on the degradation of phenol in the APDP system, while ·OH plays a key role in the UPDP system. This paper verifies the differences in the two discharge methods in terms of phenol removal.
As an emerging advanced oxidation technology, high-voltage pulsed discharge has been widely used in the removal of organic pollutants and other applications for its excellent performance, such as high efficiency, simple operation and wide adaptability [1–4]. In the research of environmental pollution control, differences in the discharge reactor structure affect the production of active substances and the degradation efficiency of organic pollutants. The electrode configurations of pulsed discharge reactors include needle–plate [5, 6], wire–plate [7], plate–plate [8], wire–barrel [9, 10] and pin–liquid [11]. The needle–plate reactor is one of the common reactors widely studied because it induces a strong electric field (up to 109 V m-1) near the tip of the needle electrode [12]. Compared with other types of reactors, the needle–plate reactor has the advantages of low initial breakdown voltage and high energy density. Through continuous exploration and research, the needle–plate reactor has also been developed from a single needle–plate reactor to a multi-needle–plate reactor. Wang et al [13] used a needle–plate reactor discharge to treat acid orange wastewater and showed that the degradation efficiency enhanced with increasing peak voltage and discharge frequency. Dong et al [14] used a multi-needle–plate discharge reactor to treat formaldehyde and optimized the reactor to achieve an optimum degradation efficiency. Sun et al [15] used a gas-phase multi-needle–plate discharge system to degrade the organic pollutant methyl orange. Lukes et al [16] used a needle–plate electrode reactor to investigate the degradation of dimethylsulfoxide (DMSO) and concluded that tungstate ions generated by corrosion of the tungsten electrode (high-voltage electrode) accelerated the decomposition of H2O2 and enhanced the degradation of DMSO. Shen et al [17] compared a needle–plate and a wire–barrel reactor to treat acid orange 7 (AO7) dye and found that the concentrations of H2O2 and O3 produced in the needle–plate reactor are higher than those in the wire–barrel reactor, which improved the higher degradation efficiency of AO7.
Depending on the location of the electrodes in the water treatment reactor, the discharge mode is divided into gas-phase discharge, liquid-phase discharge and gas–liquid discharge [18]. In liquid-phase discharge, both the electrodes are placed in the solution, and an instantaneous discharge is formed by the high voltage applied to them. Instantaneous discharge forms plasma channels and creates some physical effects [19]. In the inelastic collision of high-energy electrons with a variety of substances in water, a large number of active substances are produced (·OH, ·O, ·HO2, ·O2-, 1O2, H2O2, O3, etc) [20, 21]. The reactive substances can interact directly with the target contaminant. In a gas–liquid phase discharge, one electrode is placed above the water surface, while the other electrode is immersed in the liquid or attached to the outer wall of the reactor. It is affected little by the erosion of the discharge electrodes and the solution conductivity, but the utilization rate of the generated active substances will be affected by the diffusion coefficient of gas into the solution. Liang et al [22] compared the degradation of methylene blue (MB) by using a needle–plate reactor in the liquid and gas–liquid phases. It was found that the liquid discharge produced a higher concentration of H2O2 than the gas–liquid phase discharge, which was more favorable to the activation of deionized water, but less degradation of MB than the liquid-phase discharge. Although the treatment of organics with different discharge methods has been investigated, few studies are about wastewater treatment with different forms of discharge in a reactor.
In this work, a needle–plate reactor was used to treat phenol wastewater, and pulsed discharge plasma above the liquid surface (APDP) and under the liquid surface (UPDP) were compared. The APDP system is a gas-phase discharge and the UPDP system is a gas–liquid phase discharge. The influences of operating variables on the degradation of phenol such as discharge voltage, discharge distance, initial solution conductivity and initial pH value were studied. The differences in the degradation mechanisms of phenol between the APDP and UPDP systems were investigated based on free radical quenching experiments and the concentration of oxides such as O3 and H2O2.
2.
Experiment
2.1
Experimental system and experimental method
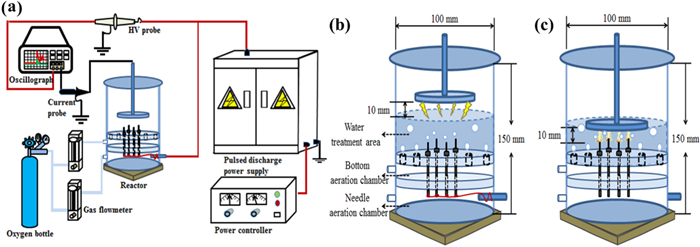
Figure 1(a) shows the schematic diagram of the experimental set-up. It consists of a pulsed power supply (Institute of electrostatics, Dalian University of Technology, China), a plasma reactor and a gas supply system. The adjustment ranges of the power supply are 0–50 kV and 0–150 Hz. The pulse width is 500 ns and the pulse rise front is 200 ns. A Plexiglass cylinder (diameter 100 mm, height 150 mm, thickness 4 mm) is used as the treatment reactor. Four hollow stainless-steel needles with inner diameter 0.8 mm are high-voltage electrodes and fixed at the bottom of the reactor. A stainless-steel plate (diameter 60 mm, thickness 2 mm) as ground electrode is placed above or inside the solution through a threaded rod. Figure 1(b) shows a APDP reactor with the ground electrode located 10 mm above the water surface, and the discharge occurs in the gas gap between the electrode and the solution. Figure 1(c) shows a UPDP reactor with the ground electrode immersed in water. The distance between the ground electrode and the high-voltage electrode is 10 mm, and the discharge occurs between the two electrodes. Oxygen flow is controlled by two flowmeters (Xiangyun, LZB-4WB, China).
Figure
1.
(a) Schematic diagram of the experimental set-up, and structural diagrams of (b) APDP and (c) UPDP reactors.
In each experiment, 200 ml phenol wastewater with 20 mg l-1 concentration was placed in the cylinder vessel and treated by plasma for 50 min. The initial pH was adjusted with 0.1 mol l-1 HCI and 0.1 mol l-1 NaOH. Oxygen flow was 1.5 l min-1. Unless mentioned, the initial peak voltage was 22 kV and the discharge frequency was 50 Hz. The initial conductivity of phenol wastewater was 2.5 μS cm-1 and initial pH was 7.0.
2.2
Materials and analytic methods
The concentration of phenol was determined by the 4-aminoantipyrene method [23]. Ozone concentration in the solution was determined by indigo trisulfonate spectrophotometry [24]. Hydrogen peroxide concentration in the solution was determined based on the study of Joshi et al [25]. The oscilloscope (Tektronix TBS 1202B, USA) equipped with a voltage probe (Tektronix P6015, USA) was used to measure the voltage and frequency during the reaction. The light emission images were recorded by a CCD digital camera (Canon PowerShot G6, China) to capture the side image of the discharge. The pH value of the solution was measured by a pH meter (INESA, pHS-3C, China). The conductivity of the solution was measured with a conductivity meter (INESA, DDS-11A, China). The product of the combination of 5,5-dimethyl-1-pyrroline-N-oxide (DMPO) and ·OH produces a 1:2:2:1 characteristic peak by an electron paramagnetic resonance (EPR) analyzer (Bruker E500, Germany). The presence of ·OH in the solution was further verified by the EPR analyzer. The total organic carbon (TOC) of the wastewater was analyzed using a TOC meter (SSM-5000A, Shimadzu, Japan). Tert-butyl alcohol (TBA), p-benzoquinone (p-BQ) and 2,2,6,6-tetramethylpiperidine-1-oxyl (TEMPO) were used to quench ·OH [26], ·O2- [27] and ·1O2 [28], respectively.
The removal efficiency of phenol is calculated according to equation (1):
η(%)=(1−CtC0)×100
(1)
where C0 is the initial concentration of the pollutant (mg l–1) and Ct is the concentration of the pollutant after t minutes of treatment (mg l–1).
To further describe the degradation process of the pollutants, experimental data were fitted using a first-order reaction kinetic model according to equation (2):
ln(C0Ct)=kt
(2)
where k is the kinetic constant (min-1), t is the reaction time (min) and C0 and Ct are as described above.
The discharge power P is calculated according to equation (3):
P=1T∫T0Ut(It−I′t)dt
(3)
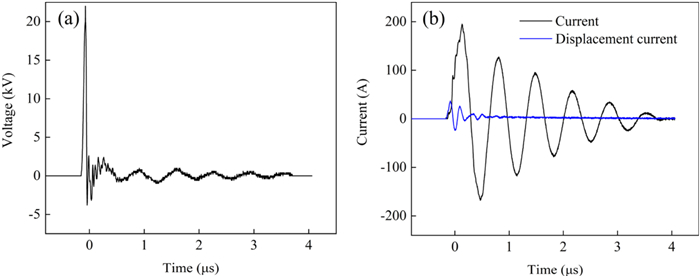
where P is the discharge power (W), T is the discharge time (s), It is the current (A), It' is the displacement current (A) and Ut is the voltage (Ⅴ). The current and voltage waveforms are shown in figure 2.
Figure
2.
(a) Voltage and (b) current waveforms with 22 kV peak voltage.
The energy efficiency G is calculated according to equation (4):
G=C0×V×ηP×t
(4)
where G is the energy efficiency (g kWh–1), V is the volume of the solution (l), P is the discharge power (W) and t is the discharge time (h).
3.
Results and discussion
3.1
Effect of discharge voltage
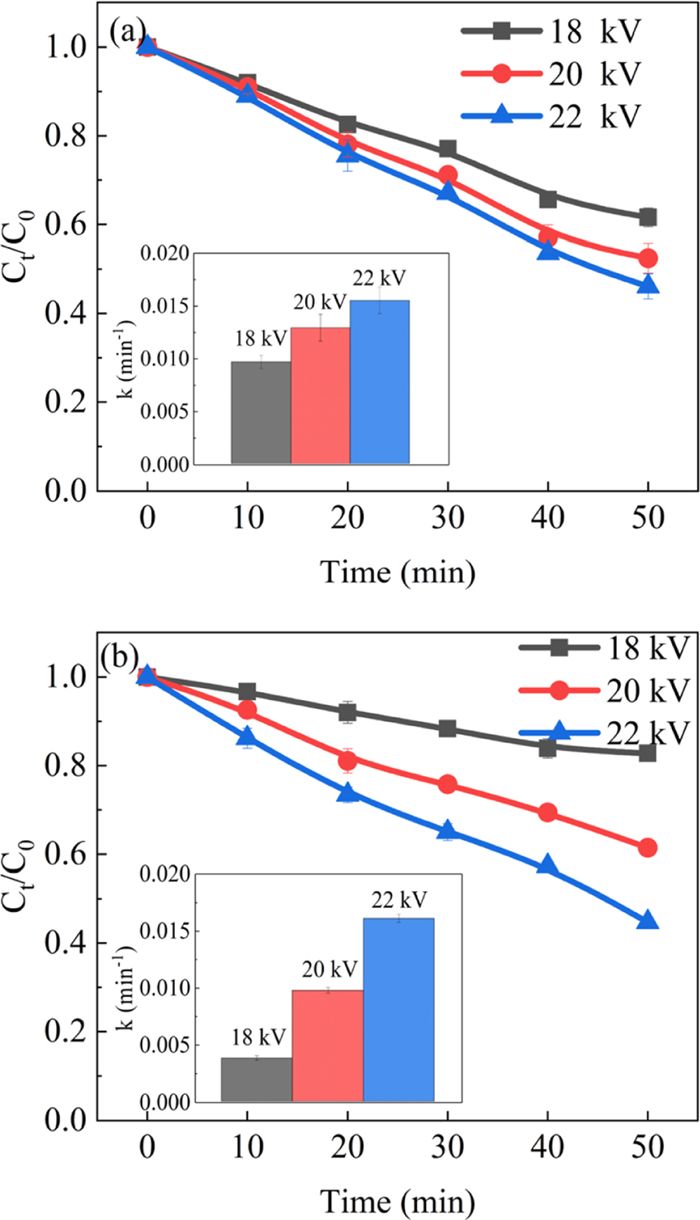
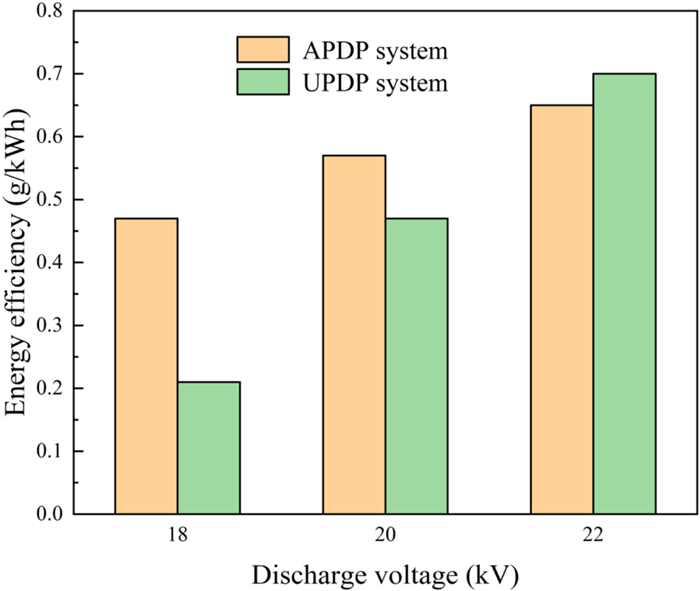
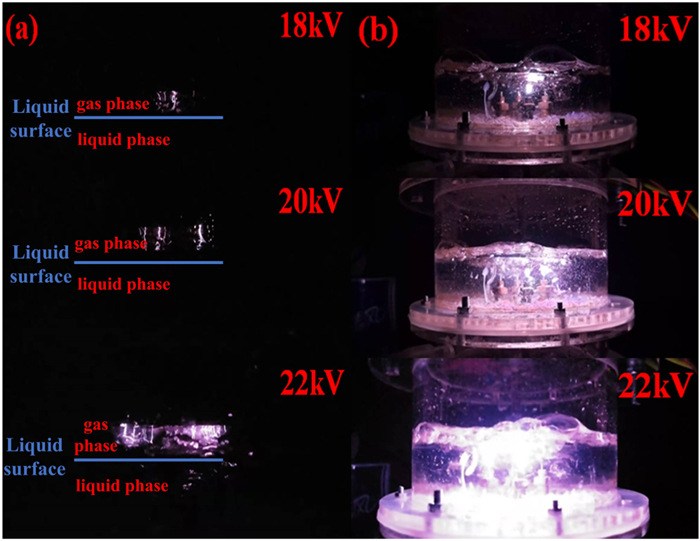
The discharge energy and electric field will increase with increasing the discharge voltage, thus enhancing the production of active substances. To investigate the effect of discharge voltages on the removal of phenol in the APDP and UPDP systems, experiments were conducted at 18 kV, 20 kV and 22 kV. The degradation efficiency of phenol increased as the discharge voltage increased in both the APDP and UPDP systems. Figures 3(a) and (b) show that the discharge voltage increased from 18 to 22 kV, and the degradation efficiency of phenol increased from 38.4% to 53.9% in the APDP system and from 17.2% to 55.3% in the UPDP system after 50 min treatment. Figure 4 shows that energy efficiency increased as the discharge voltage increased in both the APDP and UPDP systems. As shown in figure 5(a), the number of APDP channels increased and the visible radiation was enhanced with increasing discharge voltage. A similar phenomenon was found by Shang et al [29]. It is generally believed that an increase in discharge voltage enhances the electric field strength between the electrode and the solution surface. In figure 5(b), the UPDP only had spark discharges at one discharge electrode at 18 kV. As the discharge voltage increased, all four electrodes produced spark discharges. The increase in discharge voltage increases the energy of the input system and enhances the physical effects such as ultraviolet light. The higher energy input and ultraviolet light can produce more active substances and thus enhance the degradation efficiency of phenol. The degradation of phenol by ultraviolet light has two main aspects. On one hand, the photodegradation is carried out by direct excitation of phenol dissociation by effective photons. On the other hand, the H2O2 and O3 generated by the discharge produce ·OH under ultraviolet light (as shown in reactions (5) and (6)), and the oxidation capacity of ·OH is extremely strong, thus improving the degradation efficiency of phenol.
O3+H2O+hv→H2O2+O2
(5)
H2O2+hv→2⋅OH
(6)
Figure
3.
Effect of discharge voltage on phenol degradation in (a) the APDP system and (b) the UPDP system (d = 8 mm, σ = 2.5 μS cm-1, pH = 7.0).
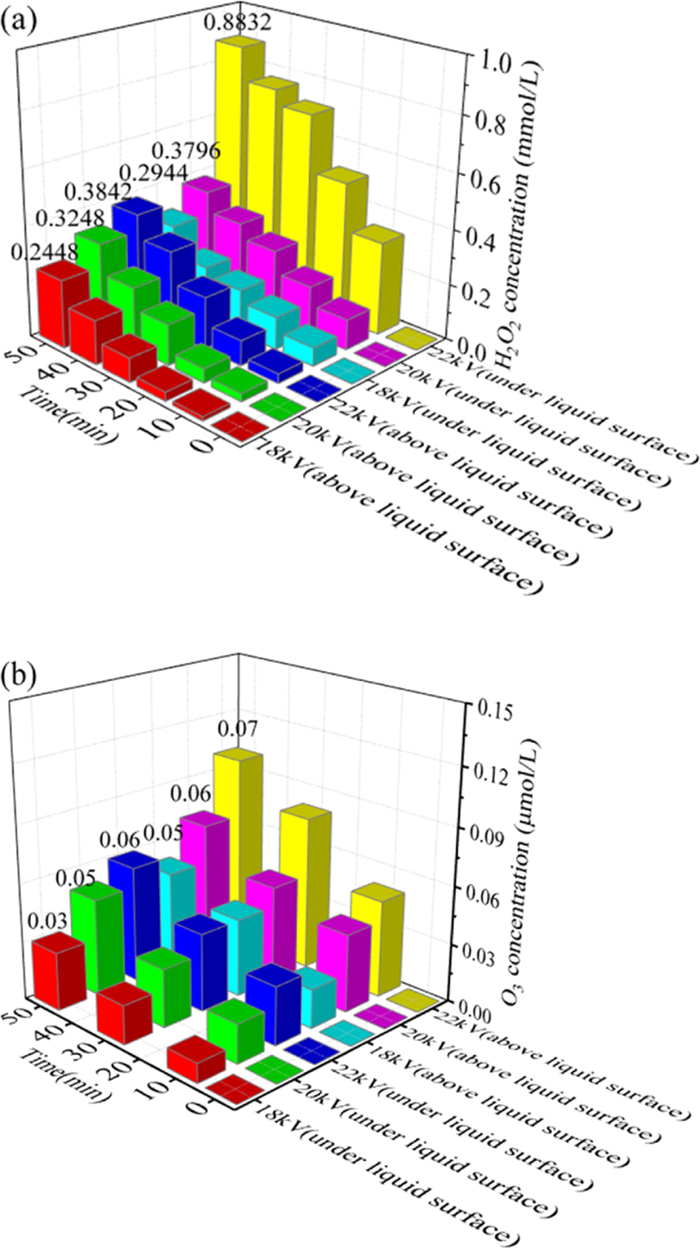
Compared with the APDP system, the kinetic constant in the UPDP system increased by a factor of 2.8. In figures 6(a) and (b), the concentrations of H2O2 and O3 in the solution increased as the discharge voltage increased. The productions of H2O2 and O3 are higher and lower respectively in the UPDP system than those in the APDP system. In the UPDP system, the discharge occurs in the solution because both the high-voltage electrode and the ground electrode are in the solution. H2O2 is mainly produced through the reaction of H2O molecules with high-energy electrons (e-) and of some other active substances with each other [30], as shown in reactions (7)–(11). In addition, the decomposition reaction of O3 produces ·OH, which also causes an increase in the H2O2 content. Since the discharge region in the APDP system is mainly the gas-phase region, the direct effect of high-energy electrons on H2O molecules is small. In the UPDP system, the discharge in water results in a significantly higher chance of reaction between energetic electrons and H2O molecules, which causes an increase in the production of H2O2 in the solution.
H2O+e−→⋅H+⋅OH
(7)
⋅H+O2→⋅HO2
(8)
2⋅HO2→H2O2+O2
(9)
2⋅OH→H2O2
(10)
⋅H+⋅HO2→H2O2
(11)
Figure
6.
Variations of (a) H2O2 and (b) O3 concentrations in phenol solutions (d = 8 mm, σ = 2.5 μS cm-1, pH = 7.0).
In the APDP system, the discharge occurs in the gas phase above the liquid surface, producing O3 with the action of high-energy electrons. O3 generated in the gas phase above the liquid level is transferred to the liquid phase [31]. As can be seen from figure 6(a), the concentration of O3 increases with increasing discharge voltage. The highest concentration of O3 is 0.07 μmol l-1 and the lowest is 0.05 μmol l-1. In the UPDP system, the discharge occurs in the liquid phase, and only some high-energy electrons collide with oxygen molecules, thus reducing the amount of O3 produced in the solution. The highest concentration of O3 is 0.06 μmol l-1 and the lowest is 0.03 μmol l-1. The determination of O3 shows that O3 plays a role in the degradation of phenol in the APDP system. On one hand, O3 can directly react with phenol to degrade it; on the other hand, O3 can decompose to produce ·OH to degrade phenol (as shown in reactions (12)–(15)). The combined action of O3 and ·OH promoted the degradation of phenol.
O3+e−→⋅O−3
(12)
⋅O−3+H+→⋅HO3
(13)
⋅H+O3→⋅HO3
(14)
⋅HO3→O2+⋅OH
(15)
3.2
Effect of discharge distance
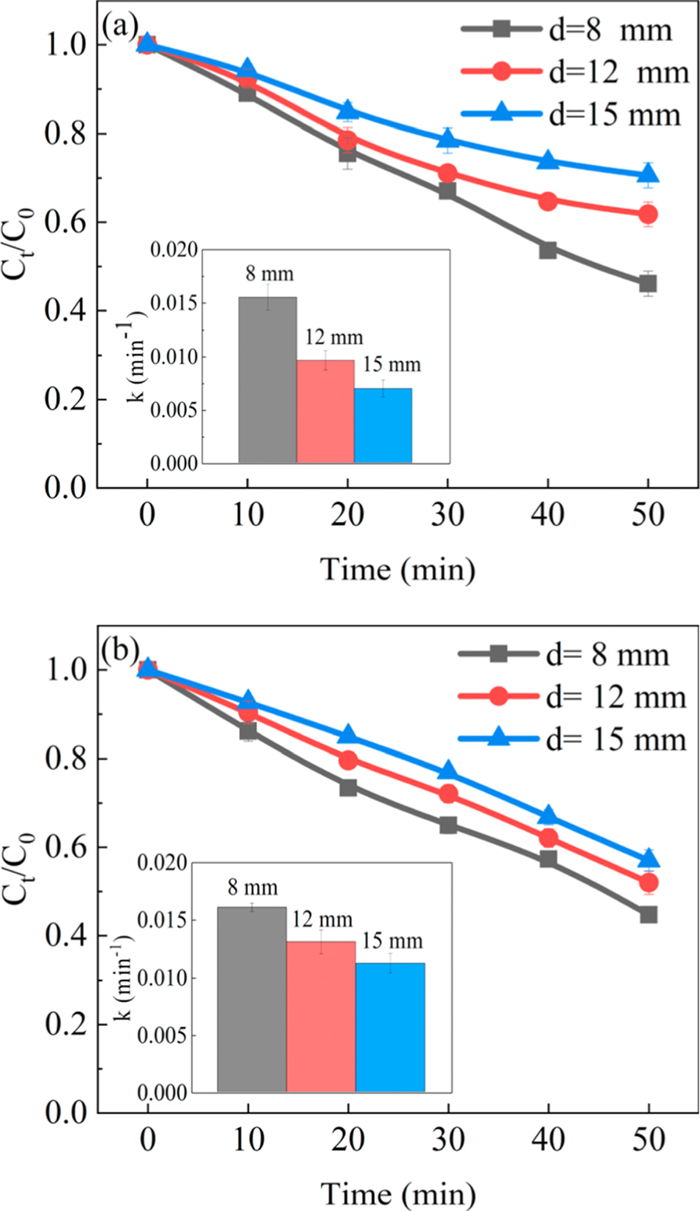
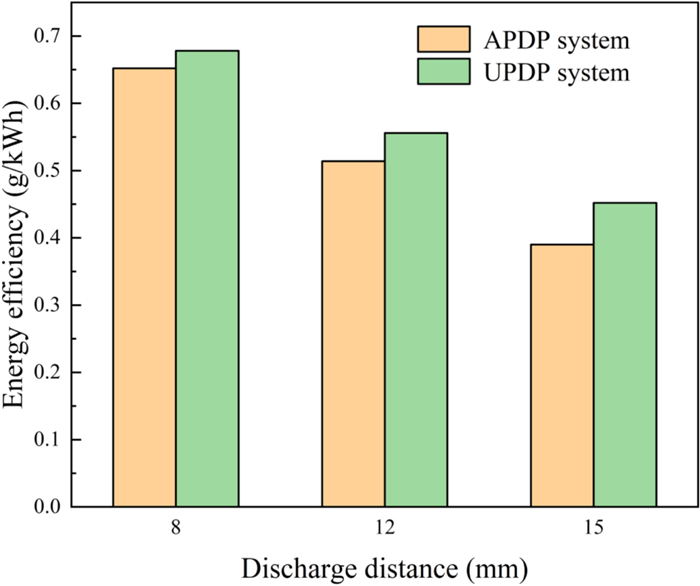
A different discharge distance changes the electric field intensity and affects the removal of pollutants [32]. As seen in figure 7(a), the degradation efficiency of phenol in the APDP system increased from 29.4% to 53.9% as the discharge distance decreased. As seen in figure 8, the energy efficiency of phenol in the APDP system increased from 0.39 to 0.65 g kWh-1 as the discharge distance decreased. With a small discharge distance, plasma channels are formed strongly between the liquid surface and the electrode [33, 34], improving the degradation efficiency of phenol. In addition, a small discharge gap enhances the diffusion of active substances from the liquid surface into the liquid, thus also improving the degradation efficiency of phenol.
Figure
7.
Effect of discharge distance on phenol degradation in (a) the APDP system and (b) the UPDP system (U = 22 kV, σ = 2.5 μS cm-1, pH = 7.0).
In the UPDP system, the changes in phenol removal and energy efficiency are the same as those in the APDP system (figures 7(b) and 8). A discharge distance of 8 mm is small and produces bright, zigzag, narrow and bifurcated electric sparks, and the form of plasma discharge is spark discharge. High-energy electrons and strong UV radiation are very effective in exciting and ionizing water molecules [35]. Due to the high current between the discharge electrodes during the spark discharge, the electric field between the electrodes interacts strongly with the surrounding O2 and H2O and generates O3 and H2O2. When the discharge distance was adjusted from 8 to 15 mm, the discharge channels decreased and were less energetic. The intensity of UV radiation was relatively low and the corresponding phenol degradation efficiency decreased.
3.3
Effect of solution conductivity
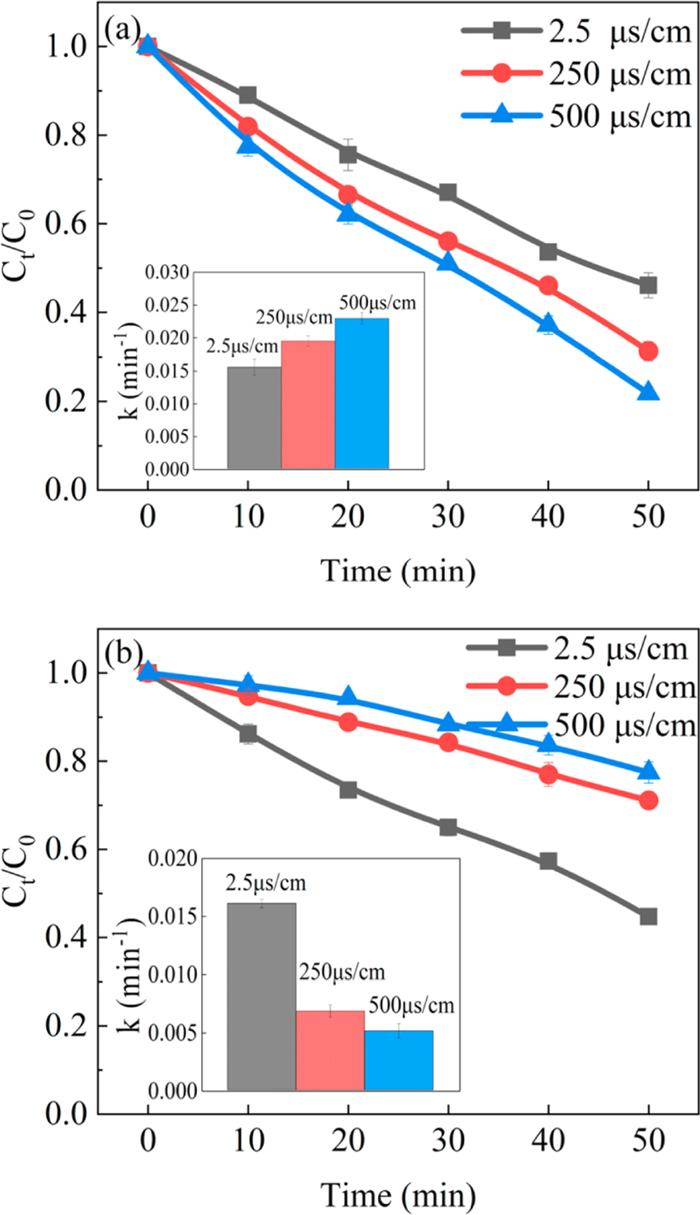
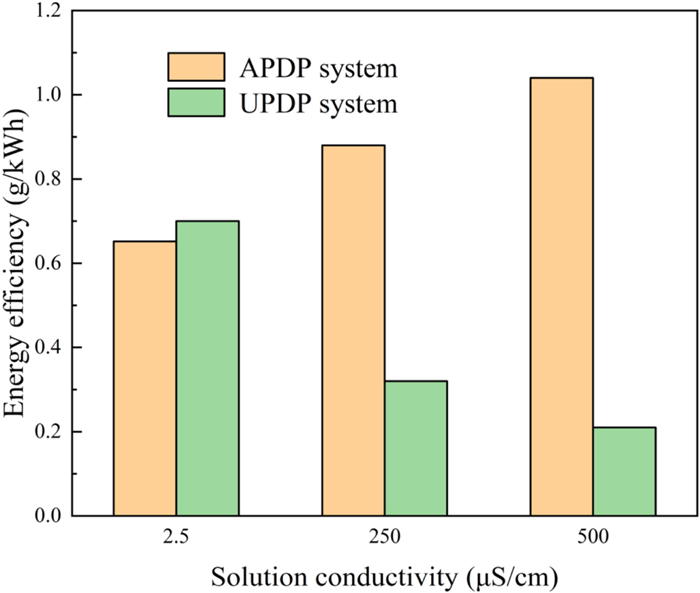
The conductivity of the solution was one of the important parameters affecting plasma discharge, which could affect the generation of active substances in APDP and UPDP systems. NaCl was added to the solution by adjusting the conductivity. Cl- would react with the ·OH to form Cl· and react with O3 to form HClO, as shown in reactions (16) and (17) [36]. Cl· and HClO could also have an effect on the degradation of phenol. As seen in figure 9(a), with the solution conductivities adjusted from 2.5 to 250 μS cm-1 and 500 μS cm-1, the degradation efficiency of phenol increased by 14.8% and 24.9% respectively after 50 min of reaction in the APDP system. The solution conductivity affects the plasma discharge channel propagating along the water surface. As seen in figure 10, the energy efficiency increased as the solution conductivity increased, up to 1.04 g kWh-1. As the solution conductivity increases, the discharge current and the density of the discharge channel increase [33]. Moreover, the O3 concentration at 500 μS cm-1 was 1.57 times that at 2.5 μS cm-1. The H2O2 concentration increased from 0.38 to 0.47 mmol l-1 as the conductivity increased from 2.5 to 500 μS cm-1. The increased conductivity of the solution enhanced the discharge intensity and promoted the production of active substances in the solution, which in turn promoted the removal of phenol.
Cl−+⋅OH→Cl⋅+OH−
(16)
Cl−+O3+H+→HClO+O2
(17)
Figure
9.
Effect of solution conductivity on the removal of phenol in (a) the APDP system and (b) the UPDP system (U = 22 kV, d = 8 mm, pH = 7.0).
In the UPDP system, the increase in conductivity of the solution has a negative effect on the removal of phenol. As seen in figure 9(b), the degradation efficiency of phenol decreased from 55.3% to 28.9% and 22.6% when the solution conductivity increased from 2.5 to 250 μS cm-1 and 500 μS cm-1, respectively. As seen in figure 10, the energy efficiency decreased as the solution conductivity increased, which was contrary to the APDP system. The increase in conductivity caused the ions in the solution to collide with high-energy electrons, resulting in a weak bombardment of O2 and H2O with high-energy electrons, thus reducing the amount of oxides generated [35].
3.4
Effect of initial pH
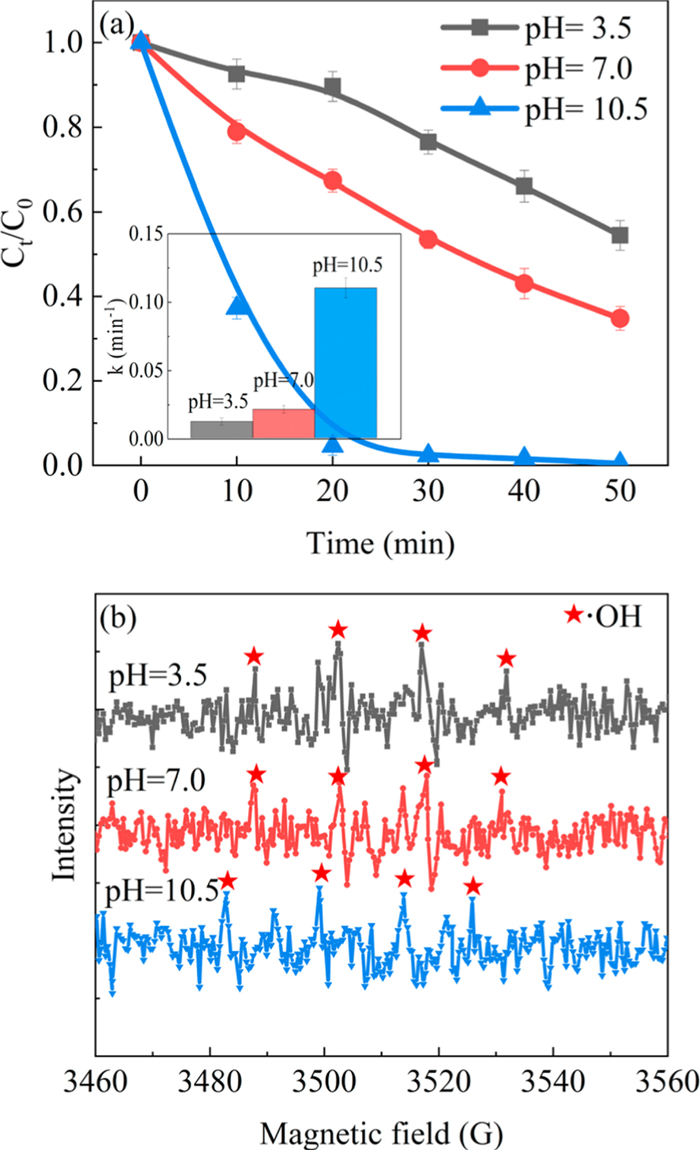
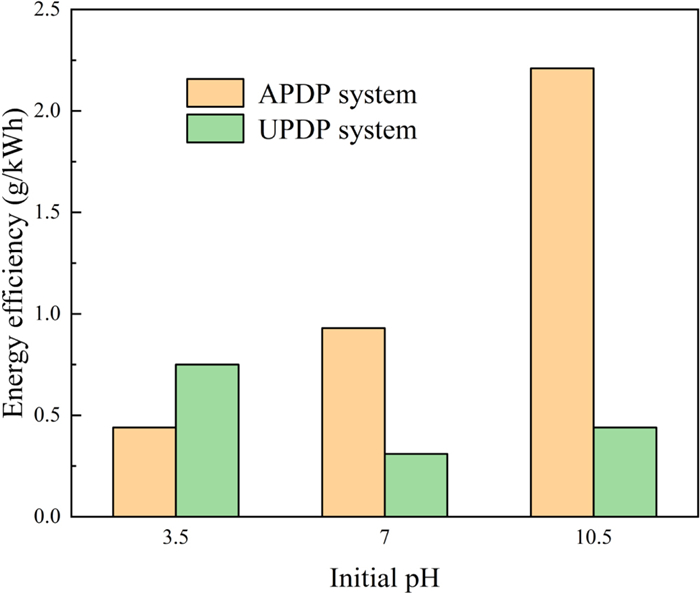
The pH of the solution plays an important role in the removal of pollutants because it affects the plasma chemistry and the acid–base balance of the organic molecules [30]. To avoid the influence of conductivity on the degradation of phenol by the plasma discharge system, the solution conductivity was adjusted to 300 μS cm-1. Alkaline conditions in the APDP system favored the degradation of phenol rather than neutral and acidic conditions, as seen in figure 11(a). In figure 12, the energy efficiency under alkaline conditions in the APDP system was much higher than that under neutral and acidic conditions, reaching 2.21 g kWh-1. It was generally believed that alkaline conditions provided more OH- to form ·OH [37], thus increasing the degradation efficiency of phenol. Moreover, phenol was more reactive under alkaline conditions than under acidic conditions due to the electronic reactivity enhancing the π-bonds in the aromatic ring [30]. To illustrate the effect of pH on the discharge plasma process further, EPR measurement of the solution after the reaction was carried out as shown in figure 11(b). The above experimental results suggested that ·OH was not the main factor in the rapid degradation of phenol under alkaline conditions. The free radical quenching experiment indicated that ·O2- is the main oxidizing substance affecting the degradation of phenol (alkaline conditions). The content of O3 in the APDP system was high, and its decomposition products under alkaline conditions might promote the degradation of phenol, according to reactions (18) and (19). In addition, ·OH and ·1O2 generated in the APDP system were beneficial to the degradation of phenol.
OH−+O3→2⋅O−2+H+
(18)
OH−+O3→⋅O−2+⋅HO2
(19)
Figure
11.
(a) Effect of solution pH on the removal of phenol; (b) EPR detection in the APDP system (U = 22 kV, d = 8 mm, σ = 300 μS cm-1).
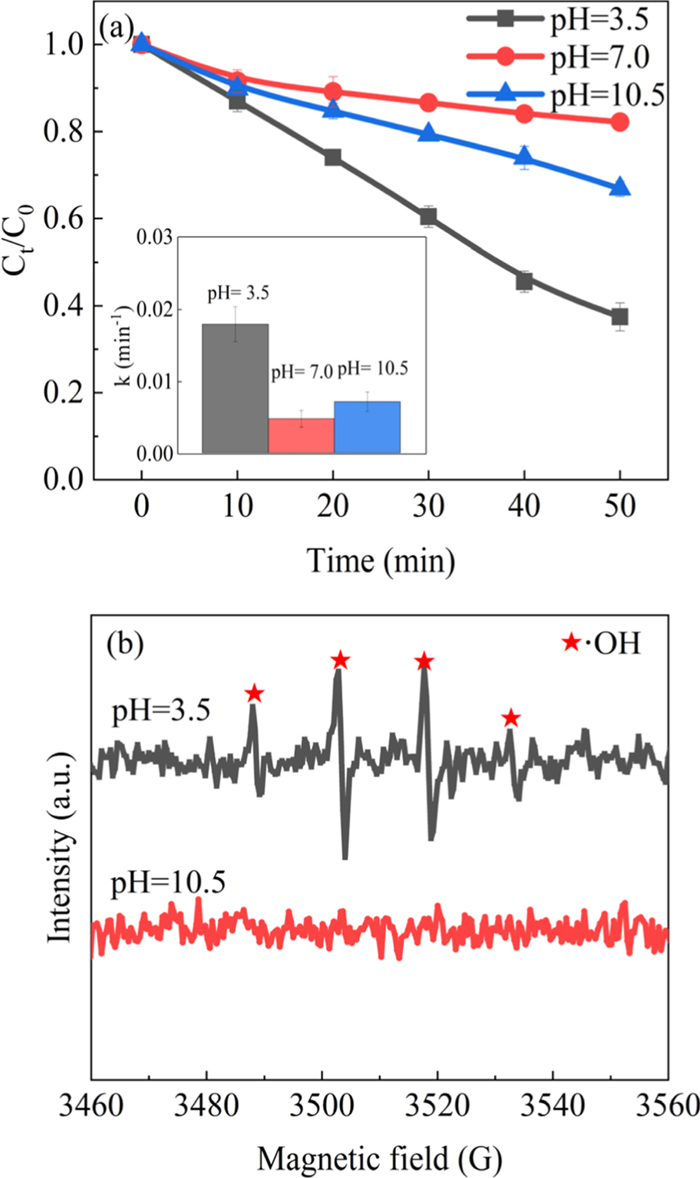
In the UPDP system, the degradation efficiency of phenol is the lowest in neutral conditions. When the pH value was adjusted from 7.0 to 3.5, the degradation efficiency of phenol increased from 17.8% to 62.5%. Under acidic conditions, the concentration of O3 in the solution was 0.07 μmol l-1, which was significantly higher than that in the neutral (0.05 μmol l-1) and basic (0.03 μmol l-1) solutions. For the stability of O3 under acidic conditions, phenol was susceptible to direct oxidative decomposition by O3. In addition, ·OH in the phenol solution was further analyzed using an EPR detector after treatment in the UPDP process. As shown in figure 13, the EPR signal of ·OH is evident when pH = 3.5 and not significant when pH = 10.5. There is no EPR signal when pH = 7.0. At higher pH conditions, ·OH would be consumed through reaction (20). The oxidation potential of ·OH was reduced in alkaline conditions. H2O2 was unstable in alkaline solutions and could be easily decomposed into H2O and O2. Therefore, the degradation efficiency of phenol in alkaline conditions was lower than that in acidic conditions.
⋅OH+OH−→H2O+O−
(20)
Figure
13.
(a) Effect of solution pH on phenol degradation; (b) EPR detection in the UPDP system (U = 22 kV, d = 8 mm, σ = 300 μS cm-1).
Based on the differences in the discharge type and the active substances in the two systems, free radical quenching experiments were carried out to verify the role of radicals in phenol decomposition.
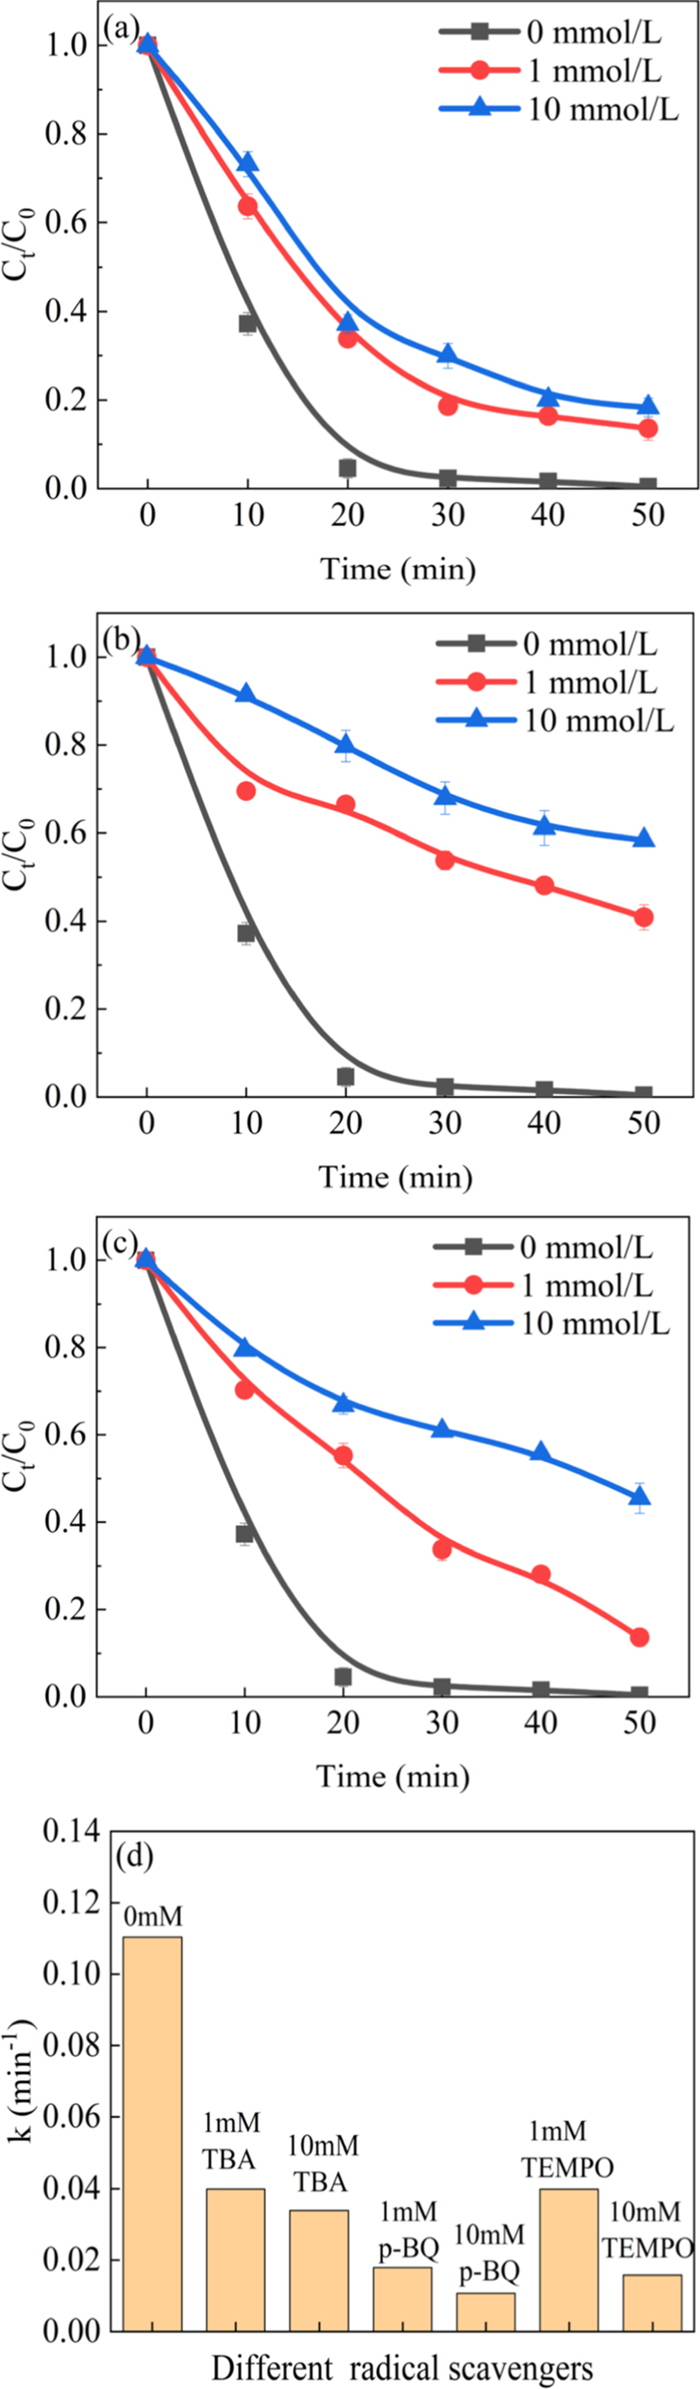
As shown in figure 14, the addition of free radical trapping agents significantly reduced the degradation efficiency of phenol. When the dose of TBA, p-BQ and TEMPO agent was 1 mM, the degradation efficiency of phenol decreased by 13.2%, 42.4% and 13.1%, respectively. When the trap dose was 10 mM, the inhibition of phenol degradation was more pronounced, with the degree of inhibition being mainly: p-BQ > TEMPO > TBA. In figure 14(d), the kinetic constants decreased most significantly with the addition of p-BQ, with a decrease of 58.0%, far exceeding the effect of TBA and TEMPO on phenol removal. The experimental results indicate that ·O2- is the main oxidizing substance affecting the degradation of phenol (alkaline conditions). In addition, ·OH, ·1O2 and O3 generated in the APDP system also play important roles in the degradation of phenol.
Figure
14.
Effect of (a) TBA, (b) p-BQ and (c) TEMPO on the degradation of phenol in the APDP system (pH = 10.5) and (d) change in kinetic constants.
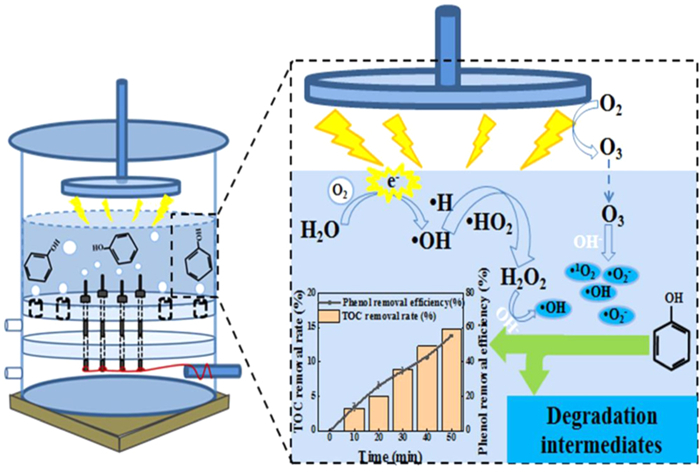
The area of plasma discharge is concentrated between the water surface and the grounded earth pole in the APDP system (figure 15). After oxygen aeration, the high concentration of oxygen in the gas phase is converted to O3 by plasma discharge, and this is then dissolved in the liquid and participates in the degradation of pollutants. In addition, some of the high-energy electrons act directly on the water molecules and thus participate in the production of H2O2. The high degradation efficiency of phenol under alkaline conditions is mainly attributed to ·O2-.
Figure
15.
Schematic representation of the degradation mechanism of phenol in the APDP system.
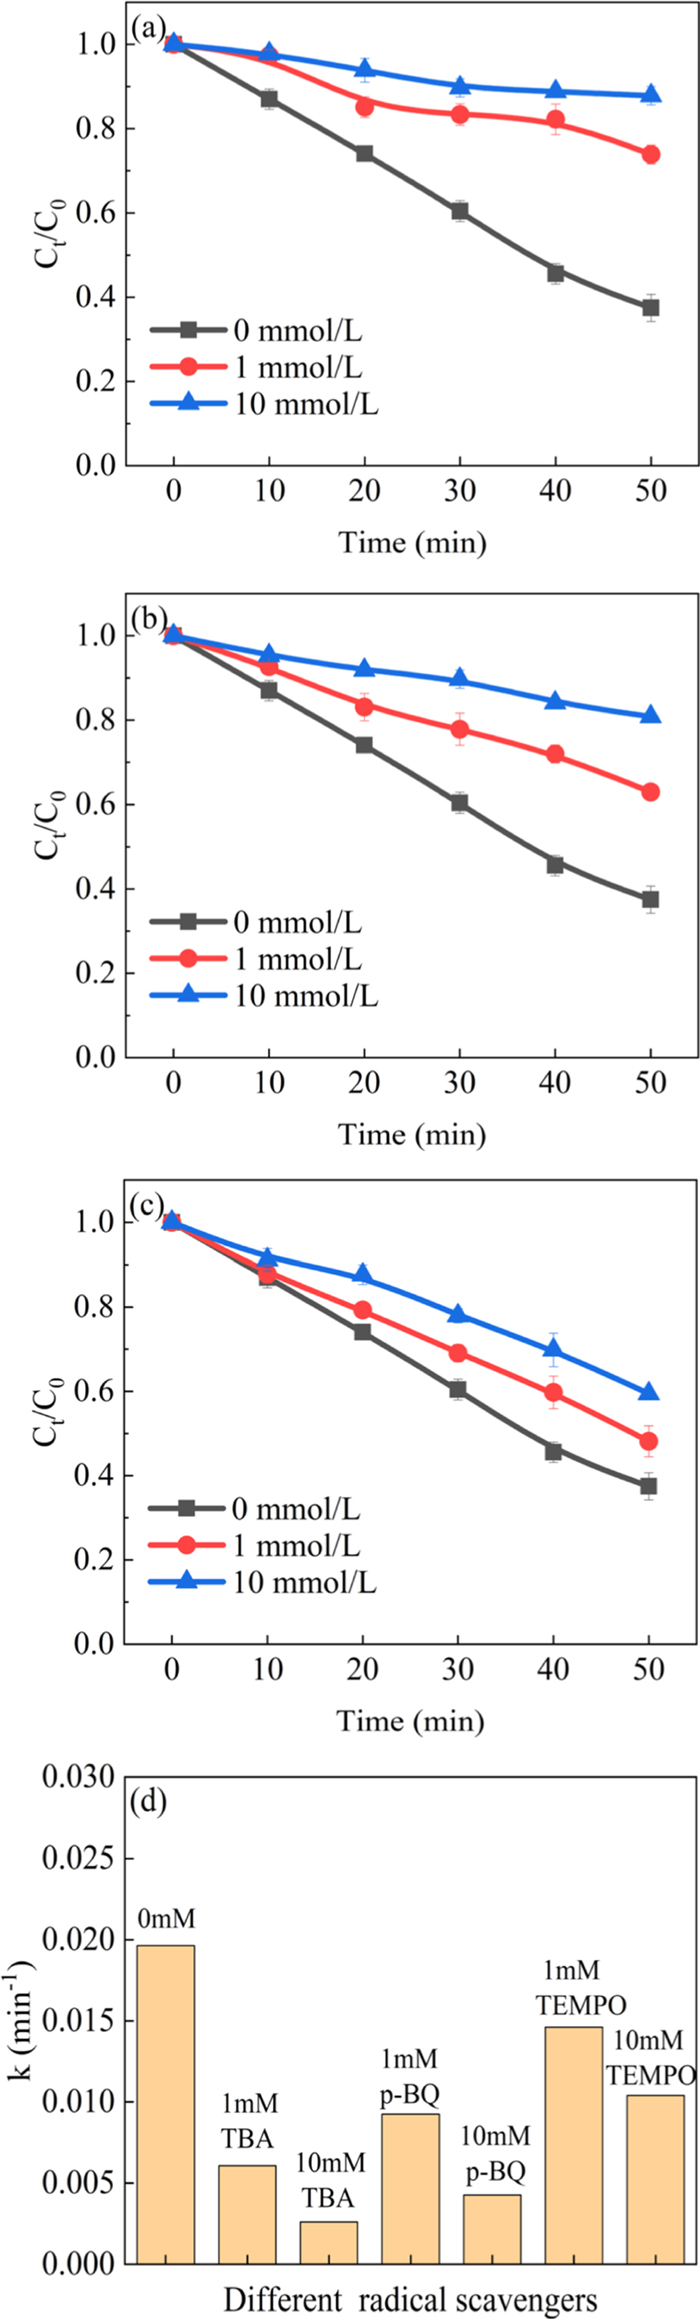
Same quenching tests were carried out under acidic conditions in the UPDP system. As shown in figure 16, the degradation efficiency of phenol is inhibited and the degradation kinetic constants of phenol are significantly reduced. The effect of TBA addition compared to other quenching agents indicates that ·OH plays a very important role in the degradation of phenol in the UPDP system (acidic conditions).
Figure
16.
Effect of (a) TBA, (b) p-BQ and (c) TEMPO on the degradation of phenol in UPDP system (pH = 3.5) and (d) change in kinetic constants.
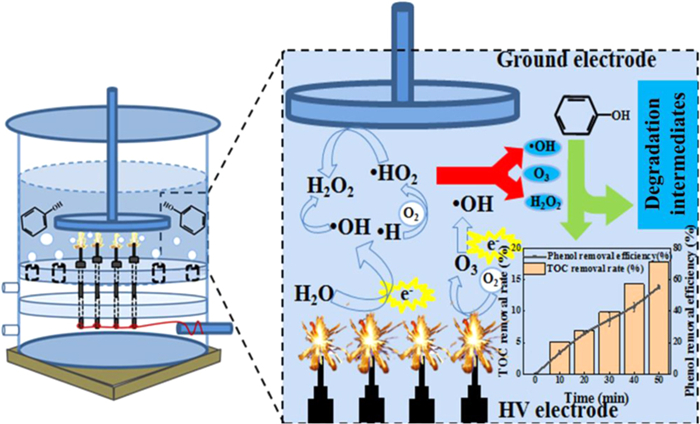
Figure 17 shows the degradation reactions of phenol in the UPDP system. A higher energy input to the system than for APDP is often required for the same discharge voltage. Due to the large number of high-energy electrons colliding directly with water molecules during the discharge, the highest level of ·OH is present in the solution. Apart from the role of ·OH, the decomposition reaction of O3 and H2O2 under acidic conditions is more favorable for the degradation of phenol. Under 22 kV, 50 Hz and 8 mm discharge distance, the TOC removals of APDP and UPDP systems are 13.5% and 17.8%, respectively.
Figure
17.
Schematic representation of the degradation mechanism of phenol in the UPDP system.
In this study, APDP and UPDP systems for the removal of phenol with different treatment parameters were compared. The degradation efficiency of phenol in both APDP and UPDP systems increases with increasing discharge voltage and with decreasing discharge distance. The degradation efficiency of phenol in the UPDP system is higher than that in the APDP system at the optimum discharge voltage and discharge distance. Variations in discharge voltage and discharge distance change the plasma discharge intensity and discharge pattern. In addition, high conductivity and high pH have a positive effect on phenol removal in the APDP system, but low conductivity and low pH conditions in the UPDP system are favorable for the degradation of phenol. From free radical quenching experiments, it is concluded that ·O2- has an important effect on the degradation of phenol in the APDP system, while ·OH plays a key role in the UPDP system. The comparison between APDP and UPDP systems can provide a reference for other researchers when selecting discharge reactors and discharge methods.
Acknowledgments
We gratefully acknowledge the financial support from National Natural Science Foundation of China (No. 51707093).

 DownLoad: