Figure
1.
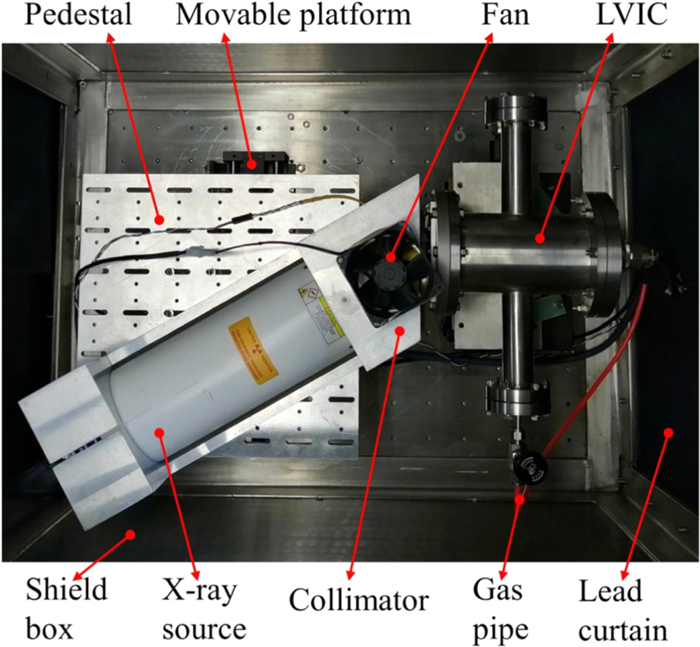
Setup of the X-ray source and LVIC.
| Citation: |
Chaozhi LI, Liqun HU, Jizong ZHANG, Kaiyun CHEN. Saturation characteristics of low voltage ionization chamber filled with argon or xenon[J]. Plasma Science and Technology, 2022, 24(6): 064009. DOI: 10.1088/2058-6272/ac6b8f

|
Argon and xenon are both attractive working gas for low voltage ionization chamber (LVIC), which is a promising candidate for ITER X-ray detectors. In this work, the performances of Ar-filling LVIC (Ar-LVIC) and Xe-filling LVIC (Xe-LVIC) as well as the impacts of operation parameters were investigated. Saturation curves of Ar-LVIC and Xe-LVIC with pressure from 0.4 to 1.2 bar were measured with a tungsten X-ray source. The minimum voltage of saturation region (
Measuring the intensity of X-rays from plasma is an important method to study various phenomena, such as magnetohydrodynamic (MHD) and impurity [1, 2]. A radial X-ray camera (RXC), expected to measure the poloidal profile of X-ray from plasma, is one of the basic diagnostics systems in ITER [3–5]. It consists of in-port and ex-port camera modules, which view the edge and central parts of plasma respectively. It is mainly used to study low (m, n) MHD modes, disruption precursors, sawteeth, edge localized modes, etc. It also plays a supplementary role in the investigation of impurity, runaway electrons, radiative power, plasma position, etc.
The harsh radiation environment in ITER is a serious challenge to RXC detectors [6]. It is significant to the research advanced detectors with high radiation hardness. As one of the promising candidates, besides radiation hardness, a low voltage ionization chamber (LVIC) has the following advantages: simple design and manufacturing, and the absence of high operating voltage. In addition, its amplifier can be placed far away from the detector [7, 8]. We have designed and manufactured a preliminary prototype of LVIC. Its main components are electrode assembly, a gas chamber with two gas channels for gas feeding and pumping, a simplified beryllium (Be) window and electrical feedthrough. More information about the LVIC prototype is introduced in [9, 10]. As the detection medium of LVIC, the type of gas and its pressure has significant impacts on the performance of LVIC. Noble gases, especially argon (Ar) and xenon (Xe) [11], are attractive candidates for their physical properties, like high stopping power, relatively low average ionization energy, etc [12].
In order to find an appropriate gas and pressure, the LVIC was filled with Ar and Xe and the impacts of operation parameters were investigated in a lab with an X-ray source. In section 2, the experimental setup is described. In section 3, the current–voltage curves of LVIC in the recombination and saturation regions (i.e. saturation curves) are shown. With these curves, the voltage needed for saturation, linearity between LVIC response and radiation intensity, ideal operating voltage and the impacts of pressure are studied. LVICs filled with Ar and Xe are compared in view of the application in ITER. The summary and outlook are given in the last section.
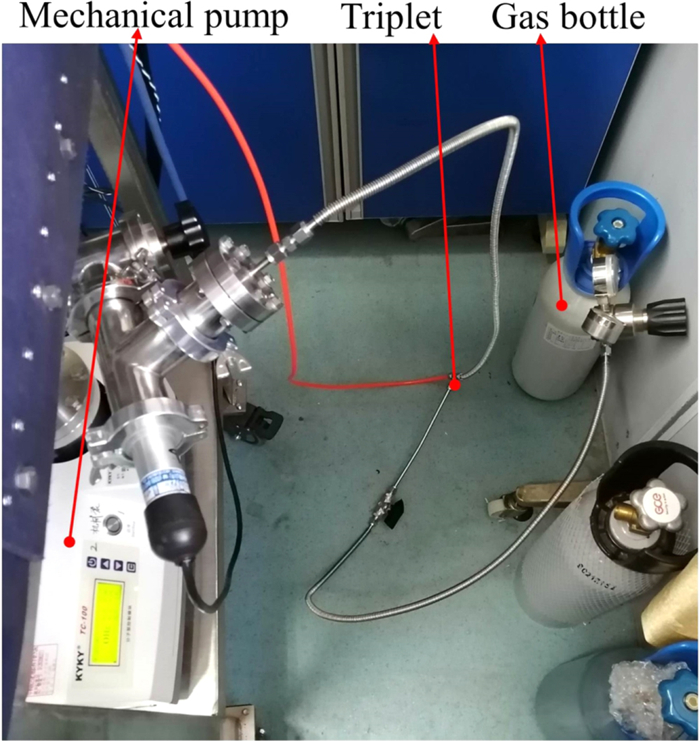
The LVIC and the radiation source were placed in a shield box, as shown in figure 1. This shield box, with a size of 60 cm × 60 cm × 80 cm, was made of stainless steel. The front and back sides of it were sheltered by lead curtains. The radiation source of the experiment was UltraBright 96000 Series 90 kV Microfocus X-ray Source of Oxford Instruments. Its target material was tungsten. The voltage of the X-ray source was from 20 to 90 kV, and its operation power range was 10‒80 W. The shape of emitted radiation of the X-ray source was a cone, whose top was the target. An aluminium pedestal was designed for fixing the X-ray source. After adjusting the angle of the X-ray source, the center line of the radiation cone was perpendicular to the active area of LVIC. The diameter of the collimator used in the experiment was the same as the interval of detector channels (10 mm). A fan was used for cooling the X-ray source whose ambient operating temperature was limited to between 10 ℃‒40 ℃. Gas equipment and electric instruments of the experiment were placed outside the shield box, as shown in figure 2. Through a gas pipe and a triplet, the LVIC was connected to a gas bottle and a mechanical pump, as shown in figure 3.
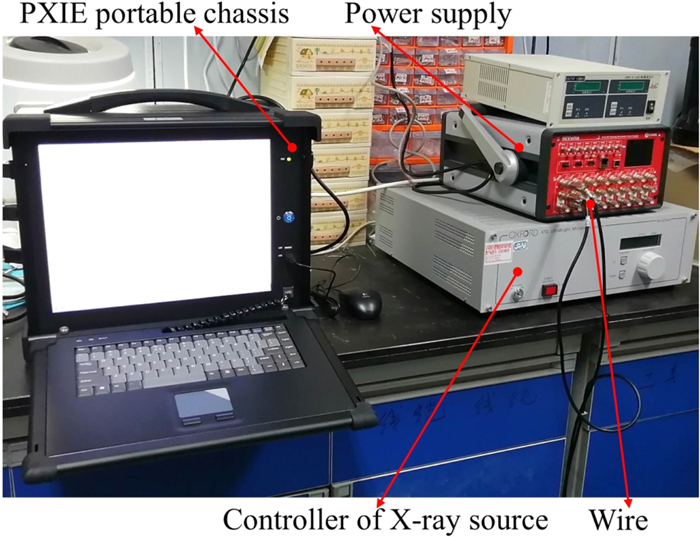
Wires for transmitting LVIC signal and feeding power were connected with the DAQ and the power supply respectively, as shown in figure 4. The DAQ was a PXIE portable chassis containing a pre-amplifier and a data acquisition card. Pre-amplifiers with a gain of 1 × 10⁶, 4 × 10⁶ and 1 × 10⁷ V A-1 were used depending on the signal amplitude. The maximum output voltage of all pre-amplifiers was 10 V. The adjustments of the X-ray source's voltage and power were realized with the controller.
In this experiment, saturation curves of LVIC filled with Ar and Xe were measured. In future ITER, the inner pressure of LVIC will be around 1 bar or smaller to avoid damaging the Be window. So, the inner pressure was 0.4‒1.2 bar in the experiment. The sampling rate of the DAQ was 10 kHz. Because of the similarity between different channels, without loss of generality, we only discussed the experimental results of one of the LVIC channels here. The voltage of the X-ray source was fixed at 50 kV, and its power was 10‒80 W.
At a constant X-ray source power, the currents of LVIC at different voltages were measured to draw the saturation curve. The values of the current are similar to that of ITER X-ray camera [11]. The output signal of LVIC at each voltage was recorded for several seconds, and its average value was a point of saturation curves. On occasion, there was an external disturbance in the output signal of LVIC during the measurement. Based on the oscillation amplitude of the current signal, the double standard deviation of the current signal was set as the error bar of the point.
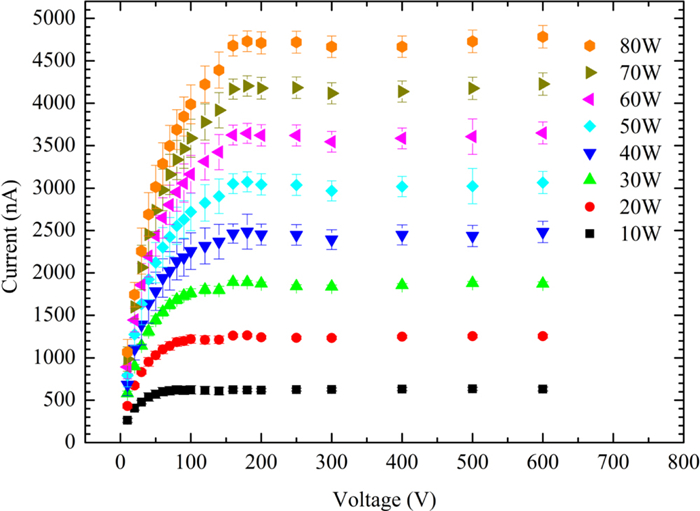
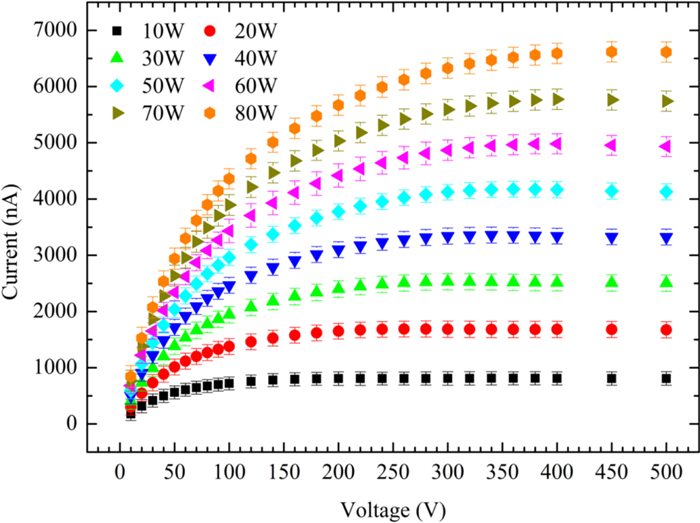
Figure 5 shows saturation curves, corresponding to different X-ray source powers, of LVIC filled with Ar (Ar-LVIC). One common feature of all curves was that, in the low voltage range, the current of LVIC increased with voltage, and as the voltage was beyond a threshold value, the current saturated. This threshold, noted as
According to figure 5, the average value of currents in 200–600 V was chosen as the saturation current of a curve. With it, CCEs at different voltages were obtained. A minimum voltage interval whose CCE ranged from below 95% to above,
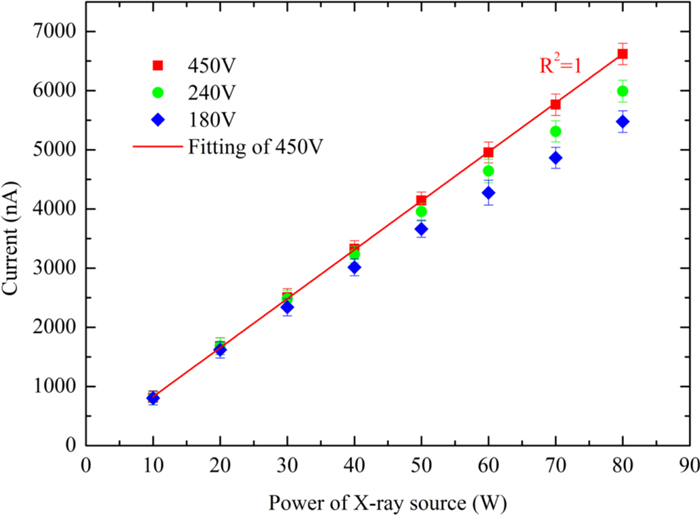
In actual application, the operating voltage of LVIC is usually constant, but the intensity of radiation is variable. Good linearity between the output current of LVIC and power of radiation is important in estimating radiation intensity. According to the principle of the ionization chamber, this linearity can be kept when charges created are fully collected. In view of the application, it requires that the operating voltage of LVIC is beyond
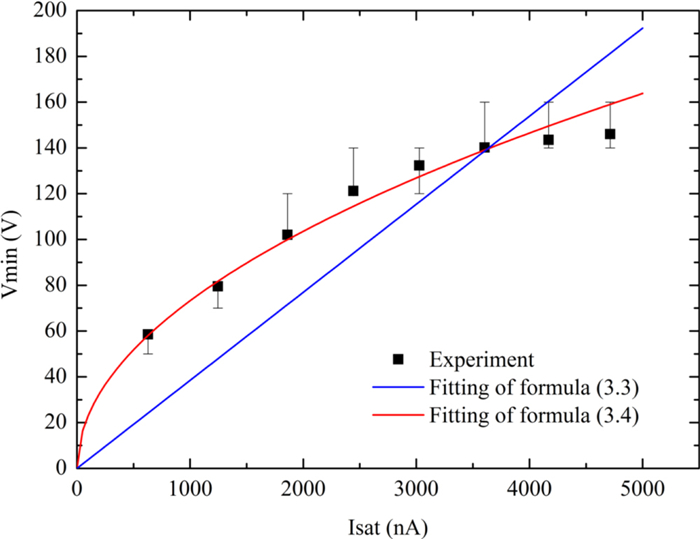
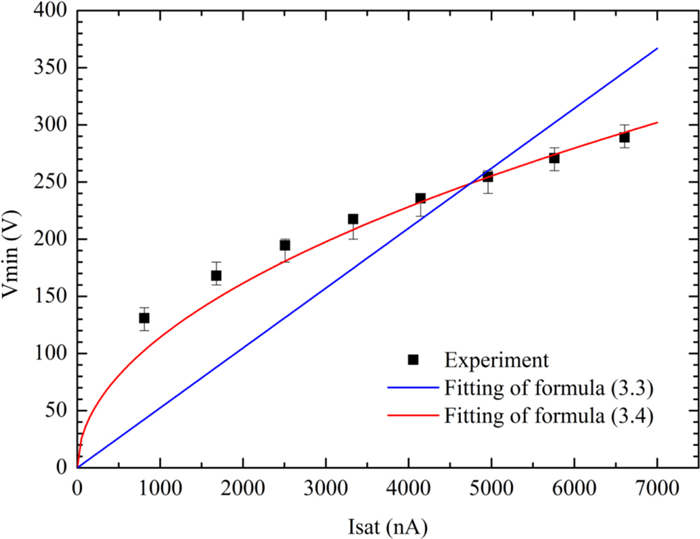
Vmin is the voltage needed for eliminating recombination loss. There are two types of recombination processes: initial (columnar) recombination and general (volume) recombination [15, 16]. The former is the recombination of positive and negative particles formed in the same track of an ionizing particle. It is independent of the intensity of radiation [17]. General recombination occurs when positive and negative particles produced by different ionization particles meet. It is a positive correlation with the intensity of radiation. If initial recombination is the primary recombination, when the current is close to the saturation current (
| 1I=1Isat+C1V | (1) |
| 1I=1Isat+C2V2 | (2) |
| Vmin=19C1Isat | (3) |
and
| Vmin=(19C2Isat)1/2. | (4) |
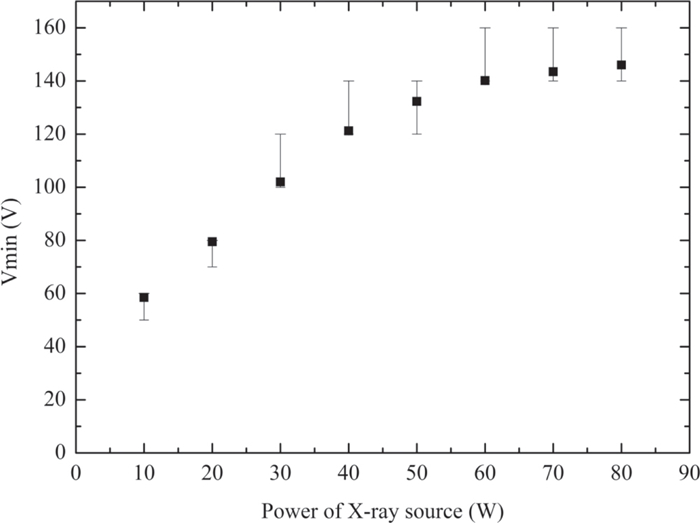
The experimental
According to the simulation of the LVIC in the high power operation phase of ITER [11], the output current of Ar-LVIC for the external and internal cameras might reach 1‒2 μA and 3 μA, respectively. To make sure the output current is proportional to the radiation power, the detector will work in the saturation range. As shown in figure 8, it was speculated that the ideal operating voltage of Ar-LVIC was 140‒150 V.
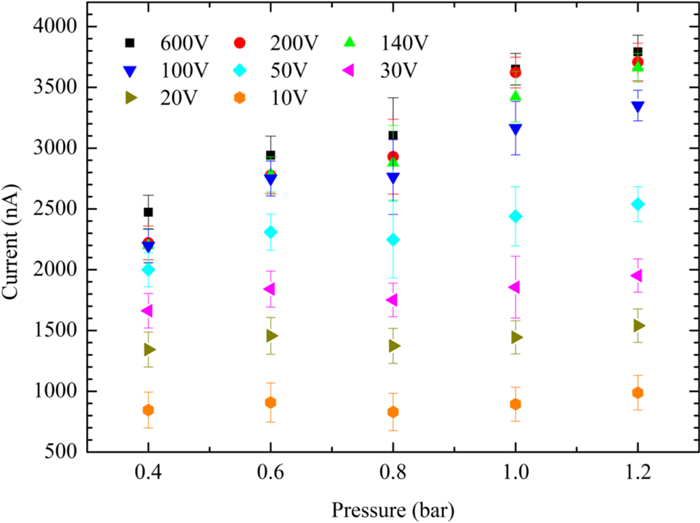
Gas pressure is proportional to the number of gas particles in unit volume at a certain temperature. This affects radiation energy deposited in gas, and the transport of charges. So, an appropriate pressure is important for the performance of LVIC. In addition, decreasing pressure is regarded as a method to protect the Be window and to reduce neutron/gamma induced noise during the nuclear operation phase of ITER.
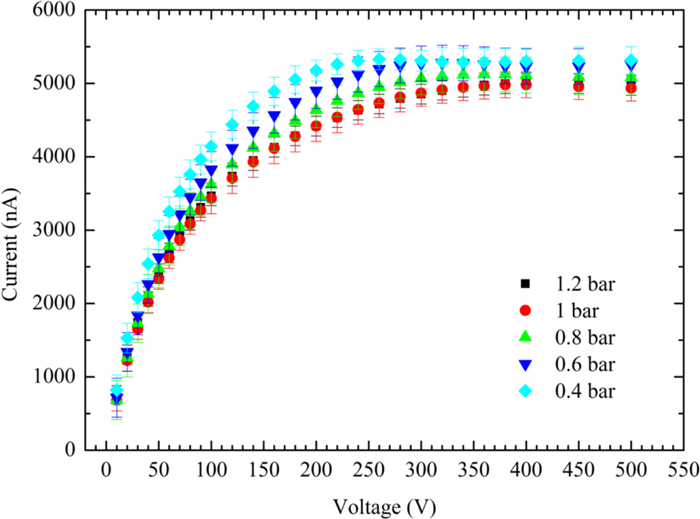
As seen from figure 9, in 300‒600 V, when pressure was 1.2 bar or 1 bar, the output current of LVIC was stable. However, when pressure was 0.4 bar, 0.6 bar or 0.8 bar, there was a rise in current with voltage. Compared with similar research at low pressure [18], the rise of current might be due to gas multiplication. Over wide ranges of electric field E and pressure P, drift velocities of electron and ion were positive correlation to E/P [19]. At a constant E, charges had larger velocities at low pressure, which meant higher energy to cause gas multiplication.
The maximum voltage of saturation, noted as
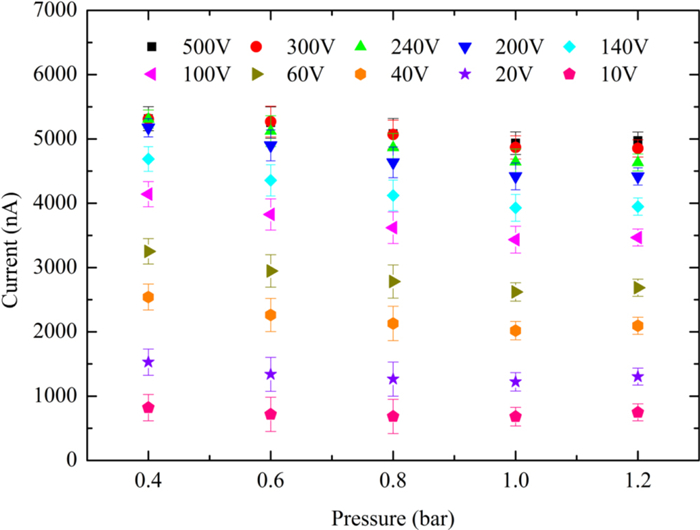
Figure 10 shows the impact of gas pressure on the output current of LVIC at a constant radiation power (60 W). It could be found that when voltage was beyond 100 V, the current of the LVIC obviously decreased with the drop in pressure. However, this trend faded with the decrease of voltage. This might be because at low voltage and relatively high pressure, most of the charges created by radiation were recombined in the process of collection. Comparatively, although the number of charges created at low pressure was less than that of high pressure, a higher proportion of charges might be collected due to sparse background particles. Thus, the current of LVIC at low pressure was close to that at high pressure. These results showed that the pressure effect on decreasing LVIC's current was related to its working voltage. Low pressure might not necessarily decrease the output current of LVIC.
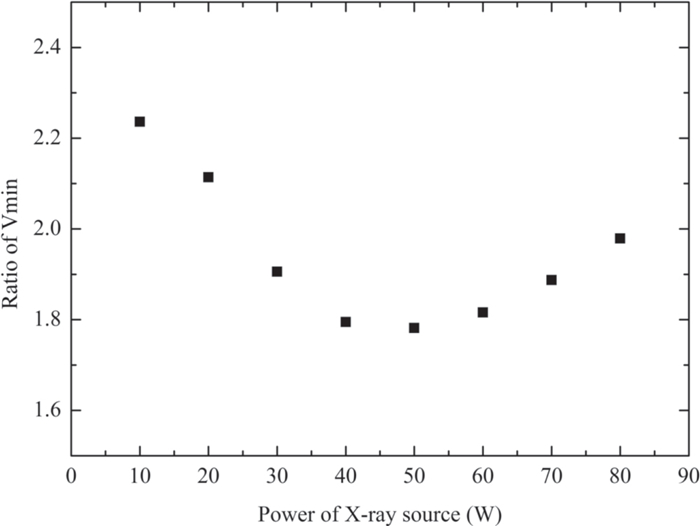
As seen from figure 11, there are mainly two differences between Xe-filling LVIC (Xe-LVIC) and Ar-LVIC. The first difference is that the saturation current of the former was larger. This is due to the fact that Xe has a larger atomic number. This causes more energy to be deposited in Xe, especially for high-energy radiation. In addition, the mean ionization energy of Xe (21.9 eV) is smaller than that of Ar (26.2 eV) [21]. So, in the same radiation, more charges will be created in Xe-LVIC. The second difference is that Xe-LVIC was larger than that of Ar-LVIC, as shown in figure 12. The former was 1.78–2.24 times the latter, as shown in figure 13. This means that facing the same radiation of the X-ray source, Xe-LVIC needed a larger voltage for fully collecting the charges created. According to related research [13, 22],
Comparing figures 7 and 14, the linear relationship between the output current of Xe-LVIC and the power of the X-ray source was similar to that of Ar-LVIC. Keeping this linearity requires that the operating voltage is beyond
The experimental
In the high power operation phase of ITER, the output current of Xe-LVIC for the external and internal cameras might reach 4 μA and 5–6 μA, respectively. In order to reach the saturation region, the operating voltage of Xe-LVIC in the external camera would be 230–240 V. Xe-LVIC in the internal camera might work at 280‒290 V.
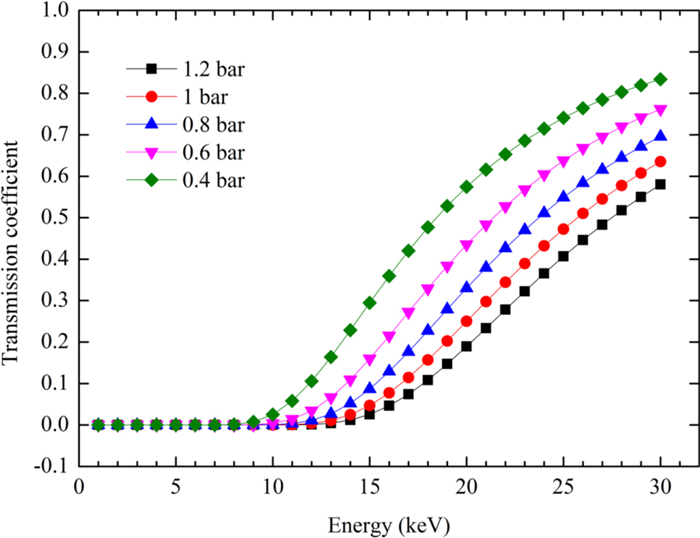
As seen in figure 16, saturation currents of Xe-LVIC did not decrease with the drop in pressure. Figure 17 shows the output current of Xe-LVIC at different pressures. It can be found that saturation currents at different pressures were close to each other. Comparing the curves at 1.2 bar and 0.4 bar, the former was larger than the latter. The reason might be that at the highest pressure there are the densest particles. More charges are recombined in the process of collection. The high atomic number of Xe might be the reason the saturation current of Xe-LVIC did not decrease with the drop in pressure. Due to its high atomic number, Xe has a high enough absorption coefficient of high energy X-ray. Figure 18 shows that even at 0.4 bar, most of the radiation whose energy is lower than 10 keV will be absorbed [25]. When the voltage of the X-ray source is 50 kV, the peak of the tungsten spectrum is around 9 keV. So, decreasing pressure will not obviously decrease the number of charges created by radiation, which means that the saturation current will not decrease.
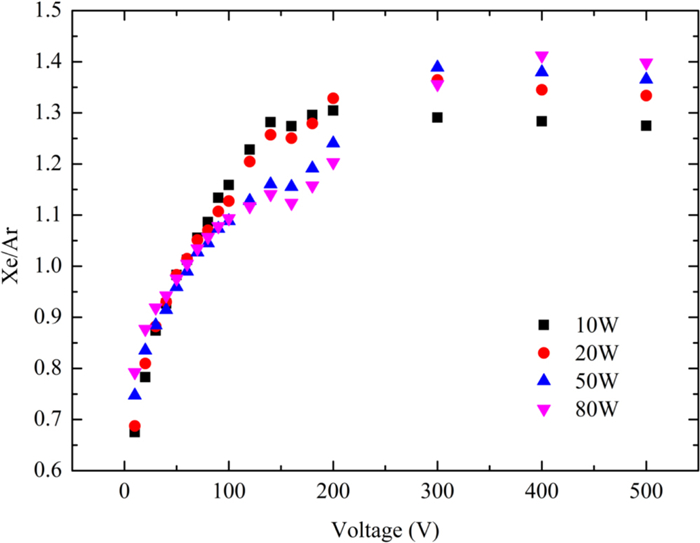
As seen from figure 19, the ratios of current of Xe-LVIC and Ar-LVIC had a similar trend and value at different radiation powers. When voltage was less than 60 V, the current of Ar-LVIC was larger than that of Xe-LVIC. It may be due to smaller
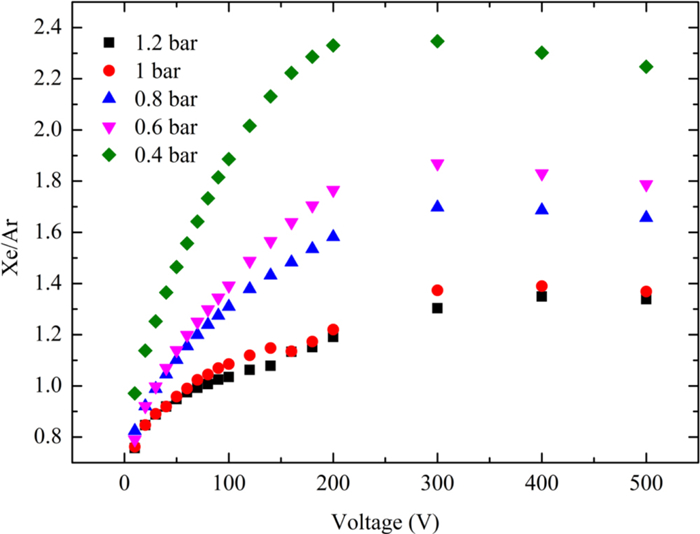
Figure 20 shows that at constant radiation power (60 W), the ratio of current of Xe-LVIC and Ar-LVIC increased with the drop in pressure. At 0.4 bar, the saturation current of Xe-LVIC was more than twice that of Ar-LVIC. This means that the advantage of Xe-LVIC in response is more obvious at low pressure. Decreasing pressure will not cause an obvious drop in absorption efficiency of Xe-LVIC below 10 keV. However, its sensitivity at higher energy will decrease. It is good to decrease background noise caused by neutron/gamma ray. So, Xe-LVIC with an appropriate pressure may be a high signal-to-noise ratio detector. Low-pressure Xe-LVIC is worthy to be further studied in future research.
Working gas in the gas chamber is the detection medium of LVIC. Its physical properties will affect the performance and working conditions of LVIC. The research on gas and its pressure effect is important for LVIC. Argon and xenon are the most promising choices. The saturation characteristics of LVIC and pressure effect are studied by measuring saturation curves of Ar-filling LVIC (Ar-LVIC) and Xe-filling LVIC (Xe-LVIC). Conclusions can be drawn in the present research as follows:
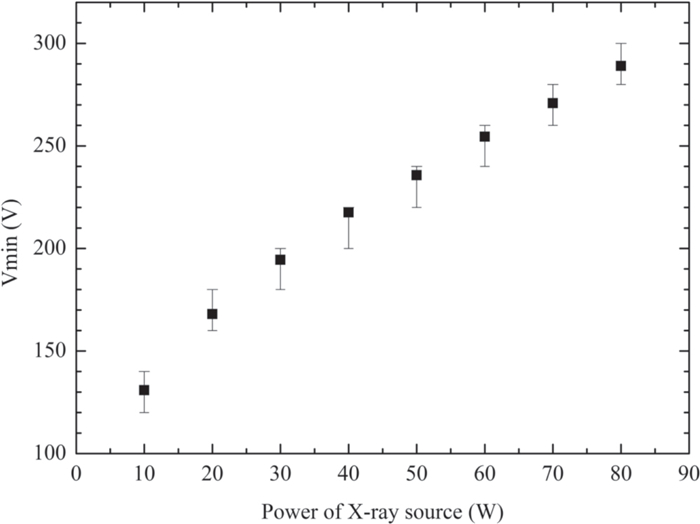
(1) When the inner pressure was 1 bar and the power of the X-ray source was 10‒80 W, the minimum voltage for saturation (
(2) In order to keep good linearity between the output current of LVIC and radiation power, the operating voltage of LVIC should be larger than
(3) The relationship between
(4) In future ITER, the operating voltage of Ar-LVIC might be 140–150 V. Xe-LVIC for the external and internal cameras might work at 230–240 V and 280–290 V, respectively.
(5) The decrease of pressure from 1.2 to 0.4 bar caused the decrease of saturation current of Ar-LVIC, but not Xe-LVIC.
In future ITER, LVIC will be used in the internal camera of RXC, and might also be detectors for the external camera in the nuclear phase. Due to the similarity between the spectrum of tungsten target X-ray source working at 50 kV and that of plasma at a temperature of 10.7 keV [7], and the similarity of LVIC output current with X-ray source to that of ITER, the experimental results of this paper can be a reference of LVIC working in ITER tokamak. Compared with Xe-LVIC, Ar-LVIC can work at a lower voltage. Decreasing pressure will reduce the saturation current of Ar-LVIC. Xe-LVIC has higher sensitivity, and a larger output current which is good for measuring weak X-ray radiation. By appropriately decreasing pressure, the sensitivity of Xe-LVIC at low energy range will not drop, but the neutron/gamma induced noise might reduce. In the non-nuclear phase of ITER operation, the intensity of plasma radiation is lower than that of the nuclear operation phase, so Xe-LVIC can be used because it has a larger saturation current and can work in low pressure for avoiding damage to Be windows. Neutron/gamma induced noise will not be the problem. In the nuclear phase, the working gas of LVIC can be changed to Ar to decrease neutron/gamma induced noise. Meanwhile, the saturation current of Ar-LVIC is smaller and will decrease with the drop in pressure. These characters can help to avoid the saturation of pre-amplifiers.
ITER is a Nuclear Facility INB-174. The views and opinions expressed herein do not necessarily reflect those of the ITER Organization. This work was supported by National Natural Science Foundation of China (No. 11605243).
| [1] |
Snider R T, Evanko R and Haskovec J 1988 Rev. Sci. Instrum. 59 1807 doi: 10.1063/1.1140119
|
| [2] |
Mlynar J et al 2016 J. Phys. Conf. Ser. 768 012001 doi: 10.1088/1742-6596/768/1/012001
|
| [3] |
Hu L et al 2016 Fusion Sci. Technol. 70 112 doi: 10.13182/FST15-137
|
| [4] |
Hu L et al 2017 Nucl. Instrum. Meth. Phys. Res. Sect. A 870 50 doi: 10.1016/j.nima.2017.07.021
|
| [5] |
Chen K Y et al 2021 Fusion Eng. Des. 165 112234 doi: 10.1016/j.fusengdes.2021.112234
|
| [6] |
Niu L Y et al 2019 Plasma Sci. Technol. 21 025601 doi: 10.1088/2058-6272/aaeba5
|
| [7] |
Gott Y V and Stepanenko M M 2009 Instrum. Exp. Tech. 52 260 doi: 10.1134/S0020441209020250
|
| [8] |
Gott Y V and Stepanenko M M 2010 Instrum. Exp. Tech. 53 180 doi: 10.1134/S0020441210020053
|
| [9] |
Zhang J Z et al 2020 Multi-Channel Low-Voltage Ionization Chamber Gas Detector (Hefei: Hefei Institutes of Physical Science, Chinese Academy of Sciences) CN110764129-A
|
| [10] |
Li C Z et al 2021 Nucl. Instrum. Meth. Phys. Res. Sect. A 1003 165324 doi: 10.1016/j.nima.2021.165324
|
| [11] |
Colette D et al 2020 Rev. Sci. Instrum. 91 073504 doi: 10.1063/1.5142909
|
| [12] |
Aprile E et al 2006 Noble Gas Detectors (Weinheim: Wiley)
|
| [13] |
Chabod S P 2008 Nucl. Instrum. Meth. Phys. Res. Sect. A 595 419 doi: 10.1016/j.nima.2008.07.115
|
| [14] |
Fallone B G and Podgorsak E B 1983 Med. Phys. 10 191 doi: 10.1118/1.595292
|
| [15] |
Scott P B and Greening J R 1963 Phys. Med. Biol. 8 51 doi: 10.1088/0031-9155/8/1/304
|
| [16] |
Bohm J 1976 Phys. Med. Biol. 21 754 doi: 10.1088/0031-9155/21/5/004
|
| [17] |
Park S H et al 2005 Radiat. Phys. Chem. 73 248 doi: 10.1016/j.radphyschem.2005.01.005
|
| [18] |
Varma M N and Baum J W 1975 Health Phys. 29 399 doi: 10.1097/00004032-197509000-00006
|
| [19] |
Knoll G F 2010 Radiation Detection and MeasurementHoboken, NJWiley
|
| [20] |
Chabod S P et al 2010 IEEE Trans. Nucl. Sci. 57 2702 doi: 10.1109/TNS.2010.2053558
|
| [21] |
Wu Z H et al 1997 Experimental Methods of Atomic Nuclear Physics 3rd edn (Beijing: Atomic Energy Press)(in Chinese)
|
| [22] |
Chabod S P 2009 Nucl. Instrum. Meth. Phys. Res. Sect. A 602 574 doi: 10.1016/j.nima.2009.01.018
|
| [23] |
Biondi M A and Chanin L M 1954 Phys. Rev. 94 910 doi: 10.1103/PhysRev.94.910
|
| [24] |
Bowe J C 1964 Phys. Rev. 134 A355 doi: 10.1103/PhysRev.134.A355
|
| [25] |
Henke B L, Gullikson E M and Davis J C 1993 At. Data Nucl. Data Tables 54 181 doi: 10.1006/adnd.1993.1013
|
| [1] | WANG Cheng (王城), CHEN Tang (陈瑭), LI Wanwan (李皖皖), ZHA Jun (査俊), XIA Weidong (夏维东). Axial Magnetic Field Effects on Xenon Short-Arc Lamps[J]. Plasma Science and Technology, 2014, 16(12): 1096-1099. DOI: 10.1088/1009-0630/16/12/03 |
| [2] | YANG Ning(杨拧), ZHANG Ming(张明), LI Chuan(李传), SONG Zhiquan(宋执权), YU Kexun(于克训), ZHUANG Ge(庄革), XU Tao(徐涛). Preliminary Design and Analysis of the DC Reactor for the ITER Converter[J]. Plasma Science and Technology, 2014, 16(3): 273-277. DOI: 10.1088/1009-0630/16/3/18 |
| [3] | YUAN Guoliang(袁国梁), YANG Qingwei(杨青巍), YANG Jinwei(杨进蔚), SONG Xianying(宋先瑛), LI Xu(李旭), WU Huajian(吴华剑), WANG Zhiqiang(王志强). Fusion Neutron Flux Detector for the ITER[J]. Plasma Science and Technology, 2014, 16(2): 168-171. DOI: 10.1088/1009-0630/16/2/14 |
| [4] | LEI Mingzhun (雷明准), SONG Yuntao (宋云涛), WANG Songke (王松可), WANG Xianwei (汪献伟). Electromagnetic and Stress Analyses of the ITER Equatorial Thermal Shield[J]. Plasma Science and Technology, 2013, 15(8): 830-833. DOI: 10.1088/1009-0630/15/8/22 |
| [5] | YANG Yu (杨愚), S. MARUYAMA, G. KISS, LI Wei (李伟), JIANG Tao (江涛), LI Bo (李波). Conceptual Design of the ITER Gas Injection System[J]. Plasma Science and Technology, 2013, 15(3): 287-290. DOI: 10.1088/1009-0630/15/3/19 |
| [6] | ZHENG Jinxing (郑金星), SONG Yuntao (宋云涛), HUANG Xiongyi (黄雄一), LU Kun (陆坤), XI Weibin (奚维斌), DING Kaizhon (丁开忠), YE Bin (叶斌), NIU Erwu (牛二武). Experimental Study on Paschen Tests of ITER Current Lead Insulation[J]. Plasma Science and Technology, 2013, 15(2): 152-156. DOI: 10.1088/1009-0630/15/2/15 |
| [7] | P Klaywittaphat, T Onjun. Scaling of the density peak with pellet injection in ITER[J]. Plasma Science and Technology, 2012, 14(12): 1035-1040. DOI: 10.1088/1009-0630/14/12/01 |
| [8] | WANG Haitian (王海田), LI Ge (李格). Analysis and Design of ITER 1MV Core Snubber[J]. Plasma Science and Technology, 2012, 14(11): 1017-1023. DOI: 10.1088/1009-0630/14/11/11 |
| [9] | LEI Mingzhun(Lei-Meng-Zhun-), SONG Yuntao (Song-Yun-Chao-), LIU Sumei(Liu-Su-Mei-), LU Kun(Liu-Kun-), WANG Zhongwei (Wang-Zhong-Wei-). Primary Design and Analysis of Feeder for ITER Poloidal Field[J]. Plasma Science and Technology, 2011, 13(5): 623-626. |
| [10] | KANG Weishan(康伟山), CHEN Jiming(谌继明), WU Jihong(吴继红). Analysis and Optimization of Cooling Channels in ITER Blanket Module[J]. Plasma Science and Technology, 2010, 12(5): 628-631. |
| 1. | Chen, J.K., Jiang, X.C., Ma, H.J. et al. Numerical investigation of electron cyclotron and electron Bernstein wave current drive in EXL-50U spherical torus.. Fusion Engineering and Design, 2025. DOI:10.1016/j.fusengdes.2025.114800 | |
| 2. | Zhang, L.-Y., Wang, X.-J., Wu, D.-J. et al. Preliminary structure design and analysis of CFETR ECRH system launcher | [CFETR ECRH 系统发射天线的初步结构设计与分析]. Hejubian Yu Dengliziti Wuli/Nuclear Fusion and Plasma Physics, 2024, 44(3): 267-274. DOI:10.16568/j.0254-6086.202403004 | |
| 3. | Chao, Z., Wang, X., Wu, D. et al. Quasi-optical design and analysis of a remote steering launcher for CFETR ECRH system. Nuclear Engineering and Technology, 2024, 56(5): 1619-1626. DOI:10.1016/j.net.2023.12.014 |
Supported by: Beijing Renhe Information Technology Co., Ltd. 
 DownLoad: