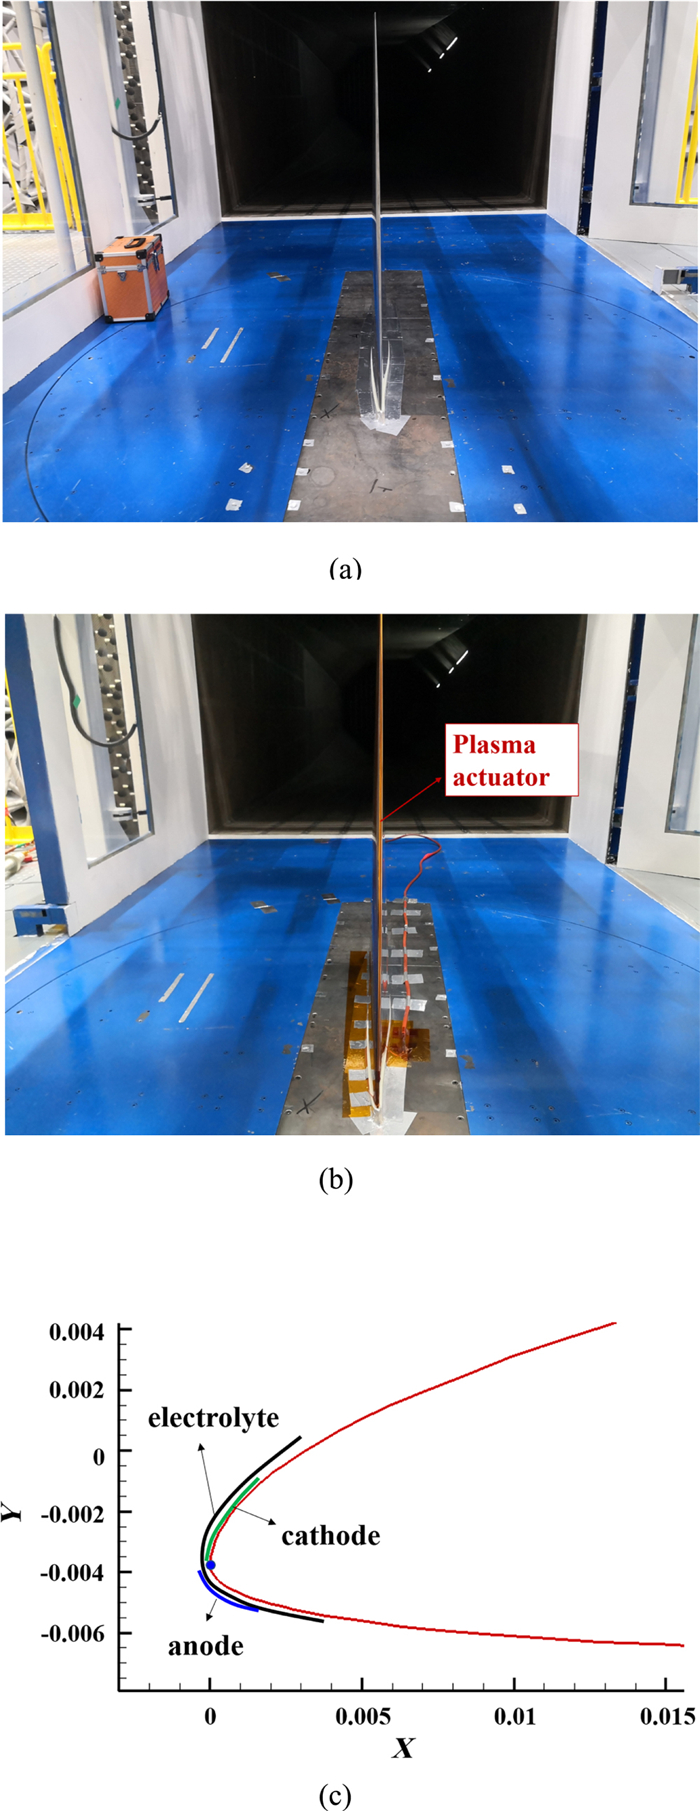
Figure
1.
Experimental model (a), plane size (b), and five cross sections (c).
| Citation: |
Bei LIU, Hua LIANG, Borui ZHENG. Investigation of the interaction between NS-DBD plasma-induced vortexes and separated flow over a swept wing[J]. Plasma Science and Technology, 2023, 25(1): 015503. DOI: 10.1088/2058-6272/ac7cb8

|
The effect of nanosecond pulsed dielectric barrier discharge (NS-DBD) plasma flow separation control is closely related to the actuation frequency, because it involves the interaction between plasma-induced vortexes and separated flow. In order to study the mechanism of NS-DBD plasma flow separation control over a swept wing, especially the influence of the actuation frequency, at first, experimental studies of the actuation frequencies at 100 Hz are conducted to validate the numerical simulation method. Then, numerical studies of different actuation frequencies which are 50 Hz, 100 Hz, 160 Hz, 200 Hz, 500 Hz, and 1000 Hz, respectively are conducted. The interaction between the plasma-induced vortexes and the separated flow is analyzed. Results show that there is a range of the actuation frequency which includes the frequency (160 Hz) calculated by the average aerodynamic chord length to make the control effect good, but when the actuation frequencies are too low (50 Hz) or too high (1000 Hz), the control effect will get worse. The former is because plasma-induced vortexes disappear in a period within an actuation cycle; the latter is because plasma-induced vortexes cannot develop completely, resulting in a weak vortex intensity.
Nanosecond pulsed dielectric barrier discharge (NS-DBD) and alternative current dielectric barrier discharge (AC-DBD) are two main plasma flow separation control methods. Because of the higher actuation frequency and intensity of NS-DBD in contrast with AC-DBD, the control effect of NS-DBD is better than that of AC-DBD [1, 2]. Studies show that when the flow Mach number is 0.4, AC-DBD almost has no control effect [3] while even though the flow Mach number reaches 0.74, NS-DBD also has a good control effect on flow separation [4]. NS-DBD is even used to control the strong shock wave ahead of a circular cylinder in which the flow Mach number is 5 [5].
The mechanism of AC-DBD plasma actuation for flow control is momentum effects due to ionic wind created by the discharge, which can accelerate the flow in the boundary layer. Therefore, the ability of the flow to resist adverse pressure gradient becomes stronger. Experimental studies show that the ionic wind can only reach to several meters per second (less than 10 m s-1) discharging in quiescent air [6], so the control effect of AC-DBD is limited. Whereas, the mechanism of NS-DBD plasma actuation for flow control is transient heat effects which induce shock waves and starting vortexes that interact with the separated flow [7, 8], resulting in the flow separation being controlled. Experimental studies show that the induced flow velocity of NS-DBD is less than 1 m s-1 [9].
For both AC-DBD and NS-DBD, the effects on flow separation control are closely related to the actuation frequency. Audier et al studied a post-stall flow over NACA0012 airfoil by AC-DBD experimentally [10]. Results show that the higher the actuation frequency, the better the control effect, and the closer to the control effect of steady actuation. Abdollahzadeh et al validated the conclusion by a numerical study which is also about the flow separation control of NACA0012 airfoil by AC-DBD [11]. Sidorenko et al studied the control effect of NS-DBD on an airfoil by experimental method. Results show that the optimum actuation frequency depends on the angle of attack and flow velocity [12]. Niu et al conducted an experimental study on flow separation control of a flying wing by NS-DBD when the Re number is 2.61 × 10⁶ and Mach number is 0.2. Results show that the actuation frequency of 100 Hz is better than those of 200 and 300 Hz [13].
Obviously, for the flow separation control of NS-DBD, it is not the case that the higher the actuation frequency, the better the control effect. The actuation frequency is generally dimensionless as follows:
| F+=fc/U∞, | (1) |
where
There is an optimum actuation frequency for NS-DBD plasma flow control, but the control mechanism is still not clear, especially for a swept wing (there is no definite reference length). The mechanism of NS-DBD plasma flow control is mainly about the interaction between plasma-induced vortexes and separated flow, but the interaction process is also not clear. In this study, in order to investigate the interaction mechanism, large eddy simulation (LES) method is adopted to simulate the flow over a swept wing. Owning to the higher accuracy than Reynolds Averaged Navier–Stokes and less computation than direct numerical simulation (DNS), LES method has been extensively used in the flow simulation with large separation [15–17]. Although the computation of delayed detached eddy simulation (DDES) is less than LES, considering more turbulence dissipation which could affect the investigation of the vortex interaction, the DDES method is not adopted.
The rest of this article is organized as follows: section 2 is the experimental study of plasma flow separation control; section 3 validates the LES method according to the experimental data; section 4 shows the numerical study of plasma flow separation control; section 5 is for conclusions.
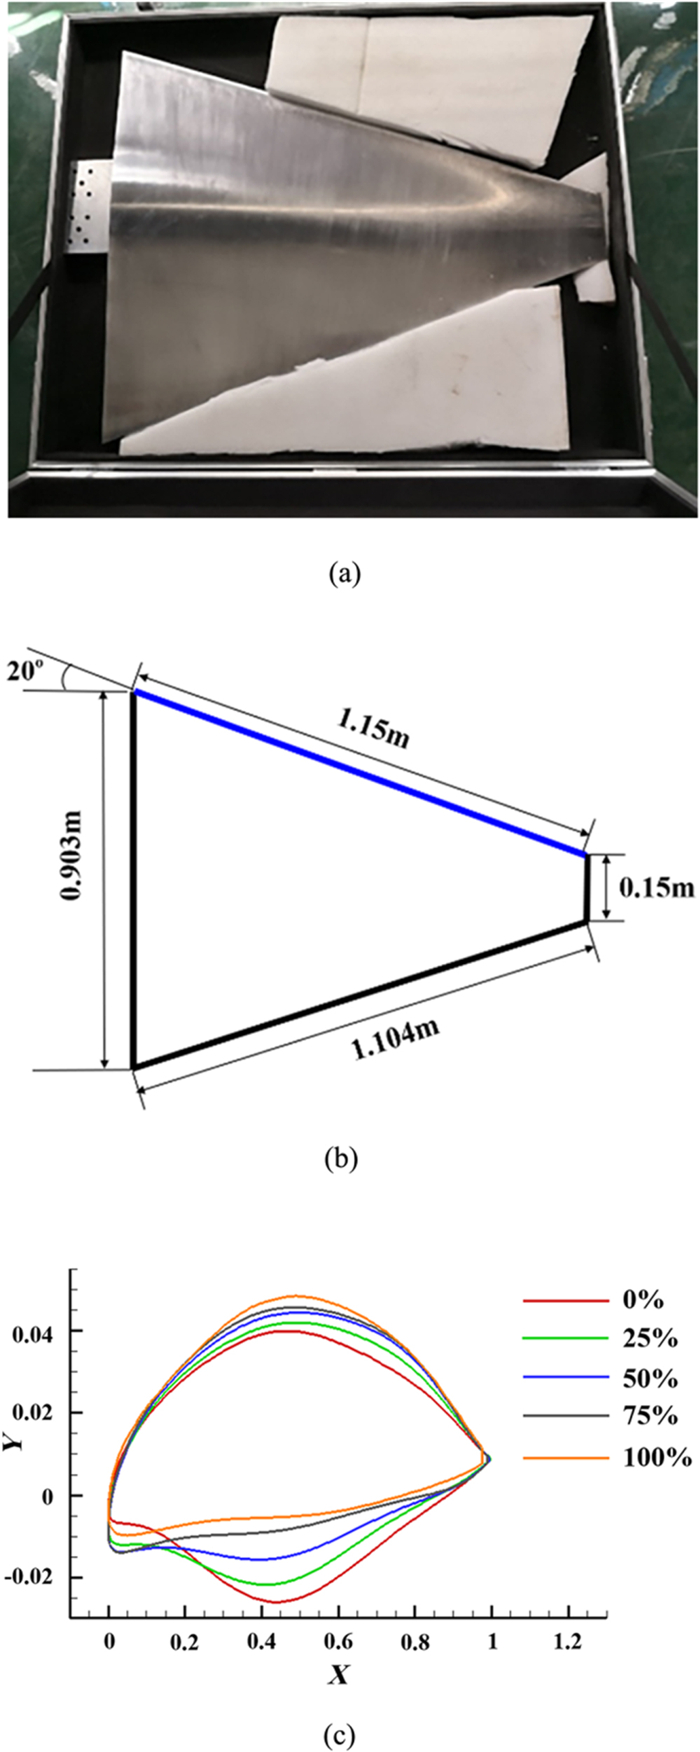
The experimental model is made of aluminum alloy and the surface is very smooth, see figure 1(a). The plane size is shown in figure 1(b). The sweep angle is 20 degree and the lengths of wing root, wing tip, leading edge, and tailing edge are 0.903 m, 0.15 m, 1.15 m, and 1.104 m, respectively. The length of average aerodynamic chord length is 0.527 m. The relative thickness from the wing root section to the wing tip section varies uniformly from 6.8% to 5.6%. The five cross sections which are at 0%, 25%, 50%, 75%, 100% spanwise positions respectively are shown in figure 1(c).
The experiment is conducted in a low-speed acoustic wind tunnel in which there is a
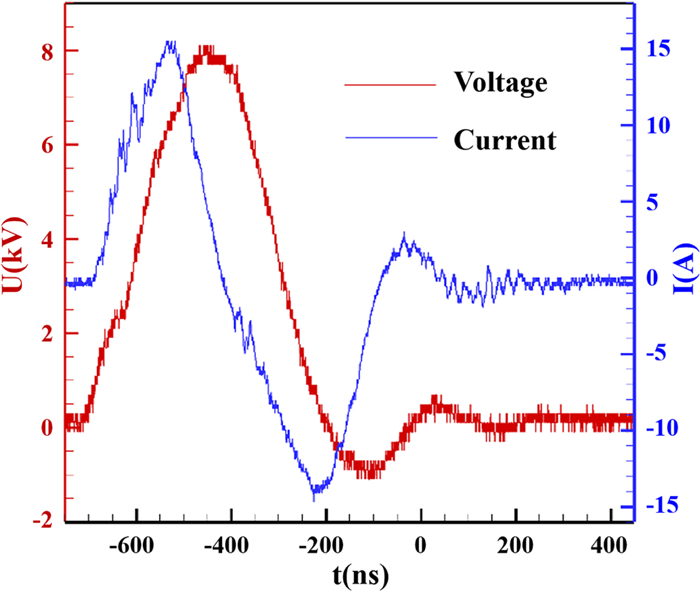
In the experiment, high voltage pulses are generated by a nanosecond pulse generator (HVP-20), the applied voltage and the discharge current are measured by a voltage probe (Tektronix P6015A) and a current probe (Tektronix TCP312 + TCPA300), respectively and the signals are recorded on an oscilloscope (Tektronix DPO4104). A single pulse waveform which is used in this experiment is shown in figure 3. The applied voltage is 8 kV and the full width half maximum is 300 ns. The experimental velocity is 85 m s-1 (0.25 Mach), the pressure is 1 atm, the temperature is 290 K and the turbulent intensity at the wing tunnel inlet is 0.16%. The Reynold number is calculated based on unit length (1 m). According to the principle that the optimal actuation frequency meets
| E=∑UI∆t. | (2) |
The length of the actuator is 1.15 m, so the energy per unit length of the pulse is 0.688 mJ cm-1 which is within the scope given by Takashima et al [8]. If the actuation frequency is 100 Hz, the output power will be 7.908 W; if the actuation frequency is 1000 Hz, the output power will be 79.08 W.
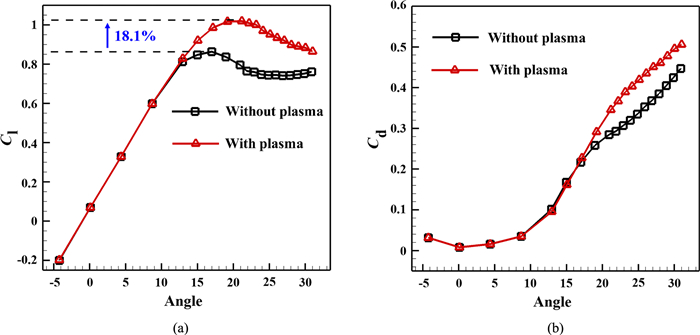
The experimental results are shown in figure 4. When the actuation voltage is 8 kV and the actuation frequency is 100 Hz, the maximum lift coefficient with the plasma actuation is 18.1% larger than that without the plasma actuation, and the stall angle of attack was delayed by 4°–5°. It indicates that NS-DBD has a good effect on control flow separation.
Spatial resolution, temporal resolution and sub-grid model are the three critical factors that must be considered in the usage of LES [19]. For the spatial resolution, as the computational mesh is successively refined, increasingly fine-scale turbulent structures are resolved, the computation eventually transitions to a DNS. For the temporal resolution, the time-step size needs to be able to describe the important physical phenomena. Obviously, smaller time steps are more desirable from an accuracy point of view, but also increase the resources required for the simulation. For the sub-grid model, the finest-scale fluid structures are not resolved in LES but equivalent by the sub-grid model and different sub-grid models have different schemes and different accuracy. In the simulation, central difference scheme is adopted and SIMPLEC method is used for pressure–velocity coupling. The time step can be dimensionless as follows:
| dt=∆tU∞/c. | (3) |
| Cl | Cd | |||
| Experiment | 0.812 | 0.225 | ||
| Coarse grid + WALE | 0.884 | 0.246 | 8.87% | 9.33% |
| Fine grid + WALE | 0.836 | 0.232 | 2.96% | 3.11% |
| Coarse grid + WMLES | 0.864 | 0.242 | 6.40% | 7.56% |
| Fine grid + WMLES | 0.856 | 0.238 | 5.42% | 5.78% |
 DownLoad:
CSV
DownLoad:
CSV
Figure 5 shows the vortex structures of the four simulation conditions when the time is at 0.6 s. It is obvious that the finer the grid is, the finer scale vortex structures can be caught and WALE model can catch finer scale vertex structures than WMLES model when the grid is same. So, the fine gird and WALE model are selected to conduct the numerical studies.
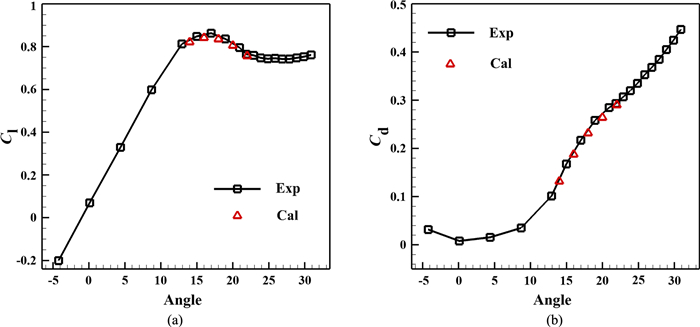
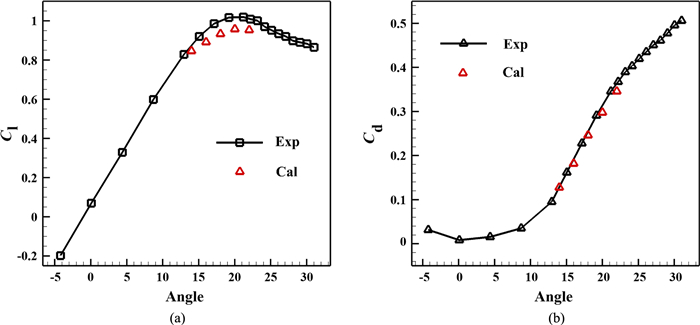
The scheme of 'Fine grid + WALE' is adopted to simulate other angles of attack states which are 14°, 16°, 20°, and 22°. The contrast of aerodynamic force coefficients between the calculation and the experiment without the plasma actuation is shown in figure 6. Results are in good agreement between the calculation and the experiment.
In the numerical study, the effect of NS-DBD plasma actuation on the flow is equivalent to a heat source model which can be depicted as follows [21]:
| W=S×e-(x/a)2-(y/b)2×h(t). | (4) |
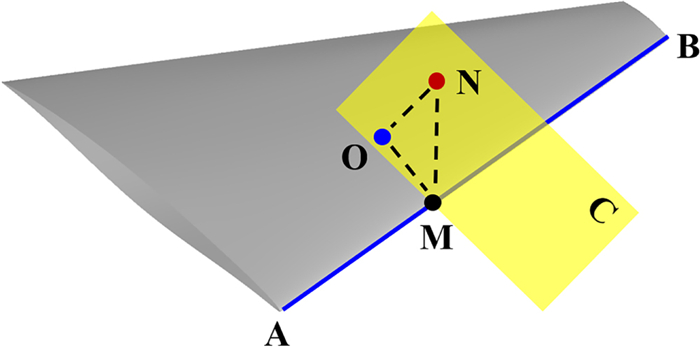
Assuming a point N in the flow, so there is only one plane C perpendicular to the leading-edge AB of the wing and passing through the point N. Assuming that the intersection of plane C and AB is point M, if a point in the flow is on the plane C, the heat source must be calculated according to the coordinate system with point M as the origin. There must be a point O on the plane C and the wing surface closest to the point N, so the distance of NO is
In order to study the influent of the actuation frequency on flow separation control, six different actuation frequencies which are 50 Hz, 100 Hz, 160 Hz, 200 Hz, 500 Hz, and 1000 Hz are selected. Among these, when the actuation frequency is 160 Hz and taking the average aerodynamic chord length of the wing as the reference length,
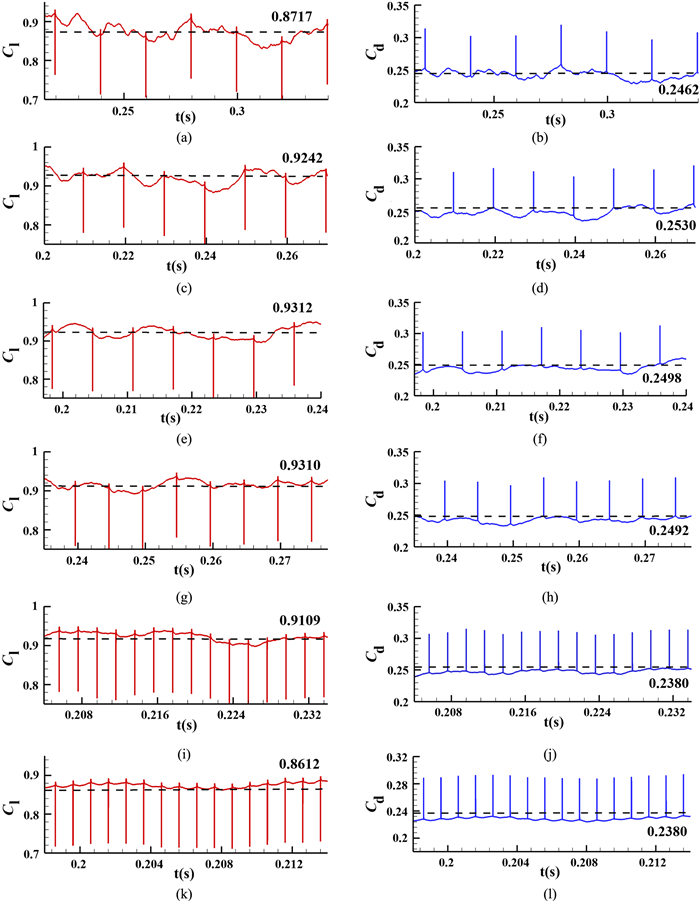
Aerodynamic coefficients under different actuation frequencies when the angle of attack is 18° are shown in figure 9. The value indicated by dotted line is time-averaged. When the plasma heat source begins to act, the lift coefficient will decrease sharply and the drag coefficient will decrease sharply owing to the high-temperature and high-pressure region on the leading-edge. When the actuation frequency is from 100 to 200 Hz (comparing with the base condition, the lift increase is 10.55% (100 Hz), 11.39% (160 Hz), 11.36% (200 Hz), respectively), a good effect on lift increasing can be obtained and when the actuation frequency is 500 Hz (the lift increasing is 8.96%), the control effect is also not bad. But when the actuation frequencies are 50 Hz (the lift increasing is 4.27%) and 1000 Hz (the lift increasing is 3.01%), it gets worse. Therefore, it is not that the higher the actuation frequency, the greater the energy, and the better the control effect. The fluctuation of aerodynamic coefficients gets smaller when the actuation frequency gets higher. This suggests that the higher the energy, the stronger the influence of plasma actuation on the flow.
The contrast of aerodynamic force coefficients between the calculation (14°, 16°, 18°, 20°, 22°) and the experiment with the plasma actuation frequency of 100 Hz is shown in figure 10. Because the plasma heat model is different from the actual discharge, the aerodynamic coefficients, especially the lift coefficient, have some differences from the experimental results, but the change tendency is consistent. The contrast of aerodynamic force coefficients between the experiment and the calculation when the plasma actuation frequency is 100 Hz and the angle of attack is 18° is shown in table 2.
| Cl | Cd | |||
| Experiment | 0.9864 | 0.2549 | ||
| Calculation | 0.9242 | 0.2530 | -6.31% | -0.7% |
DownLoad:
CSV
Figure 11 shows the evolution of plasma-induced vortex structures when the actuation frequency is 100 Hz and the angle of attack is 18°, which are phase-averaged over the cycles in figure 9(c). The plasma-induced vortexes roll the high-speed fluid outside the boundary layer into the boundary layer so that the flow is reattached and the lift is increased. As the plasma-induced vortex moves downstream, the intensity of the induced vortex first increases and then decreases, and when it is at the 3T/4, the induced vortex intensity is already very low and when it is at the 4T/4, the induced vortex disappears above the wing.
Figure 12 shows the condition when the actuation frequency is 200 Hz and the plasma-induced vortex structures are phase-averaged over the cycles in figure 9(g). Because the condition in which the actuation frequency is 160 Hz is similar, it is not shown. During the whole period of actuation, the plasma-induced vortex structures are always above the wing, so it always has an effect on lift increasing.
Figures 13 and 14 show the condition when the actuation frequency is 500 Hz and 1000 Hz, respectively, and the plasma-induced vortex structures are phase-averaged over the cycles in figures 9(i) and (k), respectively. Obviously, on one hand, the plasma-induced vortex structures are not fully developed during an actuation period, especially for the condition of 1000 Hz. This is the main reason why the control effect gets worse. On the other hand, the vortex structures above the wing become more regular own to the higher frequency and larger energy of plasma actuation, especially for the condition of 1000 Hz. This is the main reason why the fluctuation of aerodynamic coefficients gets smaller.
Figure 15 shows the condition when the actuation frequency is 50 Hz and the plasma-induced vortex structures are phase-averaged over the cycles in figure 9(a). When they are at 2T/4, 3T/4, and 4T/4, the plasma-induced vortex structures disappear above the wing and have no effect on lift increasing. This is the main reason why the control effect gets worse.
In this work, numerical studies on plasma separation control of a swept wing with different actuation frequencies which are 50 Hz, 100 Hz, 160 Hz, 200 Hz, 500 Hz, and 1000 Hz, respectively are conducted, and experiment studies in which the actuation voltage is 8 kV and the actuation frequency is 100 Hz are conducted to validate the numerical method. Some conclusions can be drawn as follows:
(1) The mechanism of NS-DBD plasma flow separation control is mainly through the interaction between the plasma-induced vortexes which are closely related to the actuation frequency and the separated flow. If the actuation frequency is too low, the plasma-induced vortexes will disappear in a period within an actuation cycle; if the actuation frequency is too high, the plasma-induced vortex cannot develop completely, resulting in a weak vortex intensity.
(2) The higher the actuation frequency, the stronger the influence of plasma actuation on the flow, the more regular the vortex structures above the wing and the smaller the fluctuation of aerodynamic coefficients.
(3) For the flow separation control over an airfoil, there is an optimal actuation frequency which meets
This research was supported by the National Science and Technology Major Project (No. J2019-II-0014-0035), Academician Workstation Foundation of the Green Aerotechnics Research Institute of Chonging Jiaotong University (No. GATRI2020C06003).
| [1] |
Kelley C L et al 2014 AIAA J. 52 1871 doi: 10.2514/1.J052708
|
| [2] |
Little J et al 2010 High lift airfoil leading edge separation control with nanosecond pulse DBD plasma actuators Proc. of the 5th Flow Control Conf. (Chicago) (AIAA) p 4256
|
| [3] |
Kelley C L et al 2012 High mach number leading-edge flow separation control using AC DBD plasma actuators Proc. of the 50th AIAA Aerospace Sciences Meeting Including the New Horizons Forum and Aerospace Exposition (Nashville) (AIAA) p 906
|
| [4] |
Roupassov D et al 2009 AIAA J. 47 168 doi: 10.2514/1.38113
|
| [5] |
Bisek N J et al 2012 Computational and experimental analysis of Mach 5 air flow over a cylinder with a nanosecond pulse discharge Proc. of the 50th AIAA Aerospace Sciences Meeting Including the New Horizons Forum and Aerospace Exposition (Nashville) (AIAA) p 186
|
| [6] |
Debien A, Benard N and Moreau E 2012 J. Phys. D: Appl. Phys. 45 215201 doi: 10.1088/0022-3727/45/21/215201
|
| [7] |
Zhang C et al 2019 Plasma Sources Sci. Technol. 28 064001 doi: 10.1088/1361-6595/ab094c
|
| [8] |
Takashima K et al 2011 Plasma Sources Sci. Technol. 20 055009 doi: 10.1088/0963-0252/20/5/055009
|
| [9] |
Li Y H et al 2010 Chin. Sci. Bull. 55 3060 (in Chinese) doi: 10.1007/s11434-010-3038-2
|
| [10] |
Audier P and Hong D 2012 Unsteady forcing of a post-stall flow over N NACA0012 airfoil by A surface DBD actuator Proc. of the 6th AIAA Flow Control Conf. (New Orleans) (AIAA) p 3052
|
| [11] |
Abdollahzadeh M, Pascoa J C and Oliveira P J 2018 Aerosp. Sci. Technol. 78 183 doi: 10.1016/j.ast.2018.04.013
|
| [12] |
Sidorenko A A et al 2007 Pulsed discharge actuators for rectangular wing separation control Proc. of the 45th AIAA Aerospace Sciences Meeting and Exhibit (Reno) (AIAA) p 941
|
| [13] |
Niu Z G et al 2019 AIP Adv. 9 125120 doi: 10.1063/1.5125847
|
| [14] |
Rethmel C et al 2011 Flow separation control over an airfoil with nanosecond pulse driven DBD plasma actuators Proc. of the 49th AIAA Aerospace Sciences Meeting Including the New Horizons Forum and Aerospace Exposition (Orlando) (AIAA) p 487
|
| [15] |
Yang Z Y 2015 Chin. J. Aeronaut. 28 11 doi: 10.1016/j.cja.2014.12.007
|
| [16] |
Rizzetta D P and Visbal M R 2010 AIAA J. 48 2793 doi: 10.2514/1.J050014
|
| [17] |
Mary I and Sagaut P 2002 AIAA J. 40 1139 doi: 10.2514/2.1763
|
| [18] |
Zhao G Y et al 2015 Chin. J. Aeronaut. 28 368 doi: 10.1016/j.cja.2014.12.036
|
| [19] |
Georgiadis N J, Rizzetta D P and Fureby C 2010 AIAA J. 48 1772 doi: 10.2514/1.J050232
|
| [20] |
Sørensen N N and Michelsen J A 2004 J. Sol. Energy Eng. 126 1011 doi: 10.1115/1.1807854
|
| [21] |
Poggie J 2006 Plasma-based hypersonic flow control Proc. of the 37th AIAA Plasmadynamics and Lasers Conf. (San Francisco) (AIAA) p 3567
|
| [1] | Zheng LI (李铮), Zhiwei SHI (史志伟), Hai DU (杜海), Qijie SUN (孙琪杰), Chenyao WEI (魏晨瑶), Xi GENG (耿玺). Analysis of flow separation control using nanosecond-pulse discharge plasma actuators on a flying wing[J]. Plasma Science and Technology, 2018, 20(11): 115504. DOI: 10.1088/2058-6272/aacaf0 |
| [2] | Lu MA (马璐), Xiaodong WANG (王晓东), Jian ZHU (祝健), Shun KANG (康顺). Effect of DBD plasma excitation characteristics on turbulent separation over a hump model[J]. Plasma Science and Technology, 2018, 20(10): 105503. DOI: 10.1088/2058-6272/aacdf0 |
| [3] | Yadong HUANG (黄亚冬), Benmou ZHOU (周本谋). Active control of noise amplification in the flow over a square leading-edge flat plate utilizing DBD plasma actuator[J]. Plasma Science and Technology, 2018, 20(5): 54021-054021. DOI: 10.1088/2058-6272/aab5bb |
| [4] | Jianyang YU (俞建阳), Huaping LIU (刘华坪), Ruoyu WANG (王若玉), Fu CHEN (陈浮). Numerical study of the flow structures in flat plate and the wall-mounted hump induced by the unsteady DBD plasma[J]. Plasma Science and Technology, 2017, 19(1): 15502-015502. DOI: 10.1088/1009-0630/19/1/015502 |
| [5] | R. KHOSHKHOO, A. JAHANGIRIAN. Numerical Simulation of Stall Flow Control Using a DBD Plasma Actuator in Pulse Mode[J]. Plasma Science and Technology, 2016, 18(9): 933-942. DOI: 10.1088/1009-0630/18/9/10 |
| [6] | WANG Yuling (王玉玲), GAO Chao (高超), WU Bin (武斌), HU Xu (胡旭). Simulation of Flow Around Cylinder Actuated by DBD Plasma[J]. Plasma Science and Technology, 2016, 18(7): 768-774. DOI: 10.1088/1009-0630/18/7/12 |
| [7] | HAN Menghu (韩孟虎), LI Jun (李军), LIANG Hua (梁华), et al.. Experimental Investigation on Aerodynamic Control of a Wing with Distributed Plasma Actuators[J]. Plasma Science and Technology, 2015, 17(6): 502-509. DOI: 10.1088/1009-0630/17/6/11 |
| [8] | LI Feng(李峰), GAO Chao(高超), ZHENG Borui(郑博睿), WANG Yushuai(王玉帅). Research on the Peristaltic Flow Acceleration Performance of Asynchronous and Duty Cycle Pulsed DBD Plasma Actuation[J]. Plasma Science and Technology, 2014, 16(9): 861-866. DOI: 10.1088/1009-0630/16/9/10 |
| [9] | YU Jianyang(俞建阳), LIU Huaping(刘华坪), XU Dimeng(徐迪孟), CHEN Fu(陈浮). Investigation of the DBD Plasma Effect on Flat Plate Flow[J]. Plasma Science and Technology, 2014, 16(3): 197-202. DOI: 10.1088/1009-0630/16/3/05 |
| [10] | GAO Jin (高进), GU Pingdao (顾平道), YUAN Li (袁里), ZHONG Fangchuan (钟方川). Degradation of Dye Wastewater by ns-Pulse DBD Plasma[J]. Plasma Science and Technology, 2013, 15(9): 928-934. DOI: 10.1088/1009-0630/15/9/18 |
Figures(15) / Tables(2)
Supported by: Beijing Renhe Information Technology Co., Ltd. 
| Cl | Cd | |||
| Experiment | 0.812 | 0.225 | ||
| Coarse grid + WALE | 0.884 | 0.246 | 8.87% | 9.33% |
| Fine grid + WALE | 0.836 | 0.232 | 2.96% | 3.11% |
| Coarse grid + WMLES | 0.864 | 0.242 | 6.40% | 7.56% |
| Fine grid + WMLES | 0.856 | 0.238 | 5.42% | 5.78% |
DownLoad:
CSV
| Cl | Cd | |||
| Experiment | 0.9864 | 0.2549 | ||
| Calculation | 0.9242 | 0.2530 | -6.31% | -0.7% |
DownLoad:
CSV