Figure
1.
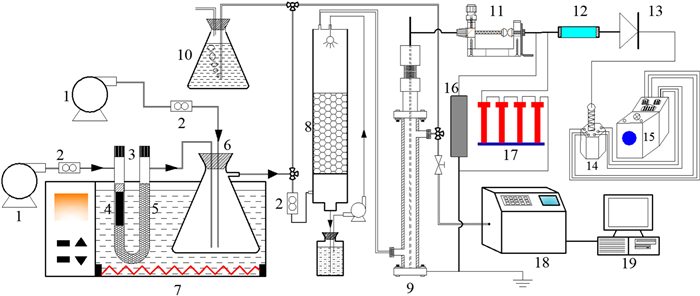
Schematic diagram of experimental setup and the two DDBD reactors.
| Citation: |
Hao HUANG, Lihao HE, Yuxuan WANG, Liang CHEN, Hui HU, Mi ZHANG. Experimental study on toluene removal by a two-stage plasma-biofilter system[J]. Plasma Science and Technology, 2022, 24(12): 124011. DOI: 10.1088/2058-6272/aca582

|
Volatile organic compounds (VOCs) are typical pollutants that affect air quality. Discharge plasma is thought to be a potential method that can remove VOCs from flue gas. In this experiment, pulsed corona discharge plasma combined with a biological tower was carried out to remove the benzene series, and toluene was selected as the typical VOC. The results indicated that the removal efficiency of toluene by pulsed corona plasma was slightly higher than that of direct current (DC) corona plasma, while its energy efficiency was much higher than DC corona plasma. Under the optimal experimental conditions of pulse voltage 8.5 kV, initial toluene concentration 1400 mg m-3, and toluene flow rate of 12 l h-1, the toluene removal efficiency reached 77.11% by the single method of pulsed corona discharge plasma, and the energy efficiency was up to 1.515 g/(kW·h) under the pulse voltage of 4.0 kV. The trickling biofilter was constructed by using the screened and domesticated Acinetobacter baumannii, and the highest toluene removal efficiency by the pulsed corona discharge plasma combined with the trickling biofilter rose up to 97.84%. Part of the toluene was degraded into CO2, H2O, and some intermediate products such as o-diphenol under the influence of Acinetobacter baumannii. When the remaining waste gas passed through the discharge plasma reactor, the benzene ring structure could be directly destroyed by the collision between toluene and plasma. Meanwhile, O·, OH·, and some other oxidizing radicals generated by the discharge also join into the oxidative decomposition of toluene and its intermediate products, thereby further improving the removal efficiency of toluene. Therefore, the two-stage plasma-biofilter system not only showed a high toluene removal efficiency, but also had a good energy efficiency. The results of this study will provide theoretical support and technical reference for industrial VOC treatment.
Dielectric barrier discharge (DBD) has been applied in environmental field for more than 150 years since it was invented by Siemens in 1857. For a long time and nowadays, one of its most significant and broadest applications is the generation of ozone for water disinfection [1]. In recent three decades, researchers have explored the implementation of DBD in other environmental domains such as air pollution control including NOx [2], SO2 [3] and volatile organic compounds (VOCs) treatment [4], as well as in energy fields including CO2 conversion [5], dry reforming of methane [6] and ammonia synthesis [7]. However, the application of DBD reactor is limited due to its unsatisfactory conversion efficiency, product selectivity and energy yield (EY) [8]. In order to improve the performance of DBD, most researchers have concentrated on the combination of DBD and catalysis, and obtained some gratifying achievements [9, 10]. Nevertheless, there are some other options to optimize DBD reactor. It is well known that the discharge characteristics of the DBD reactor exert a decisive influence on its performance regardless of the application scenario. In addition to packing catalysts such as Al2O3 and zeolite pellets [11], and using advanced power supply device such as pulsed power [12], the design and optimization of reactor configuration is also an effective, economical and convenient methodology to ameliorate the discharge parameters of DBD.
Since the DBD reactor is generally composed of two electrodes with opposite polarities and one or more layer of insulating barrier, the geometric structure and material of the electrodes and barrier as well as the number of dielectric barriers will affect the discharge behavior and reactor performance [13, 14]. For example, Bahri et al [13] found that the reactor equipped with paste ground electrode exhibited higher EY than that with foil and mesh electrodes for ozone generation. Mei et al [14] concluded that a thin dielectric barrier was more favorable for CO2 conversion due to the high transferred charge. Recently, some researchers have developed a double dielectric barrier discharge (DDBD) reactor with two layers of barriers and applied it in VOCs [15, 16] and NO [17] removal. In this configuration, both the high voltage and ground electrodes are attached with dielectric barrier and isolated from plasma species, so the electrodes can be protected from plasma corrosion and etching. For VOCs destruction, the deposition of organic by-products on electrode surface can also be avoided. However, the field emission and secondary electron emission from the cathode may be shielded by the dielectric, thereby reducing charge transfer and thus weaking the discharge intensity [18]. In fact, there is another type of DDBD reactor in which one electrode is attached to the barrier and the other electrode is not [19]. In our previous work [20], a DDBD reactor of this configuration was established, and we found that the discharge in the DDBD reactor was more stable and uniform than that in single dielectric barrier discharge (SDBD) reactor. As a result, the energy efficiency for toluene degradation of the DDBD reactor was 2.5–3 times that of SDBD at 18–24 kV applied voltage. Although the two different configurations of DDBD reactor both exhibit their own advantages over the SDBD reactor, it is unknown which one has superior performance. Therefore, it is of great significance to investigate the discharge characteristics and performance of the two different DDBD reactors.
In this study, a novel double dielectric barrier discharge (NDDBD) reactor with high field emission and secondary electron emission was developed, and compared with traditional DDBD (TDDBD) configuration in terms of discharge characteristics and VOC degradation performance. Toluene was chosen as the target VOC due to its extensive sources and high ozone formation potential. The discharge properties of the two reactors were investigated at different voltages through visual images, voltage–current waveforms, Lissajous figures, and gas temperature. Subsequently, removal efficiency (RE), mineralization rate (MR) and CO2 selectivity of toluene decomposition, as well as by-product generation were adopted to evaluate the performance of the two reactors. In addition, the EY and kinetics study were discussed. Finally, plausible mechanisms of toluene degradation in the two reactors were proposed based on the detected organic intermediate products from outlet gas and the dielectric surface.
Figure 1 depicted the schematic diagram of experimental system setup, including gas distribution, plasma generation, power supply and analysis systems. The carrier gas from an air pump flowed through a bubbling flask containing liquid toluene (Analytical reagent, Luoyang Haohua, China) and carried out gaseous toluene. Then, it was diluted by another air stream in a mixing chamber to generate a certain concentration of toluene and finally flowed into the DDBD reactor. A drying tube was applied in both gas flow to dry and purify the ambient air and the relative humidity (detected by a digital hygrometer) of the purified air was maintained at about 12%. The toluene concentration was maintained at 300 ppm and the flow rate was 1 l min-1, both of which were controlled by jointly adjusting the gas flow rate through the mass-flow controller (CS200D, Sevenstar, China). Non-thermal plasma (NTP) was generated in a home-made cylindrical DDBD reactor with a high voltage AC power supply (18–28 kV, 50 Hz, GJTK-0.01/30 K, Nangang, China).
Both DDBD reactors consisted of two cylindrical quartz glass barriers, a high voltage electrode and a ground electrode, as illustrated in figure 2. The outside of the outer tube (inner diameter: 30 mm, 1.5 mm thickness) was wrapped with a copper foil (0.05 mm thickness, 100 mm length) ground electrode, and a stainless-steel rod (2 mm diameter) fixed in the tube's axis served high voltage electrode. For TDDBD, the inner tube (inner diameter: 2.2 mm, 1 mm thickness) was attached with the high voltage electrode, and there is only one discharge zone. For NDDBD, the inner tube (inner diameter: 16 mm, thickness: 1 mm) was isolated from the high voltage electrode. Therefore, the high voltage electrode was directly exposed to plasma during discharge and two discharge zones in series were created with one power supply. The gas entered the reactor from the inner tube and exited the reactor from the outer tube.
An oscilloscope (DPO3054, Tektronix, USA) coupled with a 1000:1 voltage probe (P6015A, Tektronix, USA) was applied to measure the discharge behavior of the DDBD reactors. The discharge voltage and current waveforms were detected by connecting a resistor (10 Ω) in series in the circuit. The input power of the DDBD reactors was calculated through V–Q Lissajous figures, which were obtained by turning the switch K to connect the capacitor (0.47 μF) to the circuit. A mercury thermometer was used to detect the discharge gas temperature, and the discharge images were photographed by a mobile phone. A Fourier-transform infrared spectroscope (FTIR, Nicolet Antaris IGS, Thermo Fisher Scientific, USA) was employed to analyze the concentration of toluene, CO2, CO and NOx. FTIR was equipped with a gas cell with 2 m light pathway length and the temperature was set to 165 ℃ during analysis. O3 concentration was detected by an ozone analyzer (Model 106-M, 2B Technologies, USA). The gas phase organic by-products were adsorbed by 5 g ZSM-5 zeolite located downstream of the reactor. The zeolite was then extracted in liquid acetone through ultrasonic vibration for 60 min and the liquid supernatant was analyzed by gas chromatography mass spectrometry (GC–MS, 7890A GC/7000 MS, Agilent, USA) with an HP-5 MS capillary column (30 m×250 μm×0.25 μm).
The toluene decomposition performance of the two DDBD reactors was evaluated by RE, MR (MR, also refers to COx selectivity), CO2 selectivity (Sco2), input power (P), specific input energy (SIE) and EY, which are expressed as equations (1)–(6):
| RE(%)=nin-noutnin×100, | (1) |
| MR(%)=nCO2+nCO(nin-nout)×7×100, | (2) |
| SCO2(%)=nCO2nCO2+nCO×100, | (3) |
| P(W)=f×C×A, | (4) |
| SIE(Jl-1)=PQ×60, | (5) |
| EY(gkW-1h-1)=MR×nin×MC7H8P×6022.4. | (6) |
In order to clearly observe the discharge in the DDBD reactors, an observation window of 100 mm×10 mm was created instead of completely enclosing the outer tube by copper foil. Figure 3 presented the discharge images of the two DDBD reactors at 18–28 kV applied voltage. In both reactors, no local bright spots or filaments appeared in the discharge images, suggesting that uniform discharges were obtained in the DDBD reactors. In addition, the discharge color of the two reactors gradually brightened as the applied voltage increased, which indicated that more molecules and dissociated atoms are excited into metastable and excited states. Obviously, the discharge color in TDDBD was almost blue, while the color in NDDBD was close to purple. Therefore, the spectral intensity released in TDDBD was weaker than that in NDDBD during discharge at the same applied voltage, implying that stronger discharges were created in NDDBD.
The difference in the discharge characteristics between TDDBD and NDDBD can be ascribed to the fact that the inner tube in TDDBD was adjacent to the high voltage electrode, which caused the field emission and secondary electron emission of the cathode to be shielded. Based on Townsend theory, the secondary electron emission of the cathode plays a significant role in the whole discharge current increase and further for electron impact excitation and ionization process in discharge plasma generation [21]. Similarly, field emission also contributes greatly to the ignition and sustainability of plasma [22].
Figure 4 depicted the typical discharge voltage–current waveforms of TDDBD and NDDBD at 20 and 28 kV, respectively. In both reactors, the discharge was clearly filamentary, which suggested that filamentary discharges were created in the DDBD reactors. However, these filaments did not exhibit the comb-like shape in traditional single dielectric barrier reactor, indicating that filamentary discharges were uniformly distributed within the reactors [20]. As the applied voltage elevated from 20 to 28 kV, the number and density of discharge current were increased significantly. A higher applied voltage means more filaments are generated per unit time, since individual filaments tend to be ignited at a roughly fixed applied voltage. Each filament can be regarded as an independent chemical reaction channel, so the increased discharge filaments will lead to the production of more reactive species through ionization, dissociation and excitation [23].
Under different applied voltages, the discharge current intensity and quantity of NDDBD reactor was obviously greater than that of TDDBD reactor. For TDDBD, the initial electrons that ignite the discharge were mainly derived from the free electrons in the discharge gas. During discharge, the positive ions in plasma can only reach the outer surface of the inner tube, and cannot collide with the cathode surface to cause secondary electron emission. However, in NDDBD reactor, although there were also two-layer dielectric barriers, the cathode and the inner dielectric were not closely attached. Therefore, the electrons in the cathode will enter the gas phase through field emission under high applied voltage to promote the discharge process [24]. In addition, the positive ions generated during discharge bombard the cathode surface under electric field force, causing secondary electron emission [25]. These emitted electrons will be accelerated by the electric field and contribute to the gas ionization and dissociation, thereby increasing the discharge current.
The Lissajous figures and input power of TDDBD and NDDBD reactors were presented in figure 5. As the voltage increased from 20 to 28 kV, the Lissajous figures' area of both reactors increased, which indicated that the amount of transferred in each discharge cycle is positively correlated with the electric field intensity [26]. In addition, the Lissajous figures' shape of the two reactors was close to a parallelogram, suggesting that the DDBD reactors are ideal capacitors. For both reactors, the Q=0 crossing in Lissajous figures tends to be occur at the same applied voltage, which also suggested that filamentary discharges were generated in the reactors [27]. Under different applied voltages, the Lissajous figures' area of NDDBD reactor was significantly larger than that of TDDBD, which can be attributed to the stronger discharge in NDDBD resulting in more transferred charge. For example, the amount of transferred charge in NDDBD reactor was about 3 time that of TDDBD at 28 kV. Similar result was observed by Meiners et al [18], who concluded that compared with the DBD where each electrode was covered with a dielectric barrier, the transferred charge increased by about 70% by leaving one electrode bare.
As depicted in figure 5(b), the input power of the two reactors increased almost linearly with increasing applied voltage. At 18–28 kV, the consumed power of NDDBD was 2.17–15.12 W, which was much larger than that of TDDBD (1.24–4.90 W) at the same applied voltage. In addition, the rate at which the input power of NDDBD reactor increased with applied voltage was obviously higher than that of TDDBD, which can be explained from two aspects. With the rise of applied voltage, the electric field intensity near the cathode increased, causing more electrons to participate in gas discharge through the cathode field emission. Furthermore, the positive ions in plasma obtained higher energy under high voltage, making them more likely to collide with the cathode and triggered secondary electron emission. Therefore, the enhancement of discharge by field emission and secondary electron emission in NDDBD also elevated with rising applied voltage.
The input energy of the DBD reactor is not all consumed in processes such as ionization, dissociation and excitation, which plays decisive role in pollutants degradation in plasma. Actually, part of the energy will be dissipated through elastic collisions between electrons and molecules/atoms, as well as Joule heat. As a result, the temperature of bulk gas, electrodes and dielectric barrier will elevate during discharge. Figure 6(a) illustrated the gas temperature variation of TDDBD and NDDBD reactors over time at 24 kV. Clearly, the gas temperature of the two reactors gradually increased first, and then remained constant after reaching a maximum value, which implied that the entire plasma system reached a steady state in temperature. Similar phenomena have been observed in other previous studies [28–30]. Compared with TDDBD reactor, the gas temperature in the outer tube and inner tube of the NDDBD was significantly higher which were 28 ℃, 62 ℃ and 98 ℃, respectively. This indirectly suggested that the discharge intensity of the NDDBD was stronger than that of TDDBD reactor, which not only leaded to more reactive species in NDDBD, but also increased the input energy dissipated in the form of heat. In addition, for NDDBD reactor, the gas temperature of the inner tube was higher than that of the outer tube since the former exhibited a stronger discharge intensity [19, 31].
Figure 6(b) presented the variation of maximum gas temperature with applied voltage in TDDBD, as well as the inner and outer tubes in NDDBD. As the voltage increased from 18 to 28 kV, the gas temperature of TDDBD and the outer tube and inner tube of NDDBD elevated from 19 ℃, 28 ℃ and 45 ℃ to 33 ℃, 87 ℃ and 126 ℃, respectively. This suggested that the discharge intensity, transferred charge and discharge gas temperature will increase simultaneously with the rise of applied voltage [30]. Thus, a high voltage will generate more microdischarges while also cause undesirable temperature rise. Similar to the input power, the gas temperature of NDDBD reactor increased with applied voltage at a rate remarkably greater that of TDDBD.
The toluene RE and MR as a function of input power were depicted in figures 7(a) and (b). As the input power elevated from 1.24 to 4.90 W, the RE of TDDBD increased from 28.17% to 80.48%. In contrast, NDDBD exhibited a much higher RE, i.e. complete toluene removal was achieved at 6.42 W. The MR of both reactors increased with the rise of input power, which can be ascribed to the formation of more microdischarges under input power. Specifically, a higher input power means that more identical filamentary discharges were generated per unit time, thereby providing increased chemical reaction channels for toluene degradation [32]. In other words, more reactive species are generated under a greater input power, and the number of active species shared by each single toluene molecule increased.
The MR of NDDBD and TDDBD were 17.16%–43.42% and 7.17%–16.44% at 2.17–15.12 W and 1.24–4.90 W, respectively. Under the same input power (about 2.00–4.90 W), the MR of NDDBD was about twice that of TDDBD, which indicates that the input energy in NDDBD can be utilized more effectively to oxidize toluene. For NDDBD, the electrons derived from cathode through field emission and secondary electron emission greatly enhance the discharge intensity, thus producing more reactive species for toluene mineralization. However, the electrons in the cathode of TDDBD have no chance to participate in the discharge due to the shielding of the inner tube. In addition, the unique two-stage configuration of NDDBD can achieve hierarchical degradation of toluene, i.e. toluene molecule was initially destructed in the inner tube with strong discharge and then entered the outer tube to be further degraded, which did not occur in TDDBD.
Different from RE and MR, CO2 selectivity was not sensitive to input power variations for the two reactors, as shown in figure 7(c). This indicates that although increasing the input power improved the MR, the ratio of CO2 and CO will not be altered. Actually, the reactive species in plasma are non-selective, which means that variations in voltage will not change the proportion of each product. The same result was also obtained by Kim et al [33], who found that the CO2 selectivity was independent of either the SIE or the type of VOCs. Nevertheless, the CO2 selectivity of NDDBD was a little higher than that of TDDBD. This may be because some intermediates produced from toluene degradation in the inner tube of NDDBD will be further oxidized to CO2 after flowing into the outer tube, while there was only one discharge zone in TDDBD [20].
During VOCs decomposition in plasma, it is inevitable to produce unwanted by-products such as O3 and NOx. Ozone is formed by the reaction between oxygen and oxygen atoms, which derived from the dissociation of oxygen caused by electron collisions [34]. In most cases, a third temporary collision partner will also involve in the formation of ozone [35, 36]. Only N2O was identified by FTIR, while NO and NO2 were not detected. This may be because the consumption rates of NO and NO2 were faster than their generation rates, since the decomposition reactions of NO and NO2 can proceed spontaneously due to the abundant N atoms in the NTP [37]. Unlike NO and NO2, the decomposition reaction of N2O is endothermic, which is hard to occur at lower temperatures, resulting in an accumulation of N2O. However, it is an unusual situation that neither NO nor NO2 was detected in the presence of oxygen and nitrogen during discharge. The formation of NOx will be paid special attention in our future investigation. Figure 8 depicted the change of O3 and N2O concentrations in TDDBD and NDDBD as a function of input power. For both reactors, the O3 and N2O concentrations were positively correlated with input power, which suggested that a high input power will not only improve toluene RE and MR, but also increase the formation of O3 and N2O due to the non-selective nature of plasma.
The O3 concentrations in NDDBD were much higher than those in TDDBD, which were 34–94 ppm and 87–408 ppm at 1.24–4.90 W and 2.17–15.12 W, respectively. The same was true for N2O concentrations, which were 0.74–3.79 ppm and 4.22–16.17 ppm in TDDBD and NDDBD, respectively. This was because the field emission and secondary electron emission of the cathode in NDDBD have significantly enhanced the number of filamentary discharges, resulting in more reactive species. Although these by-products are undesirable, they can be easily suppressed by adopting suitable catalysts in the downstream of discharge zone [37, 38].
The EY of TDDBD and NDDBD as a function of input power was presented in figure 9(a). As the input power raised from 1.24 to 4.90 W and 2.17 to 15.12 W, the EY reduced from 3.59 to 2.49 g kW-1 h-1 and 5.17 to 2.13 g kW-1 h-1 in TDDBD and NDDBD, respectively. The same tendency was also observed by Chang et al [39], who applied a post plasma-catalytic system for toluene degradation. Thus, although a high input power was favorable to toluene degradation, it will be detrimental to EY. The increase in input power produced more reactive species for toluene decomposition, but also leaded to a high temperature in the reaction system. In addition, the oxidation of toluene is an exothermic reaction, which prefers low temperatures [40]. As a result, the high input power caused more energy to be dissipated in the form of heat, resulting in low EY.
Under the same input power (about 2.00–4.90 W), the EY of NDDBD was clearly higher than that of TDDBD reactor, which was consistent with the difference in the MR of the two reactors. This indicated that the input energy in NDDBD can be more fully utilized, even though its gas temperature was higher than that of TDDBD. In NDDBD, two reaction zones with different discharge intensities were created, and toluene was initially decomposed into organic intermediates in the inner tube with strong discharge zone and then these products were further oxidized to COx in the outer tube with weak discharge zone. In comparison, TDDBD had only one discharge zone with the same discharge intensity, and low-energy active species contribute less to the oxidation of organic intermediates. In previous work [20], we demonstrated that DDBD reactor had much higher EY than SDBD because the low gas temperature in DDBD leaded to high energy utilization. In contrast, the discrepancy of EY between the two configurations of DDBD reactor was mainly the difference in the utilization efficiency of reactive species.
In plasma process, it is currently not possible to directly detect the concentrations of reactive species and intermediate products, which makes it difficult to determine the rate coefficient of each elementary chemical reaction [41]. In addition, although several models have been developed to describe the discharge properties in plasma, the fully analysis of the entire VOCs degradation processes is not available. Zhu et al [42] have proposed a simplified model to illustrate the toluene elimination by NTP based on the assumption that the overall reaction rate of toluene degradation in plasma is proportional to the SIE. Therefore, a relationship between MR and SIE can be established, as shown in equation (7), and the specific derivation process can be found in our previous work [20]
| -ln(1-MR)=koverall·SIE. | (7) |
According to experimental results, a linear relationship between
The degradation mechanism of toluene in DDBD reactors was analyzed based on the organic products detected in the venting gas and the deposition on the dielectric surface. The detected intermediate products and a GC–MS diagram were depicted in figure 10. The types of organic products in the venting gas of TDDBD and NDDBD are mostly the same, as well as the deposition on the dielectric surface of the two reactors. This indicated that the toluene degradation pathways in TDDBD and NDDBD are similar, although their toluene RE and MR were quite different. It was because the difference in discharge intensity mainly dictated the number and energy of reactive particles, which are not selective in chemical reactions. From another perspective, the toluene degradation process in NDDBD and TDDBD was different because NDDBD possesses two discharge zones with disparate properties. In NDDBD, part of the organic intermediates generated in the inner tube will flow into the outer tube and be oxidized by reactive species with low-energy. In comparison, TDDBD possessed only one discharge zone, in which the low-energy reactive species cannot be effectively utilized.
Figure 11 presented the supposed decomposition mechanism of toluene in DDBD reactors. It is well known that the reaction rate constant of energetic electrons (in the order of 10-6 cm3 molecule-1 s-1) with toluene is much higher than those of other reactive species such as ·O (8.4×10⁻¹⁴ cm3 molecule-1 s-1) and ·OH (5.2×10⁻¹² cm3 molecule-1 s-1) [21, 43]. However, since the concentration of toluene was only 300 ppm, there was little chance for the toluene to react with electrons. In contrast, most of the energy of electrons in NTP is preferentially to dissociate and ionize dominant gas (O2 and N2) molecules to generate active species [44]. Therefore, it is the heavy reactive particles rather than electrons that play a major role in the direct degradation of toluene.
The dissociation energy of C–C bond and C=C bond in benzene ring is 5.0–5.3 and 5.5 eV, respectively, which are higher than that of C–H bond in methyl (3.7 eV), benzene ring (4.3 eV), and C–C bond (4.4 eV) between benzene ring and methyl group [45]. Theoretically, the energy of the active species in DDBD is adequate to destruct all these chemical bonds in toluene, but the C–H bond in methyl and benzene ring, and C–C bond between benzene ring and methyl group are more likely to be broken at the initial degradation pathways of toluene [32, 46]. As a result, the cracking of these bond with low dissociation energy leads to the formation of benzyl and phenyl radicals, which can be rapidly oxidized by oxygen-containing reactive species such as ·O and ·OH to benzyl alcohol, benzaldehyde and phenol. The C–H bond in the benzene ring of toluene, benzyl alcohol and phenol can be broken to form corresponding radicals, which reacts with ·NO2, ·OH and ·COOH to generate m-methylnitrobenzene, o-methylphenol, methylbenzoic acid, p-nitrobenzyl alcohol and nitrophenol. Subsequently, the aromatic rings of these organic intermediates are cracked by active particles to form various chained organic products. Then, these products would be further oxidized into small organics and finally to COx and H2O through various reaction pathways that are currently not fully identified.
Previously, we demonstrated that the DDBD reactor with two discharge zone exhibited a much higher EY than traditional SDBD reactor for toluene degradation. This was because the non-uniform filamentary discharge in the SDBD reactor was transformed into stable and diffuse discharge in the DDBD reactor. Herein, two DDBD reactors with different configurations were evaluated in terms of discharge characteristics and toluene degradation performance. A uniform discharge can be achieved in both reactors, whereas their discharge intensity is quite different. Compared with the reactor with only one discharge zone (TDDBD), the reactor with two discharge zone (NDDBD) possessed stronger discharge intensity, higher transferred charge and gas temperature due to its effective utilization of electrons from cathode caused by field emission and secondary electron emission.
The stronger discharge in NDDBD reactor leads to more reactive species with higher energy, which makes the toluene RE and MR of NDDBD much higher than that of TDDBD reactor. In addition, the dual discharge zone structure of NDDBD allowed toluene to be degraded step-by-step in the inner tube and outer tube with different discharge intensities. As a result, the low-energy reactive species in NDDBD can be more effectively utilized than those in TDDBD, which made NDDBD have higher energy efficiency despite its higher gas temperature. Nevertheless, the overall energy constant
To improve the performance of traditional DBD reactor, two DDBD reactors with different configurations were developed and evaluated from the perspective of discharge characteristics and toluene abatement performance. In TDDBD reactor, the cathode was attached with the inner dielectric barrier, which shielded the cathode's electrons from contributing to the gas discharge. In contrast, the cathode in NDDBD was isolated from the inner barrier, so the electrons in the cathode can participate in the discharge through field emission and secondary electron emission. As a result, the discharge intensity and consumed power of NDDBD reactor were much stronger and higher than those of TDDBD reactor, which made NDDBD generate more reactive species under the same applied voltage. Therefore, NDDBD (2.17–15.12 W) exhibited higher toluene RE and MR than TDDBD (1.24–4.90 W), which were 86.44%–100% versus 28.17%–80.48% and 17.16%–43.42% versus 7.17%–16.44%, respectively. The stronger discharge intensity in NDDBD produced more active particles while also making its gas temperature higher than TDDBD. However, NDDBD exhibited a higher EY than TDDBD, which can be attributed to the high utilization of low-energy reactive species in the outer tube of NDDBD. In addition, the unique dual discharge zone configuration of NDDBD enabled toluene to be more fully oxidized in zones with different discharge intensities. The finding in this work is of great significance to the design and optimization of DBD reactor in VOCs control, as well as other environmental and energy fields.
This work was financially supported by the National Key Research and Development Program of China (No. 2019YFC0214303) and the Applied Basic Research Program of Wuhan, China (No. 2015060101010068). The authors are also grateful for the analytical support from the Analytical and Testing Center of Huazhong University of Science and Technology.
| [1] |
Mihajlović M et al 2016 J. Clean. Prod. 112 1559 doi: 10.1016/j.jclepro.2015.04.080
|
| [2] |
Shi J W et al 2015 Sci. Total Environ. 515 101 doi: 10.1016/j.scitotenv.2015.02.034
|
| [3] |
Qu M M et al 2021 Process Saf. Environ. 153 139 doi: 10.1016/j.psep.2021.06.028
|
| [4] |
Zhang X L et al 2022 Plasma Sci. Technol. 24 084002 doi: 10.1088/2058-6272/ac639b
|
| [5] |
Xiao G et al 2014 Plasma Chem. Plasma Process. 34 1033 doi: 10.1007/s11090-014-9562-0
|
| [6] |
Ma Y X et al 2016 Energ. Fuel. 30 9580 doi: 10.1021/acs.energyfuels.6b01563
|
| [7] |
Yao S L et al 2020 High Voltage Eng. 46 342 (in Chinese) doi: 10.13336/j.1003-6520.hve.20191227022
|
| [8] |
Bo Z et al 2009 J. Hazard. Mater. 166 1210 doi: 10.1016/j.jhazmat.2008.12.030
|
| [9] |
Mustafa M F et al 2018 J. Hazard. Mater. 347 317 doi: 10.1016/j.jhazmat.2018.01.021
|
| [10] |
Schücke L et al 2020 Plasma Sources Sci. Technol. 29 114003 doi: 10.1088/1361-6595/abae0b
|
| [11] |
Du C M et al 2018 IEEE Trans. Plasma Sci. 46 838 doi: 10.1109/TPS.2018.2808243
|
| [12] |
Ahn T et al 2019 Plasma Chem. Plasma Process. 39 423 doi: 10.1007/s11090-019-09953-0
|
| [13] |
Li S J et al 2020 Chem. Eng. J. 388 124275 doi: 10.1016/j.cej.2020.124275
|
| [14] |
Shang K F et al 2022 Plasma Sci. Technol. 24 015501 doi: 10.1088/2058-6272/ac3379
|
| [15] |
Guan Y X et al 2022 IEEE Trans. Plasma Sci. 50 61 doi: 10.1109/TPS.2021.3134371
|
| [16] |
Vertriest R et al 2022 Plasma Sources Sci. Technol. 12 412 doi: 10.1088/0963-0252/12/3/316
|
| [17] |
Ma F J et al 2019 Chemosphere 233 913 doi: 10.1016/j.chemosphere.2019.05.292
|
| [18] |
Jose J et al 2021 J. Environ. Sci. 101 382 doi: 10.1016/j.jes.2020.09.003
|
| [19] |
Kim H K et al 2016 Chem. Eng. Process. 104 51 doi: 10.1016/j.cep.2016.02.010
|
| [20] |
Vandenbroucke A M et al 2011 J. Hazard. Mater. 195 30 doi: 10.1016/j.jhazmat.2011.08.060
|
| [21] |
Jiang L Y et al 2016 J. Chem. Technol. Biotechnol. 91 3079 doi: 10.1002/jctb.4984
|
| [22] |
Liu B Y et al 2022 J. Hazard. Mater. 422 126847 doi: 10.1016/j.jhazmat.2021.126847
|
| [23] |
Kim H K et al 2009 Environ. Eng. Sci. 26 1289 doi: 10.1089/ees.2008.0255
|
| [24] |
Jiang N et al 2019 J. Hazard. Mater. 369 611 doi: 10.1016/j.jhazmat.2019.02.087
|
| [25] |
Wang B W et al 2017 Chem. Eng. J. 322 679 doi: 10.1016/j.cej.2017.03.153
|
| [26] |
Liu Y H C et al 2020 Plasma Sci. Technol. 22 034016 doi: 10.1088/2058-6272/ab69bc
|
| [27] |
Becker K et al 2005 Plasma Phys. Control. Fusion 47 B513 doi: 10.1088/0741-3335/47/12B/S37
|
| [28] |
Hu H et al 2015 Plasma Sci. Technol. 17 1043 doi: 10.1088/1009-0630/17/12/11
|
| [29] |
Yun J Y et al 2022 J. Environ. Chem. Eng. 10 107847 doi: 10.1016/j.jece.2022.107847
|
| [30] |
Bhargavi K et al 2022 IEEE Trans. Plasma Sci. 50 1416 doi: 10.1109/TPS.2022.3153667
|
| [31] |
Kim H H et al 2008 Appl. Catal. B: Environ. 79 356 doi: 10.1016/j.apcatb.2007.10.038
|
| [32] |
Kim H H et al 2011 Sensors 11 2992 doi: 10.3390/s110302992
|
| [1] | Rongjing DENG, Tingfeng MING, Bang LI, Qiqi SHI, Shanwei HOU, Shuqi YANG, Xiaoju LIU, Shaocheng LIU, Guoqiang LI, Xiang GAO, Yasuhiro SUZUKI, Yunfeng LIANG. VUV imaging of type-I ELM filamentary structures and their temporal characteristics on EAST[J]. Plasma Science and Technology, 2024, 26(11): 114002. DOI: 10.1088/2058-6272/ad621c |
| [2] | Fan ZHOU (周凡), Tingfeng MING (明廷凤), Yumin WANG (王嵎民), Feifei LONG (龙飞飞), Qing ZHUANG (庄清), Shaocheng LIU (刘少承), Guoqiang LI (李国强), Xiang GAO (高翔), the EAST team. Observation of filament-like structures in ELMy H-mode plasma with a VUV imaging system developed on the EAST tokamak[J]. Plasma Science and Technology, 2019, 21(9): 95101-095101. DOI: 10.1088/2058-6272/ab1b1b |
| [3] | Zhijun WANG (王智君), Xiang GAO (高翔), Tingfeng MING (明廷凤), Yumin WANG (王嵎民), Fan ZHOU (周凡), Feifei LONG (龙飞飞), Qing ZHUANG (庄清), EAST Team. Two-dimensional vacuum ultraviolet images in different MHD events on the EAST tokamak[J]. Plasma Science and Technology, 2018, 20(2): 25103-025103. DOI: 10.1088/2058-6272/aa9477 |
| [4] | Nan ZHAO (赵楠), Ning YAN (颜宁), Guosheng XU (徐国盛), Zhengxiong WANG (王正汹), Ran CHEN (陈冉), Huiqian WANG (汪惠乾), Liang WANG (王亮), Siye DING (丁斯晔), Linming SHAO (邵林明), Liang CHEN (陈良), Guanghai HU (胡广海), Wei ZHANG (张炜). The observation of small ELM post-cursor mode in EAST[J]. Plasma Science and Technology, 2018, 20(2): 24007-024007. DOI: 10.1088/2058-6272/aa9bd8 |
| [5] | Xianzu GONG (龚先祖), Baonian WAN (万宝年), Jiangang LI (李建刚), Jinping QIAN (钱金平), Erzhong LI (李二众), Fukun LIU (刘甫坤), Yanping ZHAO (赵燕平), Mao WANG (王茂), Handong XU (徐旵东), A M GAROFALO, Annika EKEDAH, Siye DING (丁斯晔), Juan HUANG (黄娟), Ling ZHANG (张凌), Qing ZANG (臧庆), Haiqing LIU (刘海庆), Long ZENG (曾龙), Shiyao LIN (林士耀), Biao SHEN (沈飙), Bin ZHANG (张斌), Linming SHAO (邵林明), Bingjia XIAO (肖炳甲), Jiansheng HU (胡建生), Chundong HU (胡纯栋), Liqun HU (胡立群), Liang WANG (王亮), Youwen SUN (孙有文), Guosheng XU (徐国盛), Yunfeng LIANG (梁云峰), Nong XIANG (项农), EAST Team. Realization of minute-long steady-state H-mode discharges on EAST[J]. Plasma Science and Technology, 2017, 19(3): 32001-032001. DOI: 10.1088/2058-6272/19/3/032001 |
| [6] | FU Chao (付超), ZHONG Fangchuan (钟方川), HU Liqun (胡立群), YANG Jianhua (杨建华), YANG Zhendong (仰振东), GAN Kaifu (甘开福), ZHANG Bin (张斌), EAST Team. The Calibration of High-Speed Camera Imaging System for ELMs Observation on EAST Tokamak[J]. Plasma Science and Technology, 2016, 18(9): 884-889. DOI: 10.1088/1009-0630/18/9/02 |
| [7] | ZHANG Chongyang (张重阳), LIU Ahdi (刘阿娣), LI Hong (李弘), LI Bin (李斌), et al.. X-Mode Frequency Modulated Density Profile Reflectometer on EAST Tokamak[J]. Plasma Science and Technology, 2013, 15(9): 857-862. DOI: 10.1088/1009-0630/15/9/04 |
| [8] | LIU Peng (刘鹏), XU Guosheng (徐国盛), WANG Huiqian (汪惠乾), JIANG Min (蒋敏), et al.. Reciprocating Probe Measurements of L-H Transition in LHCD H-Mode on EAST[J]. Plasma Science and Technology, 2013, 15(7): 619-622. DOI: 10.1088/1009-0630/15/7/03 |
| [9] | WANG Fumin (王福敏), GAN Kaifu (甘开福), GONG Xianzu (龚先祖), EAST team. Temperature Distribution and Heat Flux on the EAST Divertor Targets in H-Mode[J]. Plasma Science and Technology, 2013, 15(3): 225-229. DOI: 10.1088/1009-0630/15/3/07 |
| [10] | Y. PIANROJ, T. ONJUN. Simulations of H-Mode Plasmas in Tokamak Using a Complete Core-Edge Modeling in the BALDUR Code[J]. Plasma Science and Technology, 2012, 14(9): 778-788. DOI: 10.1088/1009-0630/14/9/02 |
| 1. | Deng, R., Ming, T., Li, B. et al. VUV imaging of type-I ELM filamentary structures and their temporal characteristics on EAST. Plasma Science and Technology, 2024, 26(11): 114002. DOI:10.1088/2058-6272/ad621c | |
| 2. | Li, B., Ming, T., Li, Y. et al. Experimental and simulation studies on ELM characteristics under a plasma current ramping up discharge on EAST. AIP Advances, 2024, 14(5): 055030. DOI:10.1063/5.0205427 | |
| 3. | Deng, R.-J., Chen, L.-F., Ming, T.-F. et al. Edge detection of ELM filament structures by high-speed VUVI system on EAST | [EAST 装置高速 VUVI 系统对 ELM 丝状结构的边缘检测]. Hejubian Yu Dengliziti Wuli/Nuclear Fusion and Plasma Physics, 2023, 43(4): 450-456. DOI:10.16568/j.0254-6086.202304013 | |
| 4. | Li(李邦), B., Ming(明廷凤), T., Li(李彦龙), Y. et al. Experimental study on the spatial structures of filament during ELM crash in ELMy H-mode discharge on EAST. Plasma Physics and Controlled Fusion, 2023, 65(8): 085004. DOI:10.1088/1361-6587/acdcb9 | |
| 5. | Hou, S., Ming, T., Shi, Q. et al. Experimental observations of naturally occurring dust using a high-speed vacuum ultraviolet imaging system in EAST. Plasma Science and Technology, 2023, 25(5): 055101. DOI:10.1088/2058-6272/acaaef | |
| 6. | Ming, T.F., Tang, T.F., Shi, Q.Q. et al. Study on filament width of type-I ELM in EAST using VUV imaging system and simulation. Nuclear Fusion, 2022, 62(12): 126039. DOI:10.1088/1741-4326/ac95ad |
Figures(7) / Tables(1)
Supported by: Beijing Renhe Information Technology Co., Ltd. 
 DownLoad: