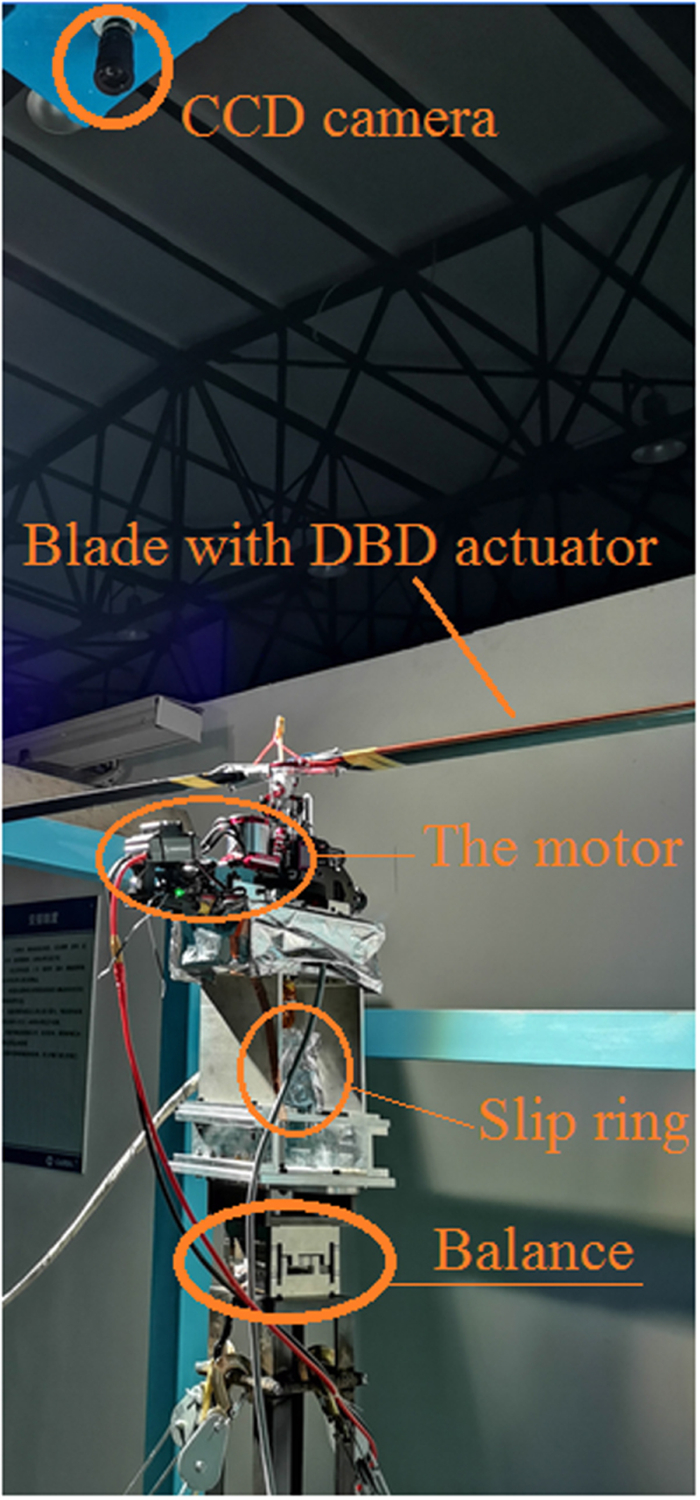
An experimental system was established to explore the plasma flow control effect for helicopter rotors in hover mode. With the plasma actuator applied at the leading edge of the rotor blades, alternating current dielectric barrier discharge (AC-DBD) plasma actuation was generated by a sinusoidal AC high-voltage generator. By direct force measurement, the influence of actuation parameters on the aerodynamic performance of the rotor was investigated at a tip Reynolds number of 1.7 × 10⁵. AC-DBD actuation can delay the blade stall to more than 3° with a 20% increase of about in the thrust coefficient at the post-stall pitch. At a constant motor power driving the rotor, AC-DBD actuation could reduce the rotor's torque at the stalled pitch and increase the rotational speed of the rotor. Also, AC-DBD actuation could maintain a relatively high hover efficiency of the rotor at large collective pitches. In a wide range of actuation parameters, AC-DBD plasma actuation could improve the rotor's aerodynamic performance at large blade pitches. High-speed photography of the tuft motion on the blade's upper surface showed that AC-DBD plasma actuation could promote the reattachment of the blade's separation flow.
When the high-power laser interacts with solid targets, a large number of escaped hot electrons are generated based on different absorbing and heating mechanisms, such as resonance absorption [1], vacuum heating [2], J×B heating [3], inverse bremsstrahlung [4], and the anomalous skin effect [5]. Some energetic electrons are ejected into the vacuum from the front target surface, and some are accelerated in the backward direction, which creates a separation field called the sheath field behind the target and the accelerating gradient can reach TV m−1 [6]. The strong sheath field ionizes atoms on the target surface and accelerates protons and ions to super high speed within an extremely short period, which is called Target Normal Sheath Acceleration (TNSA) [7]. Finally, the pulsed return current through the target holder compensates for the deficit of the electrons in the laser spots [8, 9].
In the above process, electromagnetic waves with broad frequency bands such as X-rays [10, 11] and γ-rays [12] are produced. Meanwhile, intense EMPs with the intensity of kV m−1 and even MV m−1 are induced [13‒15], and the electromagnetic spectra range from MHz to THz [16‒18], which can result in the malfunction of diagnostic equipment [19]. Therefore, it is of great significance to reveal the sources and determinable factors of EMPs inside the laser facility. Previous reports indicated that EMPs mainly stemmed from several sources including neutralization current, surface-sheath oscillations, charged layers due to photoionization, wakefields of accelerated charges, and charged particles on surfaces [20]. Many related possible factors including laser parameters [21, 22], target configuration and materials [13, 22‒27], and target holder geometry [21, 28‒30] were investigated. Accordingly, several strategies for the mitigation and control of EMPs were put forward [28, 29]. In our previous campaign, the distribution of EMPs outside the target chamber at high-power laser facilities has been systematically revealed [31].
However, the transmission characteristics of EMPs inside a high-power laser facility are unveiled, especially by taking into consideration the echo oscillation of the chamber. In this work, the transmission characteristics of EMPs inside the XG-III laser chamber are thus experimentally studied by arranging four identical B-dot probes. A well-designed experiment and a 3D simulation model are established to reveal the degradation of EMPs with the distance away from the center of the target chamber. The resulting conclusions are not only beneficial to gain more insight into the evolution of EMPs, but highly significant for shielding design to protect various critical equipment.
2.
Experimental arrangements
All EMP measurements were performed at the XG-III laser facility in the Science and Technology on Plasma Physics Laboratory of the China Academy of Engineering Physics, which is based on a Ti-doped sapphire laser. XG-III laser can output synchronized nanosecond, picosecond, and femtosecond beams with three wavelengths of 527 nm, 1053 nm, and 800 nm [32]. Moreover, by super continuum generation and femtosecond optical parametric amplification (OPA), three beams are generated from the same source to achieve precise synchronization [33, 34]. The experimental schematic diagram for EMP detection is presented in figure 1(a). In this experiment, the picosecond or femtosecond laser is vertically incident onto the front surface of a 10 μm copper foil target. The 10 μm copper foil target is mounted on the top of a cylindrical copper holder with a diameter of 3 mm and a length of 40 mm. Four picosecond laser shots and one femtosecond laser shot were performed and analyzed in this experiment. The detailed laser parameters are presented in table 1. The contrasts of picosecond and femtosecond laser are higher than 107 [24]. The focal spot sizes of picosecond laser and femtosecond laser are about 42 μm and 27 μm in diameter, respectively.
Table
1.
Detailed laser parameters in this experiment.
Figure
1.
(a) Experimental layout for EMP measurements inside the XG-III laser facility using four identical B-dot antennas and (b) measurement of the |S21| scattering parameter for the 10 m coaxial cable used in this experiment.
To reveal the spatial and temporal characteristics of EMPs inside the laser chamber, four identical magnetic field B-dot antennas, labelled as a1, a2, a3, and a4, are mounted inside the target chamber at different distances from the target chamber center (TCC). The B-dot antennas have a center frequency of 3.5 GHz, an equivalent receiving area of 3.14 mm2, and a diameter of 2 mm [35]. The TCC position is set to 0. The distances from TCC to the four antennas are 0.32 m, 0.53 m, 0.76 m, and 1 m. The four antennas are connected through 10 m double-shield SMA coaxial cables to an oscilloscope with a 13 GHz analog bandwidth and a 40 GS s−1 sampling rate protected by a Faraday cage situated outside the target chamber. Previous studies have shown that long cables are actually effective low-pass filters [36]. The |S21| scattering parameters of the 10 m double-shield SMA coaxial cable from 0.1 to 5 GHz were calibrated as presented in figure 1(b). Due to the high voltages of EMP signals, multiple attenuators are connected between the coaxial cable and the oscilloscope to ensure accurate measurement of the signals.
3.
Results and discussion
EMP amplitudes inside the vacuum chamber are presented in figure 2(a). The distribution of EMPs inside the vacuum chamber is intimately related to the distance from the TCC. With the increase of the distance from TCC, the corresponding mean amplitude values of EMPs generated by picosecond laser-target interaction are 450 V, 219 V, 251 V, and 187 V, and the EMP amplitudes generated by femtosecond laser-target interaction are 88 V, 43 V, 49 V, and 45 V. The EMP intensity E can be calculated by U(t)=−dφ/−dφdtdt, φ=BS, and E≈cB, where U(t) is the time domain signal, φ is the magnetic flux, c is the velocity of light in vacuum, S = 3.14 mm2 is the loop area, and B is the magnetic induction intensity [13, 37].
Figure
2.
Evolution of (a) EMP amplitude and (b) EMP intensity with the distance from TCC inside the target chamber.
EMP intensity inside the vacuum chamber is presented in figure 2(b). At the four detected spots, the mean EMP intensities induced by picosecond laser-target interaction are 561 kV m−1, 357 kV m−1, 395 kV m−1, and 341 kV m−1, which reach 109 kV m−1, 63 kV m−1, 73 kV m−1, and 67 kV m−1 for the femtosecond laser-target interaction. According to figure 2, with the increase of the distance from TCC, the EMP amplitude and EMP intensity decrease significantly from 0.32 m to 0.53 m, but no remarkable decreasing trend is observed from 0.53 m to 1 m, which even shows an increasing trend from 0.53 m to 0.76 m.
To gain further insight into the temporal characteristics of the EMP signals within the target chamber. The absolute value of the time-domain signal of EMPs at four positions generated by picosecond and femtosecond laser-target interaction is presented in figure 3. To further characterize the temporal profile of EMPs at different positions, the time-related parameter of full width at a half maximum (τFWHM) is interpreted, which is acquired through a classical double exponential pulse function BD(t) to get the envelope of EMP signal and the function can be expressed as [38–40]:
Figure
3.
Fitting of a double exponential pulse through the absolute value of the time-domain signal at four positions induced by (a) picosecond and (b) femtosecond laser-target interaction.
where B0 is the initial value of the source function, τdis and τch are the discharging and charging coefficients of the EMP emitter, respectively.
The fitting of the double exponential pulse of EMPs due to picosecond laser-target interaction is presented in figure 3(a). As the distance from the TCC increases, the corresponding values of τFWHM for antenna a1, a2, a3, and a4 are 25 ns, 52 ns, 74 ns, and 68 ns, respectively. For femtosecond laser-target interaction as presented in figure 3(b), the values of τFWHM for antenna a1, a2, a3, and a4 are 34 ns, 65 ns, 79 ns, and 90 ns, respectively. The experimental results indicate that compared with the antennas far from the target chamber wall (a1, a2), EMP signals closer to the target chamber wall (a3, a4) exhibit a higher value of full width at a half maximum (τFWHM). As shown in figure 4, we further calculate the values of τFWHM for all laser shots. The results further confirm that EMP signals closer to the target chamber wall (a3, a4) have a higher value of full width at a half maximum (τFWHM).
Figure
4.
Dependence of the full width at a half maximum τFWHM of the magnetic flux through the B-dot antennas on the distance from TCC.
To further investigate the EMP characteristics at four positions, the fast Fourier transformation (FFT) is conducted on the time-domain signal shown in figure 3(b). The amplitudes are then squared to give the power density spectra. As shown in figure 5, the result indicates that there are significant differences in the power density spectra of EMPs at four different positions. It can be seen that the frequencies of EMPs measured at positions a1 and a3 mainly range from 0.3 GHz to 2.5 GHz. For positions a2 and a4, EMPs are mainly found between 1.1 GHz and 2.1 GHz. Figure 5 shows EMPs at four different positions induced by femtosecond laser-target interaction with seven typical overlapped peaks appearing at 1.51 GHz, 1.62 GHz, 1.66 GHz, 1.71 GHz, 1.78 GHz, 1.84 GHz, and 1.875 GHz. The aforementioned characteristic peaks of the electromagnetic pulses can be primarily attributed to two factors. The first important factor is the neutralization current. Based on the quarter-wavelength dipole antenna model [9], the characteristic frequency of the electromagnetic pulse generated by the neutralization current can be expressed as:
Figure
5.
Power density spectra of time-domain EMP signals shown in figure 3(b) with different distances from TCC.
where c is the speed of light in vacuum and lh is the length of the target holder. Here, lh=40 mm, so fa=1.875 GHz, which is marked at the orange dashed line in figure 5.
The second factor can be attributed to the eigenfrequency radiation, which depends on the structure of the cylindrical target chamber. In the previous experimental campaign, three typical eigenfrequencies TE111, TM010, and TE011 were theoretically calculated based on the ideal cylindrical target chamber model, with values of 140.4 MHz, 104.9 MHz, and 202.4 MHz, respectively [24]. The three typical resonant frequencies are much lower than those marked by the blue dashed line as shown in figure 5, which may be mainly ascribed to various possible sources of EMPs and some internal real arrangements of the target chamber [41‒44].
To get the temporal evolution of the spectra, the Short-Time Fourier Transform (STFT) is applied to process EMP signals shown in figure 3(b), and the width of the windows is set to 512 [16]. The corresponding time-dependent spectrograms are shown in figure 6. The work detected electromagnetic pulses in four different locations (a1‒a4). Three characteristic frequencies (0.39 GHz, 0.75 GHz, and 1.875 GHz) were observed in a1 with a maximum duration of 45 ns. The pulse at a2 had one primary frequency peak (1.62 GHz) with a maximum duration of around 166 ns. Two primary peaks were detected at a3 (1.25 GHz and 1.66 GHz) with a maximum duration of approximately 100 ns. The pulse detected at a4 showed a significant peak at 1.66 GHz frequency with a maximum duration of approximately 142 ns. Obviously, the EMP signals near the target chamber wall (a2, a3, and a4) have the main frequency band with a longer lifetime compared to that away from the target chamber wall (a1).
Figure
6.
Time-dependent spectrogram of time-domain EMP signals shown in figure 3(b) with different distances from TCC (Power here is in arbitrary unit).
Therefore, the spatial and temporal characteristics of EMP signals at different locations are evidently different as the distance from TCC increases. The changing trends are possibly related to the reflection of electromagnetic waves by the target chamber wall and the metal components within the vacuum chamber [45]. To further investigate the transmission characteristics, a 3D model is developed based on the finite element method of simulation through the HFSS program. As shown in figures 7(a) and (b), the interaction chamber has a bottom radius R=1.1 m and height l=1.3 m according to the geometrical parameters of the XG-III target chamber [24]. One glass flange (left) and one metal flange (right) are set in the model. In the simulation, the target chamber wall and the metal flange are made of aluminum alloy with corresponding electric conductivity σ=3.8×10⁷Sm−1. As shown in figures 7(c) and (d), we remove the target chamber wall from the model to study the effect of the target chamber wall on EMP propagation. As presented in figure 7, a broadband current pulse with an amplitude of 2.5 kA and a period of 4 ns built in the HFSS program is set as a source for EMP generation at the center of the model. Through the aforementioned settings, the propagation characteristics of electromagnetic waves inside the XG-III target chamber can be studied approximately. The simulation results are shown in figure 7.
Figure
7.
The top view of the HFSS model for the propagation of EMPs inside the vacuum chamber for different times ((a), (b)) with the target chamber wall and ((c), (d)) without the target chamber wall.
Compared with figure 7(d) without the target chamber wall, figure 7(b) indicates that the electromagnetic waves continue to oscillate inside the target chamber due to the reflection by the target chamber wall. This is consistent with the results of previous experiments that the EMP duration is much larger than the charging and discharging time [41, 42, 46‒48]. Therefore, some high-performance microwave absorption materials can be installed on the inner wall of the laser target chamber in the future to restrain the oscillation of electromagnetic waves and mitigate EMPs inside the target chamber.
Moreover, the leakage of electromagnetic radiation from the glass flange is higher compared to the metal flange as shown in figure 7(b), which is consistent with a previous report that EMP intensity outside the target chamber is much lower than that inside the chamber due to the attenuation of the metal target chamber wall [49]. The glass flange is quite more transparent for the EMP compared to the metal flange [43, 50]. The results of the simulation and experiment show that EMPs leaking from glass flanges are likely the main source of EMPs outside the target chamber. So, the strategies for shielding the glass flange shall be the key to mitigating or controlling EMPs outside the target chamber.
Figure 8 shows EMP distribution according to simulations. For the case without the target chamber wall, EMP intensity decreases continuously with the distance from TCC due to the propagation loss of electromagnetic waves. However, in the presence of the target chamber wall, it shows no continuous decay, which also increases dramatically from 0.76 m to 1 m. Besides, at the same location, EMP intensity with the target chamber wall is much higher. The echo oscillation of electromagnetic waves inside the target chamber is responsible for the enhancement of EMPs. When EMPs reach the target chamber wall, they are partially attenuated due to absorption by the wall, while the remaining EMPs are reflected [51, 52]. The superposition of incident electromagnetic waves and reflected electromagnetic waves contributes to more intense EMPs, accounting for the stronger EMP closer to the target chamber wall. Furthermore, the electromagnetic waves can be both reflected by the metal target chamber wall and various metal objects inside the target chamber [45, 53‒56]. Therefore, the features of echo oscillation are affected by the real layout of the chamber, which further determines typical EMP frequency.
Figure
8.
Evolution of the EMP intensity with the distance from TCC with and without the target chamber wall.
To further validate the impact of electromagnetic wave echo oscillation and examine the shielding effectiveness of commercial copper shielding mesh with varying mesh numbers. We conducted two sets of experiments.
The experiment was performed at the SILEX-II multi-petawatt laser facility in the Science and Technology on Plasma Physics Laboratory of the China Academy of Engineering Physics [57]. The experimental schematic diagram is shown in figure 9(a), where a pulsed laser (30 J, 30 fs) with a main pulse to pre-pulse intensity contrast ratio of 1010 is used. The laser is vertically incident onto the front surface of the 5 μm copper foil target, which has a focal spot diameter of ~5 μm. A shielding box made of permalloy with a thickness of 3 mm was designed and fabricated. The shielding box is a hollow square box with one side open facing the glass flange as shown in figure 9(a). The distance from the shielding box to the target chamber center is 0.8 m. To evaluate the shielding effectiveness of electromagnetic pulses, two identical B-dot antennas are placed at positions b1 and b2 shown in figure 9. The peak shielding is obtained by calculating the ratio between the EMP amplitudes at b1 and b2. The EMP signals are also collected using an oscilloscope with a 13 GHz analog bandwidth and a 40 GS s−1 sampling rate protected by a Faraday cage situated outside the target chamber.
Figure
9.
(a) Schematic experimental arrangement of the SILEX-II. (b) Shielding box without polyurethane foams and (c) shielding box with polyurethane foams.
As shown in figure 9(b), we first tested the shielding effectiveness of copper shielding meshes with different mesh numbers. Then, as shown in figure 9(c), polyurethane foams with a thickness of 15 mm are filled into the shielding box to further study the echo oscillation of electromagnetic waves. Polyurethane foams have good microwave absorption properties and are widely used in microwave anechoic chambers [58]. The experimental result is shown in figure 10. The error bars presented in figure 10 are obtained by computing the standard deviation over the sample set.
Figure
10.
The shielding effectiveness of copper shielding meshes with different mesh numbers (The mesh number is defined as the number of openings per linear inch).
First, the shielding effects initially increase and then decrease with the increasing number of copper shielding meshes, and the peak shielding effect is observed for the mesh number of 50. According to the experimental results, the shielding effectiveness of copper shielding mesh could be associated with its mesh number and thickness. The shielding effectiveness of the copper shielding mesh improves as the mesh number increases from 10 to 50. The impact of mesh number on shielding effectiveness surpasses that of mesh thickness within this range. However, the thickness of the shielding mesh may have a more significant impact than the mesh number in the range of 50–200. As a result, the shielding effectiveness improves as the number of meshes increases. Copper shielding mesh is commonly used in high-power laser devices to reduce electromagnetic radiation interference on diagnostic equipment. The experimental results obtained from this study will provide guidance in choosing the appropriate copper shielding mesh.
Furthermore, it has been observed that filling polyurethane foam inside the shielding box increases the attenuation of the EMP amplitude when compared to the shielding box without such filling. The experimental result may partially confirm the occurrence of echo oscillation of electromagnetic waves. Additionally, this approach proposes a strategy to alleviate electromagnetic pulses in high-power laser facilities. By pasting a high-performance microwave absorption material layer on the inner wall of the laser target chamber, the electromagnetic waves generated by laser target interaction can be absorbed as much as possible by the microwave absorption material layer instead of being reflected by the target chamber wall, thereby reducing the echo oscillation of electromagnetic waves, ultimately leading to a reduction of electromagnetic pulses.
4.
Conclusions
The transmission characteristics of EMPs inside the XG-III vacuum chamber are analyzed. the maximum EMP intensity induced by picosecond and femtosecond laser-target interaction reaches 561 kV m−1 and 109 kV m−1, respectively. As the distance from TCC increases from 0.32 m to 0.53 m, both EMP amplitudes and EMP intensity show decreasing tendencies, but no significant decrease is found from 0.53 m to 1 m, which even shows an increasing trend from 0.53 m to 0.76 m. Moreover, EMP signals near the target chamber wall have a larger value of full width at a half maximum compared to the antennas far from the target chamber wall. Simulation and experiment confirm that the reflection of electromagnetic waves by the target chamber wall inside the vacuum chamber is responsible for EMP evolution. Moreover, the experiment also revealed that the shielding effectiveness of commercial copper shielding mesh first increases and then decreases with the mesh number from 10 to 200, and the peak shielding effect is observed for the mesh number of 50.
Starikovskiy A, Meehan K and Miles R B 2018 Dynamic stall control by NS SDBD actuator Proc. of 2018 AIAA Aerospace Sciences Meeting (Kissimmee) (AIAA) (https://doi.org/10.2514/6.2018-0681)
Starikovskiy A, Persikov N and Miles R 2018 Helicopter lift force increase in hover mode by NS-SDBD plasma actuators Proc. of 2018 AIAA Aerospace Sciences Meeting (Kissimmee) (AIAA) (https://doi.org/10.2514/6.2018-0936)
Kelley C L et al 2012 High Mach number leading-edge flow separation control using AC DBD plasma actuators Proc. of the 50th AIAA Aerospace Sciences Meeting including the New Horizons Forum and Aerospace Exposition (Nashville) (AIAA) (https://doi.org/10.2514/6.2012-906)

 DownLoad: