Figure
1.
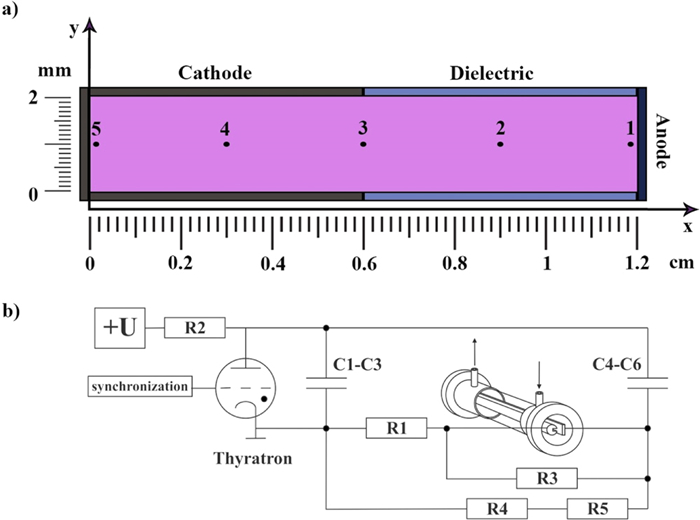
Schematic diagram of the experimental system.
| Citation: |
N A ASHURBEKOV, K O IMINOV, K M RABADANOV, G S SHAKHSINOV, M Z ZAKARYAEVA, M B KURBANGADZHIEVA. Simulation of the spatio-temporal evolution of the electron energy distribution function in a pulsed hollow-cathode discharge[J]. Plasma Science and Technology, 2023, 25(3): 035405. DOI: 10.1088/2058-6272/ac9aa8

|
This article presents the 2D simulation results of a nanosecond pulsed hollow cathode discharge obtained through a combination of fluid and kinetic models. The spatio-temporal evolution of the electron energy distribution function (EEDF) of the plasma column and electrical characteristics of the nanosecond pulsed hollow cathode discharge at a gas pressure of 5 Torr are studied. The results show that the discharge development starts with the formation of an ionization front at the anode surface. The ionization front splits into two parts in the cathode cavity while propagating along its lateral surfaces. The ionization front formation leads to an increase in the fast isotropic EEDF component at its front, as well as in the anisotropic EEDF component. The accelerated electrons enter the cathode cavity, which significantly contributes to the formation of the high-energy EEDF component and EEDF anisotropy.
Laser-induced breakdown spectroscopy (LIBS) is a typical atomic emission spectroscopy technique that forms plasma by converging pulsed lasers to the sample surface and then analyzes the plasma emission spectrum to determine the sample's element composition and content. Because LIBS uses a pulsed laser as an excitation source, it has many advantages over traditional analysis methods: simultaneous excitation and detection of multiple elements; remote noncontact telemetry, fast analysis speed, and in situ and online detection can be realized; and laser ablation can analyze the sample at different depths. Based on this point, LIBS is widely used in many fields, including geological minerals [1], Mars exploration [2], environmental monitoring [3], organic compounds [4], aerosol analysis [5], nuclear fusion materials [6], industrial materials [7], etc. However, the temporal and spatial heterogeneity of laser-induced plasma leads to poor repeatability of the LIBS signal and low accuracy of quantitative analysis. This seriously restricts the commercialization and industrial application of LIBS technology.
To solve the above problems, numerous researchers have proposed many methods to improve the repeatability of LIBS. These methods mainly include two aspects: spectral pretreatment and experimental setup. In terms of spectral pretreatment, some physical parameters that can reflect the fluctuation and change of plasma in real-time are used for spectral standardization or normalization of samples to be analyzed. These physical parameters include the acoustic signal generated when the laser interacts with the sample [8], plasma-related parameters (temperature or electron number density) [9], plasma image [10], background [11], integral intensity of full spectrum or partial spectrum [12], etc. By changing the experimental parameters, researchers attempt to obtain a more stable plasma emission spectrum. It mainly includes the effects of laser pulse energy [13, 14], energy distribution [15], focusing spot geometry [16], lens-to-sample distance (LTSD) [17], spatial constraint [18], and ambient gas pressure [19] on signal repeatability.
In the previous work, we used diffractive optical element (DOE) to shape and converge the Gaussian beam output from the laser into a flat-top spot, and compared the stability and quantitative analysis performance of Gaussian and flat-top focusing spot induced breakdown spectroscopy [15, 20]. The results show that, the flat-top focusing spot obtained more constant ablation, more stable spectral intensity, better correlation calibration curve and lower limit of detection. However, DOE is expensive, and we find that there are lasers based on Gaussian mirror output with quasi flat-top laser beam in the market. Its convergence spot characteristics and its influence on the stability of spectral signal in LIBS are not clear. In this work, we study the change of energy distribution characteristics of flat-top laser converging spot with LTSD and its influence on the spatial uniformity and emission spectrum of plasma, and further explore the optimal excitation and acquisition scheme.
Figure 1 shows the LIBS system used in this work. The excitation source was a Nd: YAG pulse laser (Dawa-100, Beamtech Optronics, China) with a wavelength of 1064 nm, a repetition frequency of 1 Hz, a single pulse energy of approximate 50 mJ, and the RSD of its energy is about 1%. Based on the use of Gaussian mirror, it can output laser beams with quasi flat-top energy distribution. After passing through the beam expander, the initial pulse is reflected by a 45-degree mirror and converges to the surface of the stainless-steel sample through an aspherical lens (#89-442, Edmund Optics, USA) with a focal length of 100 mm. The sample used in this work is standard stainless-steel (GBW 01683, Shandong Metallurgical Research Institute, China). The sample and the emitted light collection lens can be adjusted up and down, and their distance and angle remain unchanged. The plasma emissions are focused to the fiber end face and transmitted to the 4-channel optical fiber spectrometer (AvaSpec-ULS2048-4-USB2, Avantes, Netherlands), with an acquisition delay of 1.28 μs and an integration time of 1.05 ms. The plasma image is taken by ICCD (DH734I-18F-03, Andor, UK) equipped with a suitable lens, and its time is set the same as that of the spectrometer. During the experiment, LTSD was reduced from 106 to 89 mm, each time by 0.5 mm. Due to the limitation of ICCD acquisition range, when LTSD≥95.5 mm, ICCD rises once to obtain a complete plasma image.
The energy distribution characteristics of the initial laser beam were experimentally measured by using a beam profile camera (pyrocam iiihr, Ophir photonics, USA). The results show that it has a quasi flat-top distribution. According to Huygens–Fresnel principle, each point of the wavefront can be regarded as the point wave source generating spherical secondary waves, and the wavefront at any time in the future can be regarded as the envelope of these secondary waves. The rigorous mathematical description of the relevant diffraction theory is beyond the scope of this study. Optical simulation software and Pyrocam IIIHR are used to simulate and measure the energy distribution characteristics of converging spot. As shown in figure 2, both theoretical simulations and experimental measurements show that the flat-top beam produces spots with inhomogeneous intensity in the focal plane or intermediate plane. At the focal plane, there is a bright spot in the central area of the diffraction pattern generated by the flat-top beam, which is called the Airy pattern together with a series of concentric rings around it. In the case of defocusing, the energy distribution of the laser convergent spot has an uneven profile between the flat-top and ring.
The incident laser is perpendicular to the sample surface. For the convenience of the following description, we define the coordinate axis of the plasma image taken by ICCD. As shown in figure 3, the direction parallel to the sample surface is defined as the X-axis, the laser incident direction is defined as the Y-axis, where the intensity in the coordinate axis is the sum of image pixel intensities (SIPI) along the other direction. For better clarity, all of the images are normalized to their maximum intensity.
With the decrease of LTSD (the rise of the sample surface), the X-axis distribution characteristics of the plasma image are shown in figure 4. When 106 mm≥LTSD≥96 mm, the X-axis line shape of the plasma image is similar to the Gaussian function. When the sample surface is slightly higher than the focal plane of the lens, the spatial distribution of the X-axis of the plasma is more uniform. Figure 5 shows the variation of the area (A) and the full width at half maxima (FWHM) of the Gaussian fitting with LTSD. The area has a maximum value, and the FWHM has a minimum value near the focus. When LTSD≥103 mm, the FWHM does not continue to rise due to the influence of air breakdown.
With the continuous decrease of LTSD, the laser convergence spot gradually increases, and the top of the X-axis integral intensity gradually becomes flat. When LTSD≤93 mm, double peaks begin to appear in the plasma image, and the distance between the two peaks gradually increases, as shown in figure 6. This is in agreement with the energy distribution of the laser convergence spot shown in figure 2. The results show that the spatial distribution of plasma strongly depends on the energy distribution of laser convergence.
The Y-axis distribution characteristics of SIPI change with LTSD, as shown in figure 7. With the decrease of LTSD, SIPI first increases and then decreases, and there is a maximum near the focus.
As shown in figure 8, the plasma center, that is, the maximum value of the Y-axis, decreases with increasing LTSD. By linear fitting LTSD and plasma center position, the goodness of fitting is 0.99888. Based on this point, it can be estimated that the rise height of 0.5 mm per sample is approximately equal to 36 pixels. The distance between the plasma center and the sample surface, that is, the flying height of the plasma, has a maximum near the focus.
As shown in figure 9, with the decrease of LTSD (the rise of sample surface), the sample plasma gradually approaches and coincides with the air breakdown. However, it is obvious that the position of air breakdown is not fixed. Relevant studies show that the air plasma expands or propagates reversely along the laser incident direction [21], and the velocity increases with the laser energy [22]. We consider that this phenomenon may be due to the diffusion of the sample plasma, which reduces the breakdown threshold of the front air, promotes the air to produce more plasma, and then absorbs more laser energy due to the shielding effect of the plasma.
The normalized SIPI and sum of full spectrum intensity (SFSI) are shown in figure 10(a), and their Pearson correlation coefficient (PCC) is 0.74854. The SIPI and SFSI have some correlation, but there is a significant difference when LTSD < 95.5 mm and LTSD > 100 mm. This is mainly due to the inconsistency between the two acquisition areas. When the convergence spot is below the focal plane, the plasma image contains the intensity of air breakdown. Correspondingly, when the converging spot is above the focal plane, double peaks appear in the plasma image. Correspondingly, the spectral acquisition area is always limited to the vicinity of the plasma core. That is, when the laser converging spot is separated from the focal plane for a certain distance, the image range captured by ICCD greatly exceeds the spectrum acquisition range. The normalized intensities of the seven feature spectra are shown in figure 10(b). The mean PCCs of the feature spectra with SIPI and SFSI are 0.4738 and 0.9033, respectively. The mean value of the PCC between the characteristic spectra was 0.9777. It is shown that the characteristic spectra are more correlated with each other, more correlated with SFSI and less correlated with SIPI.
The RSD of SIPI and SFSI, and the average RSD of 7 spectral peak intensities are shown in figure 11. Their average values are
The aim of the present research was to evaluate the effect of LTSD on the spatial uniformity and emission spectrum of plasma induced by flat-top laser convergent spot. The laser energy distribution after beam expansion and convergence is an Airy spot at the focal plane and a nonuniform flat-top-like distribution out of focus. Under the existing experimental configuration, the distance between the air breakdown spot and the sample plasma gradually decreases as the LTSD decreases when the sample is below the focal plane. When LTSD=103 mm, the air plasma is combined with the sample plasma. The sample is near the focus, and the plasma has the maximum distance from the plasma center to the sample surface. When the sample surface is slightly higher than the focal plane, the spatial distribution of the plasma is more uniform, the plasma width gradually increases as the LTSD decreases, and a double peak starts to appear when LTSD≤93 mm. Since the spectrum acquisition area is limited to only the plasma core,
This work was supported by the Russian Foundation for Basic Research (No. 20–32–90150) and by State Assignment (No. FZNZ–2020–0002).
| [1] |
Trunec D, Bonaventura Z and Nečas D 2006 J. Phys. D: Appl. Phys. 39 2544 doi: 10.1088/0022-3727/39/12/012
|
| [2] |
Hoder T et al 2016 Plasma Sources Sci. Technol. 25 025017 doi: 10.1088/0963-0252/25/2/025017
|
| [3] |
Yuan C X et al 2017 Phys. Plasmas 24 073507 doi: 10.1063/1.4990030
|
| [4] |
Tejero-del-Caz A et al 2021 Plasma Sources Sci. Technol. 30 065008 doi: 10.1088/1361-6595/abf858
|
| [5] |
Tsendin L D 2010 Phys. -Usp. 53 133 doi: 10.3367/UFNe.0180.201002b.0139
|
| [6] |
Phelps A V 1994 J. Appl. Phys. 76 747 doi: 10.1063/1.357820
|
| [7] |
Hagelaar G J M and Pitchford L C 2005 Plasma Sources Sci. Technol. 14 722 doi: 10.1088/0963-0252/14/4/011
|
| [8] |
Ashurbekov N A et al 2010 Tech. Phys. 55 1138 doi: 10.1134/S1063784210080104
|
| [9] |
Ashurbekov N A and Iminov K O 2016 Generation of highenergy electrons in the nanosecond gas discharges with a hollow cathode ed V F Tarasenko Generation of Runaway Electron Beams and X-Rays in High Pressure Gases (New York: Nova Publishers) 421
|
| [10] |
Ashurbekov N A et al 2020 Plasma Sci. Technol. 22 125403 doi: 10.1088/2058-6272/abbb78
|
| [11] |
Morgan W L and Penetrante B M 1990 Comput. Phys. Commun. 58 127 doi: 10.1016/0010-4655(90)90141-M
|
| [12] |
Stephens J C 2018 Phys. Plasmas 25 103502 doi: 10.1063/1.5047809
|
| [13] |
Winkler R et al 1985 Beitr. Plasmaphys. 25 351 doi: 10.1002/ctpp.19850250405
|
| [14] |
Kolobov V I and Godyak V A 1995 IEEE Trans. Plasma Sci. 23 503 doi: 10.1109/27.467971
|
| [15] |
Li C et al 2012 Plasma Sources Sci. Technol. 21 055019 doi: 10.1088/0963-0252/21/5/055019
|
| [16] |
Kolobov V I and Tsendin L D 1992 Phys. Rev. A 46 7837 doi: 10.1103/PhysRevA.46.7837
|
| [17] |
Raizer Y P 1991 Gas Discharge Physics (Berlin: Springer)
|
| [18] |
Lieberman M A and Lichtenberg A J 2005 Principles of Plasma Discharges and Materials Processing 2nd edn (New York: Wiley)
|
| [19] |
MATLAB 2018 9.7.0.1190202 (R2019b). The MathWorks
Inc., Natick, Massachusetts
|
| [20] |
THE LoKI-B SIMULATION TOOL (https://github.com/ISTLisbon/LoKI)
|
| [21] |
Phelps database (https://us.lxcat.net/home/)
|
| [22] |
Bogaerts A and Gijbels R 1995 Phys. Rev. A 52 3743 doi: 10.1103/PhysRevA.52.3743
|
| [23] |
Vasilyak L M et al 1994 Phys. Usp. 37 247 doi: 10.1070/PU1994v037n03ABEH000011
|
| [24] |
Ashurbekov N A et al 2017 Plasma Sci. Technol. 19 035401 doi: 10.1088/2058-6272/19/3/035401
|
| [1] | Ying Wang, Nie Chen, Jingfeng Yao, Evgeniy Bogdanov, Anatoly Kudryavtsev, Chengxun Yuan, Zhongxiang Zhou. Towards the creation of an inverse electron distribution function in two-chamber inductively coupled plasma discharges[J]. Plasma Science and Technology. DOI: 10.1088/2058-6272/adb895 |
| [2] | Tianhang MENG (孟天航), Zhongxi NING (宁中喜), Daren YU (于达仁). Impact of exterior electron emission on the self-sustaining margin of hollow cathode discharge[J]. Plasma Science and Technology, 2020, 22(9): 94001-094001. DOI: 10.1088/2058-6272/ab7902 |
| [3] | Chunxia LIANG (梁春霞), Ning WANG (王宁), Zhengchao DUAN (段正超), Feng HE (何锋), Jiting OUYANG (欧阳吉庭). Experimental investigations of enhanced glow based on a pulsed hollow-cathode discharge[J]. Plasma Science and Technology, 2019, 21(2): 25401-025401. DOI: 10.1088/2058-6272/aaef49 |
| [4] | Shuichi SATO, Hiromu KAWANA, Tatsushi FUJIMINE, Mikio OHUCHI. Frequency dependence of electron temperature in hollow cathode-type discharge as measured by several different floating probe methods[J]. Plasma Science and Technology, 2018, 20(8): 85405-085405. DOI: 10.1088/2058-6272/aabfcd |
| [5] | Shoujie HE (何寿杰), Peng WANG (王鹏), Jing HA (哈静), Baoming ZHANG (张宝铭), Zhao ZHANG (张钊), Qing LI (李庆). Effects of discharge parameters on the micro-hollow cathode sustained glow discharge[J]. Plasma Science and Technology, 2018, 20(5): 54006-054006. DOI: 10.1088/2058-6272/aab54b |
| [6] | Mingming SUN (孙明明), Tianping ZHANG (张天平), Xiaodong WEN (温晓东), Weilong GUO (郭伟龙), Jiayao SONG (宋嘉尧). Plasma characteristics in the discharge region of a 20A emission current hollow cathode[J]. Plasma Science and Technology, 2018, 20(2): 25503-025503. DOI: 10.1088/2058-6272/aa8edb |
| [7] | HAN Qing (韩卿), WANG Jing (王敬), ZHANG Lianzhu (张连珠). PIC/MCC Simulation of Radio Frequency Hollow Cathode Discharge in Nitrogen[J]. Plasma Science and Technology, 2016, 18(1): 72-78. DOI: 10.1088/1009-0630/18/1/13 |
| [8] | ZHAO Guoming(赵国明), SUN Qian(孙倩), ZHAO Shuxia(赵书霞), GAO Shuxia(高书侠), ZHANG Lianzhu(张连珠). The Effect of Gas Flow Rate on Radio-Frequency Hollow Cathode Discharge Characteristics[J]. Plasma Science and Technology, 2014, 16(7): 669-676. DOI: 10.1088/1009-0630/16/7/07 |
| [9] | HE Feng (何锋), HE Shoujie (何寿杰), ZHAO Xiaofei (赵晓菲), GUO Bingang (郭滨刚), OUYANG Jiting (欧阳吉庭). Study of the Discharge Mode in Micro-Hollow Cathode[J]. Plasma Science and Technology, 2012, 14(12): 1079-1083. DOI: 10.1088/1009-0630/14/12/08 |
| [10] | WENG Ming (翁明), XU Weijun (徐伟军). The Influence of Electrode Surface Mercury Film Deformation on the Breakdown Voltage of a Sub-Nanosecond Pulse Discharge Tube[J]. Plasma Science and Technology, 2012, 14(11): 1024-1029. DOI: 10.1088/1009-0630/14/11/12 |
Figures(5) / Tables(1)
Supported by: Beijing Renhe Information Technology Co., Ltd. 
 DownLoad: