The electron cyclotron emission (ECE) diagnostic system has been developed on the ENN spherical torus (EXL-50). The ECE system is designed to detect radiation emitted by energetic electrons, rather than conventional 1D electron temperature profile measurement, in the frequency range of 4−40 GHz. The system is composed of five subsystems, each covering a different frequency band, including the C-band (4−8 GHz), X-band (8−12 GHz), Ku-band (12−18 GHz), K-band (18−26.5 GHz) and Kα-band (26.4−40 GHz). The system uses heterodyne detection to analyze the received signals. The K-band and Kα-band subsystems are located horizontally in the equatorial plane of the EXL-50, while the C-band, X-band and Ku-band subsystems are located under the vacuum vessel of the EXL-50. To direct the microwaves from the plasma to the antennas for the horizontal detection subsystems, a quasi-optical system has been developed. For the vertical detection subsystems, the antennas are directly attached to the port located beneath the torus at R = 700 mm, which is also the magnetic axis of the torus. The system integration, bench testing and initial experimental results will be thoroughly discussed, providing a comprehensive understanding of the ECE system’s performance and capabilities.
The measurement of electron cyclotron emission (ECE) is a valuable technique for evaluating plasma parameters in magnetic confinement devices. The ECE system provides a high spatial and temporal resolution of the electron temperature profile, provided that the optical thickness condition is met [1]. In typical magnetic confinement devices, the magnetic field ranges from several Tesla. The frequency of the ECE radiation, which is proportional to the magnetic field, falls in the millimeter wave range. Over the past several decades, various techniques have been developed to measure ECE radiation, including Fourier transform spectrometry [2], Fabry–Pérot interferometry [3], grating polychromators [4] and heterodyne radiometers [5, 6]. Heterodyne radiometry is a commonly used technique for ECE measurements as it offers high temporal and spatial resolution. This technique has been developed and applied to various fusion devices, for example JET [7], DIII-D [8], JT-60U [9], HL-2A [10] and EAST [6].
Future fusion devices will require steady-state operation with a high plasma current, where a significant fraction of the total plasma current will be generated by the bootstrap current and non-inductive current driven by auxiliary systems. In the lower density domain, lower hybrid current drive (LHCD) is a highly efficient method for generating non-inductive current [11]. The use of LHCD generates a non-Maxwellian electron velocity distribution function with high-energy tails. The presence of these superthermal electrons breaks the optical thickness assumption and enables the ECE diagnostic for measuring the energetic electron distribution perpendicular to the magnetic field [12, 13].
Fundamental X-mode electron cyclotron resonance heating (ECRH) is a highly efficient current drive method during the start-up regime and has the potential to enhance the design of solenoid-free fusion reactors [14]. In EXL-50 ECRH, O-mode operation is used during the plasma start-up phase. During the plasma low-density regime, energetic electrons can be generated by the high power ECRH. The optical depth, τ, could be less than 1 for the energetic electrons, i.e., the optical thin condition is satisfied. However, the strong relativistic frequency down-shift will affect the interpretation of data [15]. A forward model with a fully relativistic absorption coefficient including the non-thermal distribution has been used to interpret the ECE data with high power ECRH in ASDEX Upgrade [16]. The non-thermal electrons produced by electron cyclotron current drive could severely distort the ECE temperature profile measured calculated by the NOTEC code [17]. ECE can still be a powerful tool for evaluating the emission of energetic electrons.
The paper is structured as follows. In section 2, the system design of the ECE system, as well as an introduction to the EXL-50 device, is presented. Section 3 showcases the experimental results obtained from the ECE system. Finally, section 4 provides a summary of the findings and conclusions drawn from the study.
2.
System design
This section will introduce the EXL-50 ST device, providing essential background information on the tokamak and its operation. After presenting the properties of the EXL-50 device, the section focuses on the design and installation of the ECE diagnostic system.
2.1
The EXL-50 spherical torus
Compared to conventional tokamaks, the spherical torus (ST) has a lower aspect ratio of around 1.5, which is defined as the ratio between the major radius R and the minor radius a of the device [18]. Experiments on ST devices, such as START [19], NSTX [20] and MAST [21], have shown that they can achieve higher plasma beta compared to conventional tokamaks. The compact design of ST devices also makes them a potential better candidate device for commercial fusion.
The EXL-50 device is based on the concept of the ST but with the central solenoid (CS) coils removed to address the limitation of space in the central post. The device is designed to achieve a plasma current, Ip, of 500 kA, with a magnetic field of 0.41 T at a distance of 0.5 m from the device’s center. The major and minor radii of EXL-50 are 0.58 m and 0.39 m, respectively. In the absence of the CS coils, the plasma current in the EXL-50 device is driven and maintained solely by ECRH. In the EXL-50 experiments, the plasma current can reach as high as 80–100 kA at the line-integrated density at 0.8×10¹⁹ m−2 [22]. The EXL-50 device is equipped with five gyrotrons, which are used to generate high-power microwaves for ECRH. One of the gyrotrons has a power output of 50 kW at a frequency of 28 GHz, operating in O-mode. Three of the gyrotrons generate microwaves at a frequency of 28 GHz and the output power of 200 kW, and two of them operating in O-mode and one in X-mode. The fifth gyrotron generates microwaves at a frequency of 50 GHz and a power output of 200 kW, operating in X-mode. Experimental results from the EXL-50 device have shown that the plasma current is primarily carried by energetic electrons both inside and outside the separatrix [23]. The energetic electrons inside the last closed-flux surface (LCFS) with energy range from 20 keV to 600 keV have been detected using a hard X-ray diagnostic array [24]. Given this energetic electron distribution, there is a need for energetic particle diagnostics.
2.2
Frequency of the ECE diagnostics
The frequency of the ECE is determined by the magnetic field, given by equation
ω=neBγm,
(1)
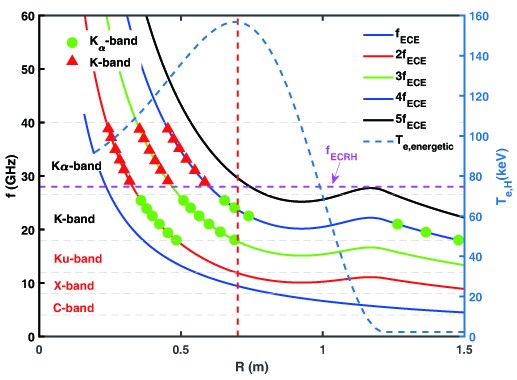
where m is the electron mass, B is the magnetic field and n=1,2,3 is the harmonic number. γ=(1−(v/c)2)−1/2 is the relativistic factor, which is very important for energetic electrons. The frequency of the ECE diagnostics for EXL-50 is shown in figure 1. The frequency of the ECRH is indicated by the vertical dashed line in the graph, while the radial profile of the energetic electrons, given by the three-fluid equilibrium, is shown by the dashed curve. The three-fluid equilibrium consists of two electron fluids with different temperatures and one ion fluid has been successfully applied to the TST-2 spherical tokamak [25]. The ECE diagnostic system, which operates at frequencies ranging from 4 to 40 GHz, is composed of five frequency bands: C-band (4−8 GHz), X-band (8−12 GHz), Ku-band (12−18 GHz), K-band (18−26.5 GHz) and Kα-band (26.5−40 GHz).
Figure
1.
The frequency of the ECE diagnostics on the EXL-50 ST. The dashed curve shows the profile of the energetic electrons given by three-fluid equilibrium. The solid curves show the ECE with the from fundamental to its fifth harmonics. The triangles and circles denote the radial locations of the K- and Kα-band subsystems.
The ECE diagnostic system is composed of five subsystems, each designed to operate within a specific frequency band. On the EXL-50 device, the ECE diagnostic system uses the K- and Kα-bands for horizontal detection from the low-field side, while the C-, X- and Ku-bands are used for vertical detection from the bottom of the device. This configuration is shown by the vertical dashed line in figure 1.
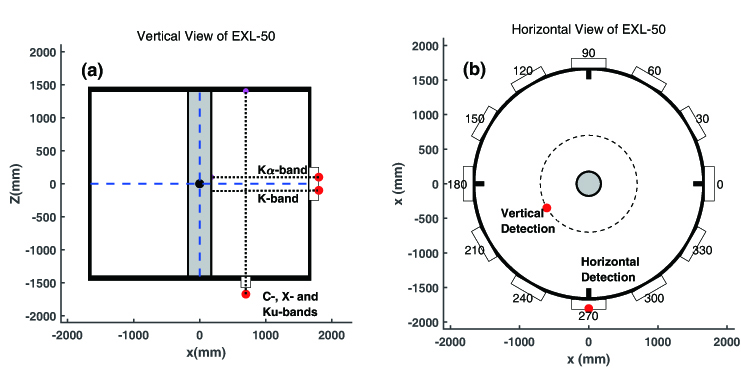
The ECE diagnostic system on the EXL-50 device can detect both fundamental and higher frequencies of ECE microwaves from the low-field side in the mid-plane. It is important to note that, on the EXL-50 device, the ECE microwaves emitted by the energetic electrons at fundamental and higher harmonics are optically thin. Therefore, these microwaves cannot be used to accurately calculate the temperature of the energetic electrons. The subsystems operating in the K- and Kα-band frequencies are employed for ECE measurements from the low-field side and for determining the entire emission power spectrum within this frequency range. The radial and poloidal locations of the ECE subsystems are shown in figure 2.
Figure
2.
The detection location of the ECE subsystems. (a) Vertical view of the detection location of the ECE subsystems. The K- and Kα-band subsystems detect horizontally from the low-field side, and the C-, X- and Ku-band subsystems detect vertically at R = 0.7 m. (b) Birds-eye view of the detection location of the subsystems. The vertical detection is located at 210° and the horizontal detection is located at 270° ports.
ECE measurements at lower frequencies are utilized to detect the vertical region around the magnetic axis, i.e., R = 0.7 m, with the objective of tracking the time evolution of energetic electrons. The detection frequencies of the ECE subsystems are summarized in table 1. The receiving bandwidth after the amplifiers for every channel is 250 kHz.
Table
1.
Physical objective and frequencies of the ECE subsystem.
The system layout, integration and installation will be given in detail in this section.
2.3.1
K- and Kα-band subsystems
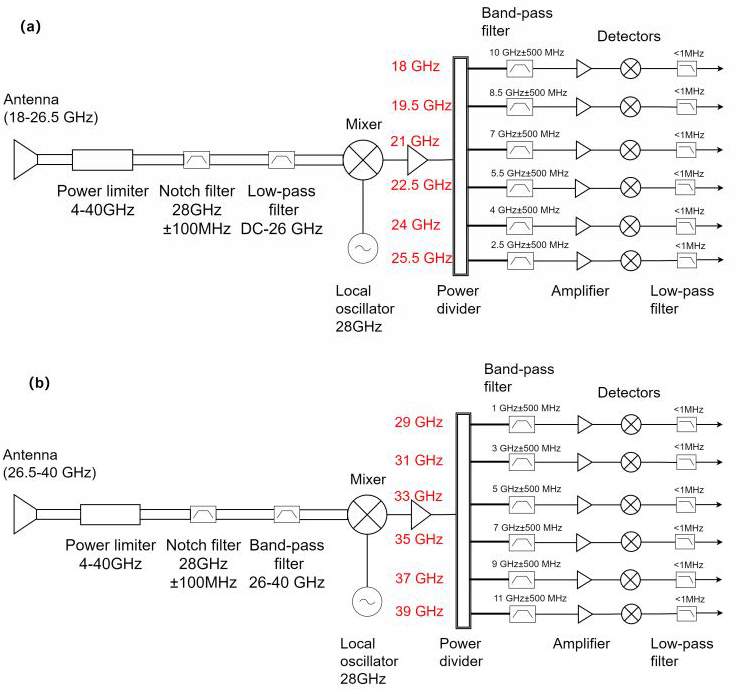
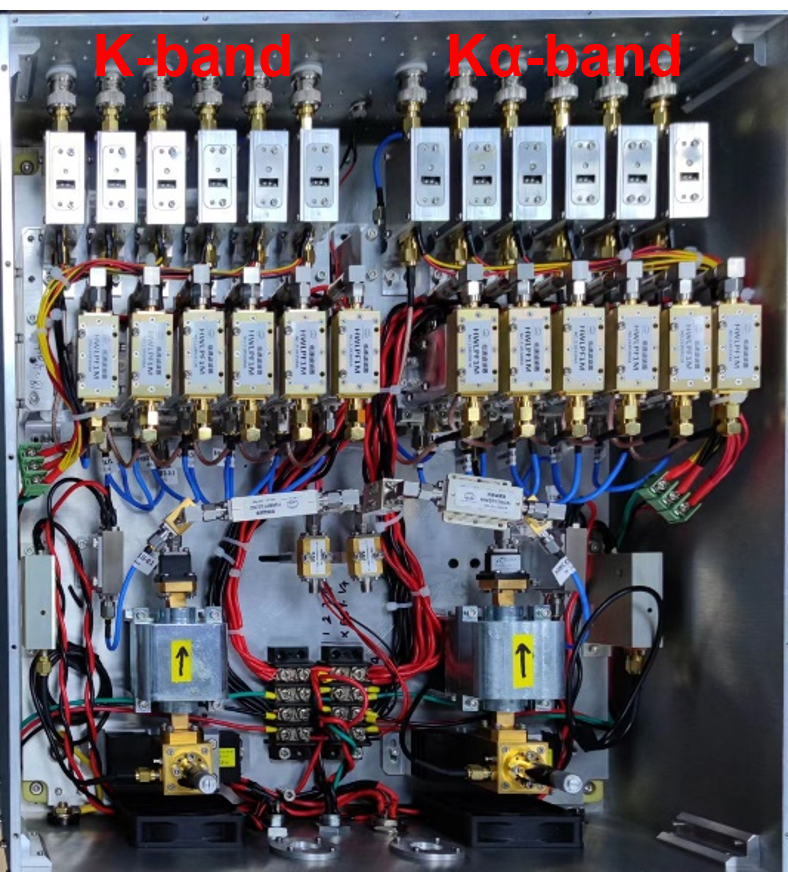
As mentioned above, when the heating and current drive on EXL-50 use ECRH alone, the components of the K- and Kα-band subsystems can be damaged by the stray radiation from the ECRH collected by the antennas. For each subsystem, a notch filter with a bandwidth of 100 MHz and high attenuation of 60 dB is employed. A Gens oscillator at the frequency of 28 GHz, same as the frequency of ECRH, is used as a local oscillator to lower the frequency of the detected ECE signals. The output power of the oscillator is 20 dBm and phase-locking is applied. Low-pass and band-pass filters are employed to enhance the system’s signal-to-noise ratio, and their parameters presented as shown in figure 3. Low-noise amplifiers with a noise figure of 2.5 are used after the mixer and filters. After the detector, the detected signals are amplified using amplifiers with four selectable gains of 10 dB, 13 dB, 17 dB and 20 dB, each with a noise figure of 3.0. The maximum power of the stray electron cyclotron radiation is estimated to be several Watts after being received by the antennas. A power limiter with a working frequency range of 4−40 GHz is employed to protect the system from strong stray electron cyclotron radiation. The power limiter has a maximum leakage power of 13 dBm and a maximum peak power of 2 W. A photograph of the two subsystems is shown in figure 4.
Figure
3.
The layout of the subsystems. (a) The K-band and (b) the Kα-band.
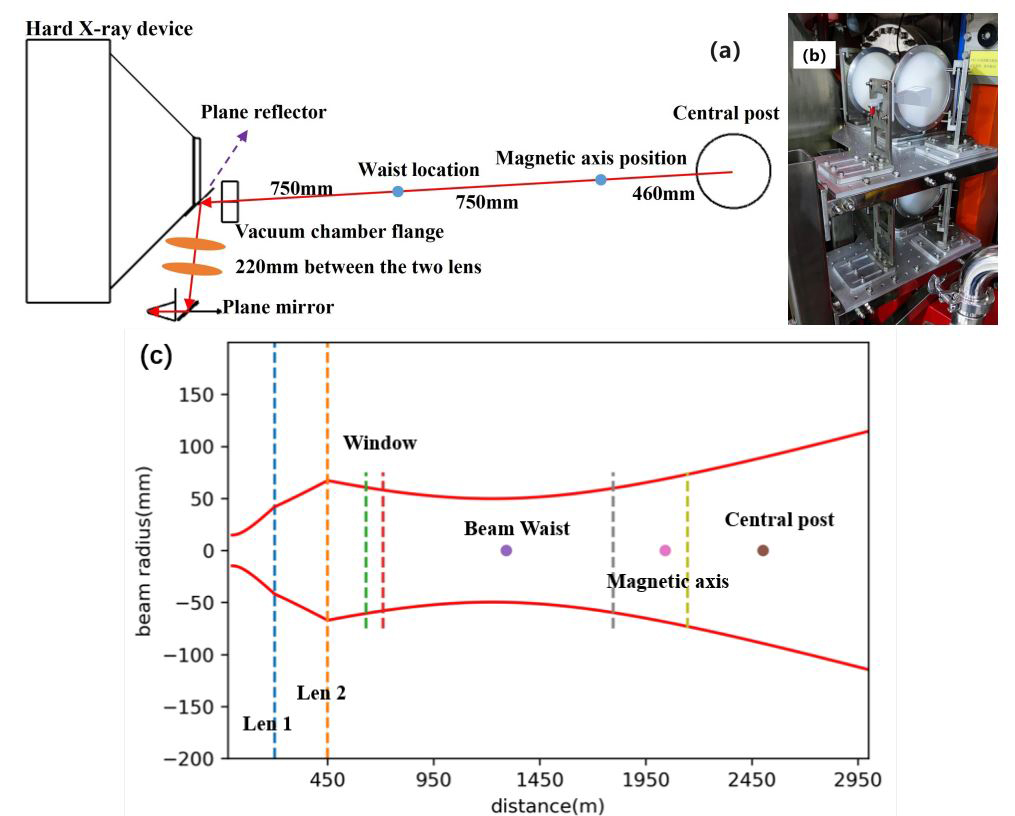
A quasi-optical system has been designed and installed for horizontal detection, sharing the same detection port as a hard X-ray array. Two convex lenses at the diameter of 150 mm are used to adjust the beam waist location, as shown in figure 5(a). The quasi-optical system is used to redirect the ECE emitted from the plasma with Kα- and K-band at the top and bottom, respectively. A photograph of the quasi-optical systems is shown in figure 5(b). It should be mentioned that the radius of the detection window for horizontal detection is 75 mm, so the beam waist is located at 1210 mm away from central post, i.e., outside the separatrix of the plasma. The lead shielding of the hard X-ray array detectors restricts the distance of the plane reflector to the detection port to less than 10 mm, making it challenging to place the beam waist at the magnetic axis. The location of the beam is moved away from the magnetic axis, so the maximum ECE power of the energetic electrons can be collected by the antennas. The beam profile at each location is given in figure 5(c). A Gaussian beam approximation is utilized based on the specific pattern of the horn antenna implemented in each subsystem. The antennas have a gain exceeding 20 dBi, a side-lobe suppression greater than 12 dB and a 3 dB bandwidth less than 18° for both the Kα- and K-band subsystems.
Figure
5.
The layout of the subsystems. (a) Schematic of the quasi-optical system for horizontal observation and (b) photograph of the installed optical system. (c) The beam profile at each location.
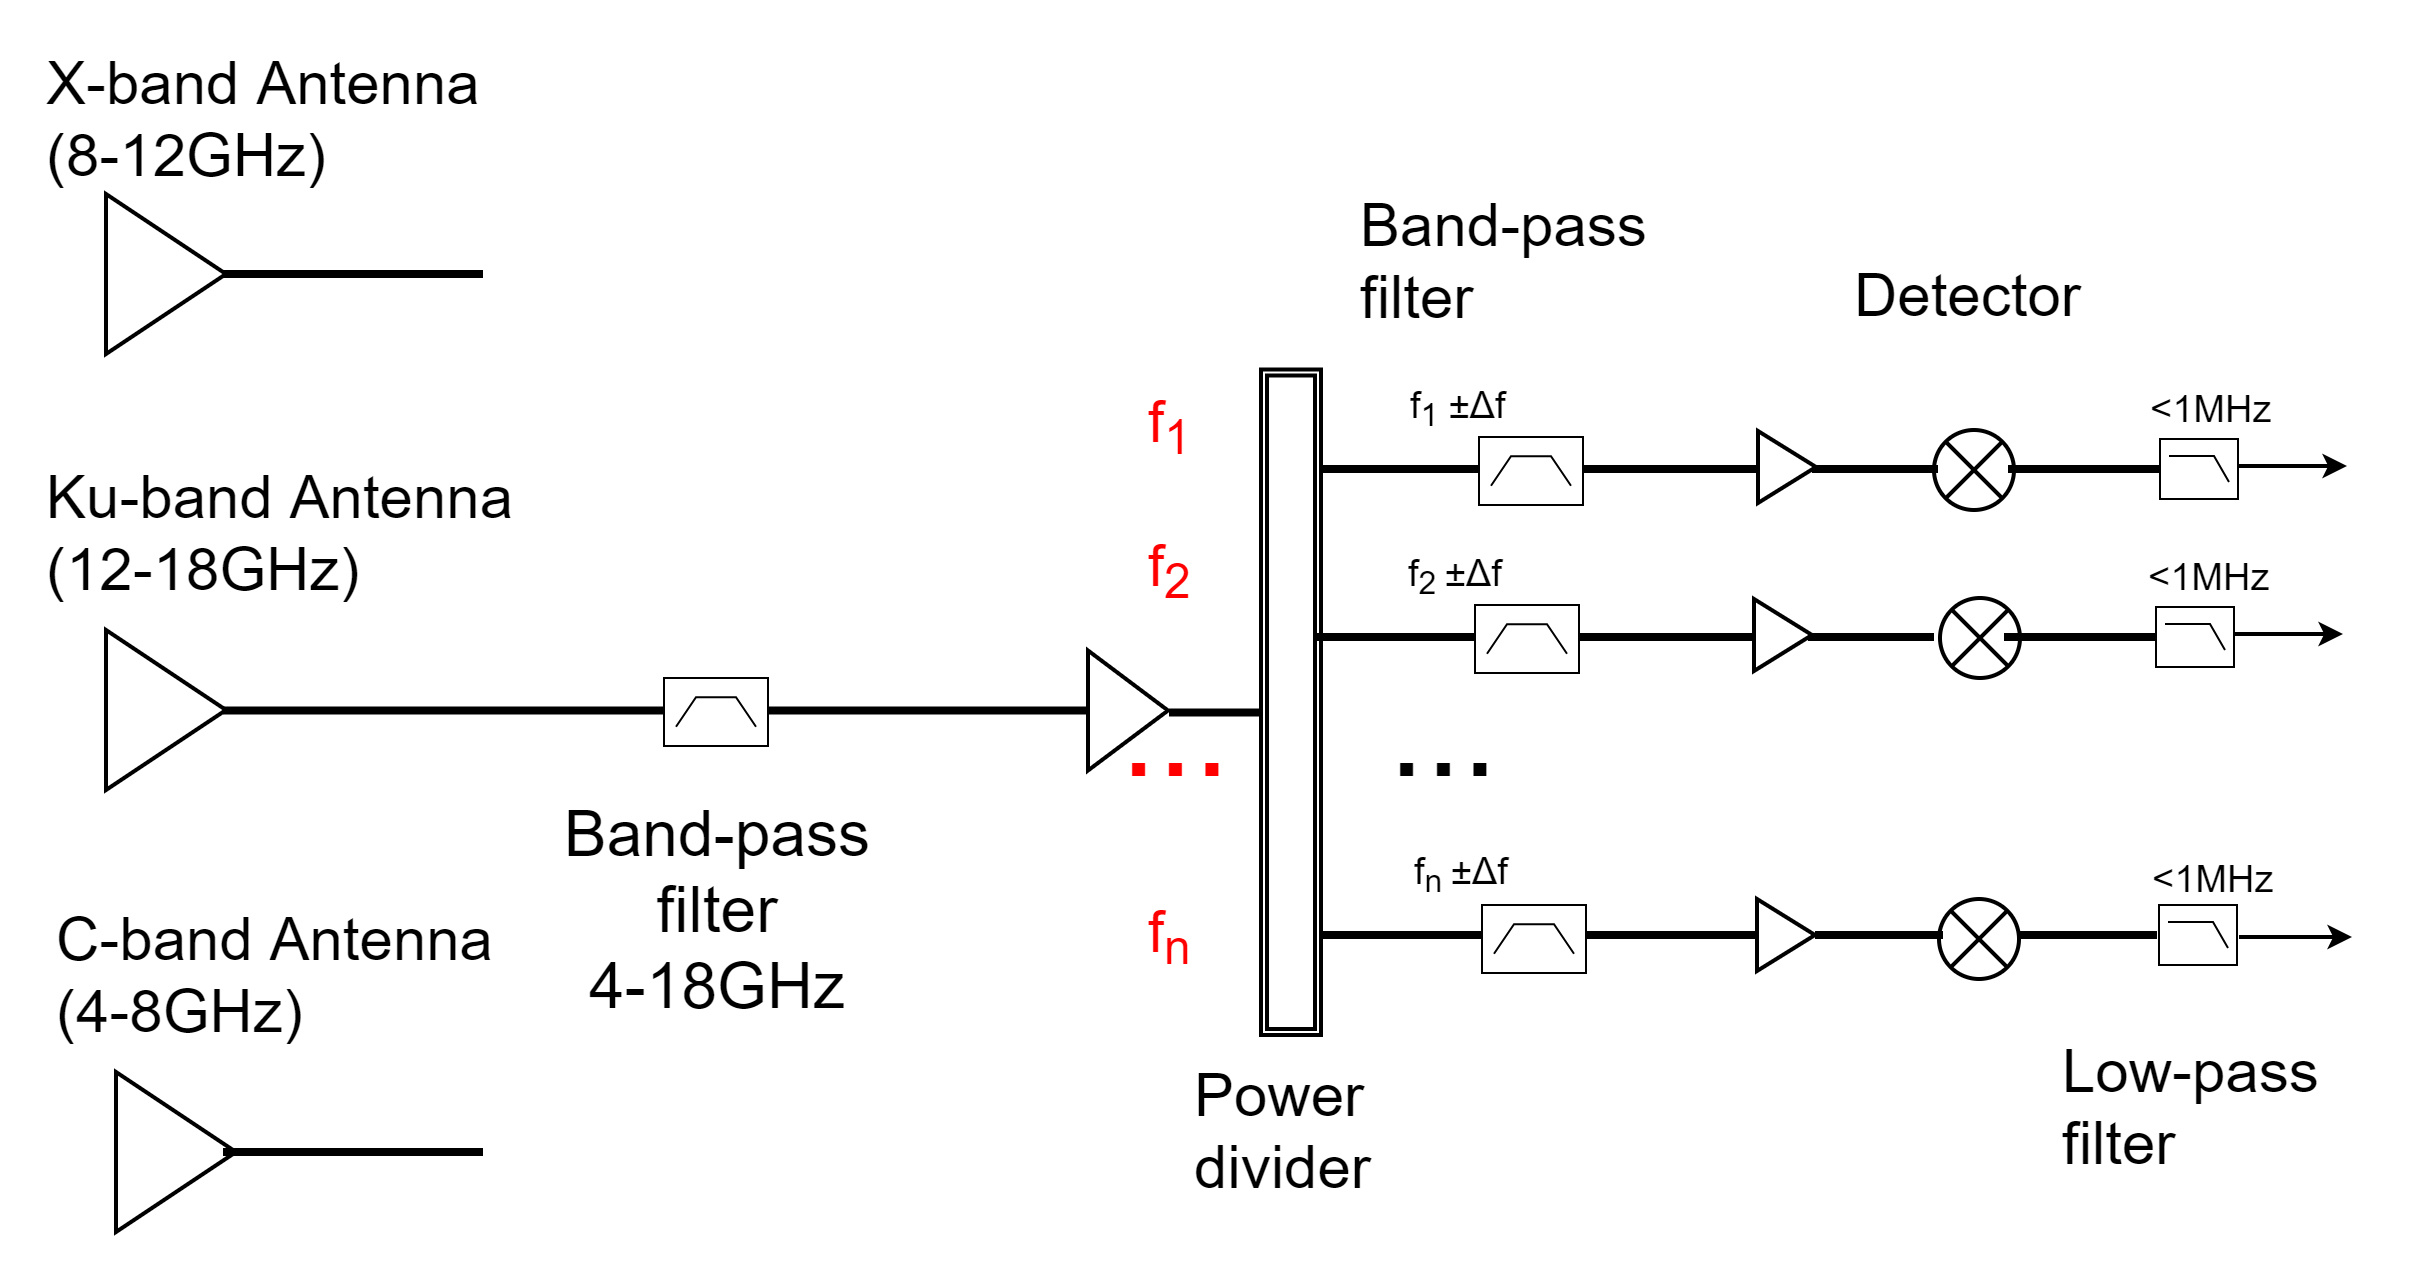
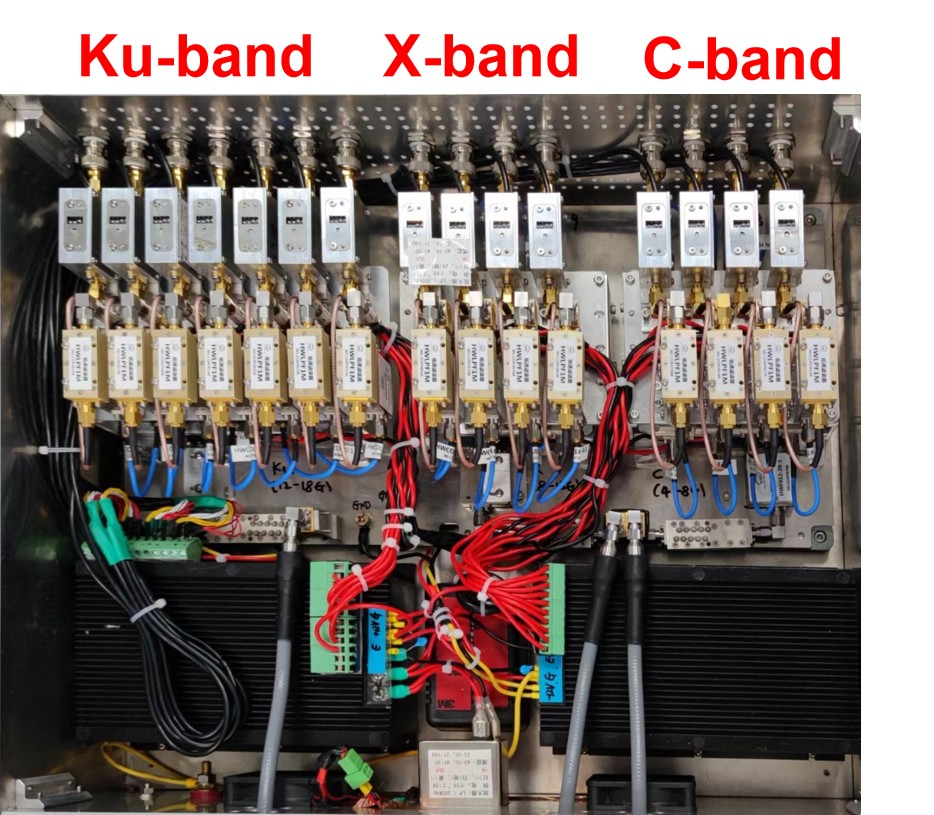
Three ECE systems operating at lower frequencies are developed on EXL-50. The schematic of the subsystems is shown in figure 6. Table 1 provides the detection frequencies of the subsystems. The integrated subsystems are shown in figure 7. As the lower-frequency ECE systems do not require notch filters or local oscillators, the system can be made more compact. Low-loss cables with the cut-off frequency at 18.5 GHz are used to connect the antenna and other parts of the subsystems, which isolate the stray electron cyclotron radiation.
Figure
6.
The schematic of the X-, C- and Ku-band subsystems. The width of the band-pass filter is 1 GHz, i.e., Δf = 500 MHz.
The detection horns and lenses are suspended vertically from the bottom of the vacuum vessel for the lower-frequency ECE systems. Due to the limitations of the detection space, only one subsystem can be used during experiments. The Ku- and X-band subsystems utilize antennas with a gain greater than 20 dBi and a 3 dB bandwidth less than 19°. In contrast, the C-band subsystem employs an antenna with a gain of 15 dBi and a 3 dB bandwidth of approximately 30°. This results in more significant non-localized measurements that require improvement in future updates.
3.
Experimental results
This section presents the preliminary experimental results, which are aimed at evaluating the performance of the ECE diagnostics.
3.1
ECE signals at high plasma densities
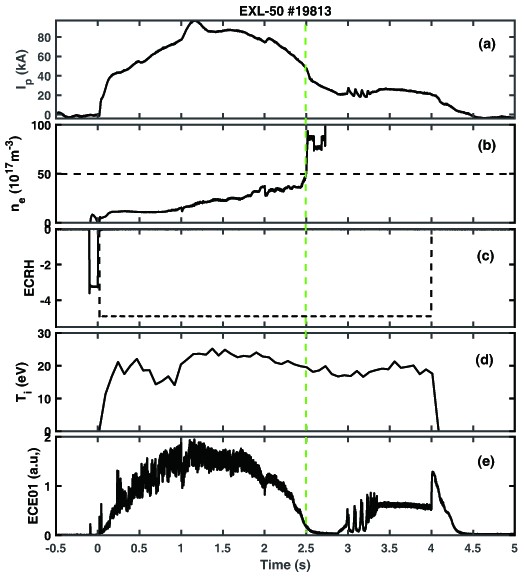
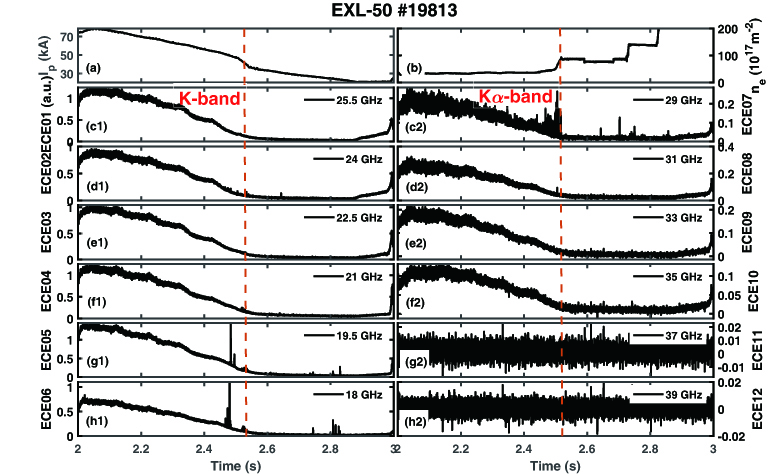
The time traces of EXL-50 shot No. 19813 are shown in figure 8. In this shot, the plasma is ionized by ECRH at 50 kW, shown by the solid curves in figure 8(c), and maintained by ECRH at 170 kW, shown in the broken curves in figure 8(c). The electron density increases abruptly by gas puffing at 2.5 s, as shown in figure 8(b). The ion temperature remains almost unchanged, as shown in figure 8(d). Both the plasma current and the ECE intensity decrease sharply as the electron density increases, which indicates the cutoff of the ECE at high density. The time evolutions of ECE signals measured by the K- and Kα-band subsystems are shown in figure 9. It is found that the cutoff of ECE signals is observed in every channel of the K- and Kα-bands subsystems. It is worth noting that the time evolutions of the plasma current and the ECE intensity for each channel exhibit the same trend. A large noise level can be found in the low-density phase, i.e., at the time range from 0 s to 2.5 s, possibly due to stray electron cyclotron radiation. No significant changes were observed in the last two channels, with detection frequencies at 37 GHz and 39 GHz, of the Kα-band subsystem, mainly because their cold resonance locations of the detection go further into the center post at this magnetic field. It can be seen that the amplitudes of the detected ECE signals of the two subsystems is quite different, as shown in figure 9. The difference in amplitude could be attributed to the separation in the antenna systems used in the two subsystems. To accurately measure the spectrum of ECE produced by energetic electrons, absolute calibration of the subsystems is necessary.
Figure
8.
The waveforms of the EXL-50 shot No. 19813. (a) The plasma current, (b) the line averaged plasma density, (c) the ECRH signals, (d) the ion temperature and (e) the ECE intensity in the K-band subsystem with the frequency at 25.5 GHz, which detects horizontally from the low-field side in the mid-plane.
Figure
9.
Time traces of the ECE intensities for K- and Kα-band subsystems. (a) and (b) The plasma current and density, respectively. (c1)–(h1) The detected signals from the K-band subsystem. (c2)–(h2) The detected signals from the Kα-band subsystem.
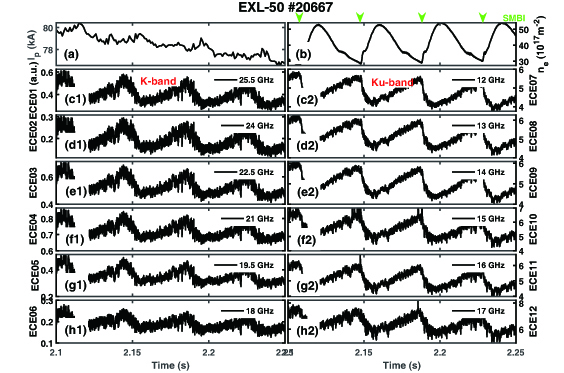
The density can be modulated by supersonic molecular beam injection (SMBI) and the time evolution of shot No. 20667 with SMBI can be found in figure 10. The results indicate that the intensity of the ECE signals for both K- and Ku-band subsystems changes in correlation with the plasma current, while the intensity of ECE signals is inversely correlated with the plasma density. The observed behavior of the signals suggests that the number of energetic electrons decreases at higher density due to increased collisionality, while it increases at lower density due to lower collisionality. The ECE signals for the K- and Kα-band subsystems display significant fluctuations, including spikes, which could be attributed to stray ECRH radiation.
Figure
10.
Time traces of the ECE intensities for K- and Ku-band subsystems during density modulation experiments using SMBI. (a) and (b) Plasma current and density, respectively. (c1)–(h1) The detected signals from the K-band subsystem. (c2)–(h2) The detected signals from the Ku-band subsystem.
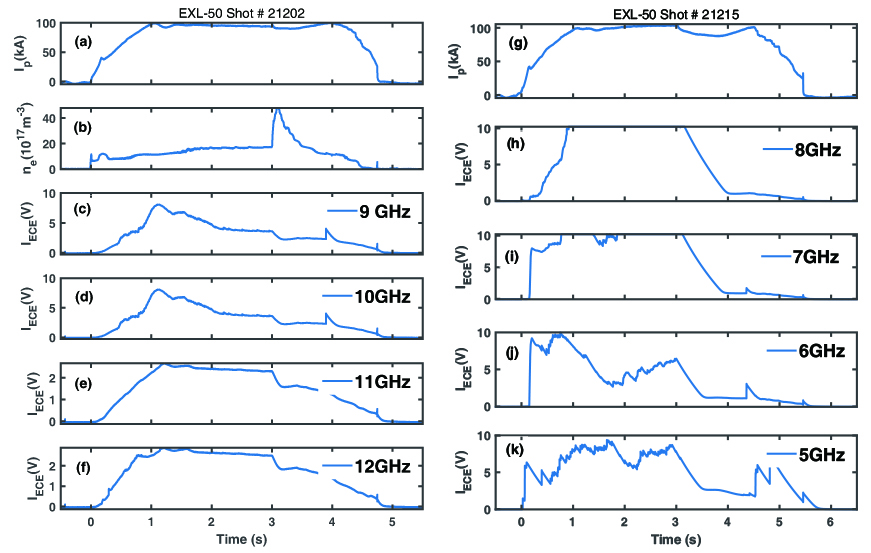
The X- and C-band subsystems are also tested on EXL-50, and the signals are shown in figure 11. It is clearly found that the intensity of the ECE correlates with the plasma current, which is similar to other subsystems. Two channels of C-band subsystems saturated at high plasma current due to the high gain of amplifier, which will be addressed in the future. It should be pointed out that the C-, X- and Ku-band subsystems use one vertical port, so only one subsystem can be used in one shot.
Figure
11.
Time traces of shot Nos. 21202 and 21215. The X-band subsystem is used in shot No. 21202 and shown in subpanels (c)–(f), and the C-band subsystem used in shot No. 21215 is shown in (h)–(k).
The ECE diagnostic system for energetic electrons has been developed and installed on the EXL-50 ST. The system consists of five subsystems, i.e., the C-, X, Ku-, K and Kα-band subsystems. The K- and Kα-band subsystems detect horizontally to measure the radiation spectrum for energetic electrons with energy ranging from 20 keV to 600 keV. These subsystems share the same diagnostic ports as high X-ray array diagnostics and use quasi-optical systems to redirect the ECE signals. The C-, X- and Ku-band subsystems detect vertically from the bottom of the device and will eventually be used to evaluate the time evolution of the energetic electrons. Preliminary results show that the amplitude of the ECE signals correlate with the plasma current.
Future updates of the system are needed. Firstly, the absolute calibration of the subsystem using hot sources is needed to measure the spectrum of the ECE from energetic electrons. Currently, the intensity of ECE measured by two separate subsystems cannot be used to evaluate the ECE spectrum. Secondly, the gain of the amplifier needs to be optimized since the signal saturated at higher plasma current. An update to the quasi-optical system is required in terms of diagnostic port arrangement, which will enable the beam waist to be set within the plasma region. Fluctuations are observed in the K- and Kα-band subsystems when ECRH is applied and further investigation is required to identify methods for resolving this issue. One potential solution is to use a power limiter with a higher maximum peak power. After these updates, the velocity distribution of the energetic electrons could be also estimated together with ray-tracing models such as SPECE [26]. A significant part of the detected radiation could be directed synchrotron radiation, which needs further simulation and experiments to interpretate the measured ECE signals.

 DownLoad: