State Key Laboratory of Advanced Electromagnetic Technology, International Joint Research Laboratory of Magnetic Confinement Fusion and Plasma Physics, School of Electrical and Electronic Engineering, Huazhong University of Science and Technology, Wuhan 430074, People’s Republic of China
2.
Southwestern Institute of Physics, Chengdu 610041, People’s Republic of China
3.
See the author list of “Wang N et al 2022 Nucl. Fusion 62 042016”
Stabilization of tearing modes and neoclassical tearing modes is of great importance for tokamak operation. Electron cyclotron waves (ECWs) have been extensively used to stabilize the tearing modes with the virtue of highly localized power deposition. Complete suppression of the m/n = 2/1 tearing mode (TM) by electron cyclotron resonance heating (ECRH) has been achieved successfully on the J-TEXT tokamak. The effects of ECW deposition location and power amplitude on the 2/1 TM suppression have been investigated. It is found that the suppression is more effective when the ECW power is deposited closer to the rational surface. As the ECW power increases to approximately 230 kW, the 2/1 TM can be completely suppressed. The island rotation frequency is increased when the island width is reduced. The experimental results show that the local heating inside the magnetic island and the resulting temperature perturbation increase at the O-point of the island play dominant roles in TM suppression. As the ECW power increases, the 2/1 island is suppressed to smaller island width, and the flow shear also plays a stabilizing effect on small magnetic islands. With the stabilizing contribution of heating and flow shear, the 2/1 TM can be completely suppressed.
Extreme ultraviolet (EUV) lithography is one of the most promising photolithography technologies in the semiconductor manufacturing sector, emerging as a key technique for achieving smaller feature sizes and fulfilling the continuous advancement demands of Moore’s Law [1]. In EUV lithography, the use of a 13.5 nm wavelength extreme ultraviolet light source enables higher resolution and thereby meets the requirements for decreasing the size of semiconductor devices [2]. As EUV lithography technology continues to advance, an increasing series of technical challenges has arisen. One of them is the ionization of the buffer gas by the EUV radiation within the chamber during the lithography process, which is known as EUV-induced plasma. This plasma engages in complex physical or chemical reactions with the surfaces of the optical components in the lithography equipment, and thereby jeopardizes the performance and lifespan of the apparatus [3].
In recent years, many researchers have dedicated their work to understanding the dynamic behavior of EUV-induced plasma and its impact on the performance of EUV lithography equipment. For example, van der Velden et al [4] numerically studied the characteristics of EUV-induced argon (Ar) plasma near multilayer mirrors. Their results suggested that the energy of Ar+ ions may exceed the physical sputtering threshold of the mirror surface, and potentially cause damage to the mirror. Wieggers et al [5] conducted particle-in-cell (PIC) simulations of the EUV-induced Ar plasma near the collector, where they analyzed the effects of the source intensity and background gas pressure on the plasma flux and energy. Their research revealed that Ar2+ ions are the primary source that causes the most sputtering damage to the mirror surfaces. In addition, their results indicated that the surface damage was not sensitive to the background gas pressure, while an increase in light source intensity led to a significant increase in the sputtering yield.
In addition to argon, hydrogen (H) is another choice of buffer gas that can be used in the chambers of EUV lithography. Unlike argon, hydrogen plasma does not cause significant physical sputtering damage to the mirror surfaces due to its low mass [6]. Moreover, the active chemical characteristics of hydrogen make it more effective in removing carbon contamination and oxide layers from the surfaces of optical components [7, 8]. However, as the smallest particles, H atoms can easily penetrate the material surfaces through the lattice interstitial gaps, diffuse in the bulk, accumulate around defects and finally lead to blistering [9]. Experiments evidenced that the size and number of the blisters are closely related to the ion flux and energy of the plasma [10, 11]. However, understanding of the dynamics of the low-density hydrogen plasma, especially in the vicinity of complex-shaped optical components, is still limited.
In this work, 1d3v PIC simulations were conducted to reveal the dynamic evolution of EUV-induced hydrogen plasma near the reflective mirrors in an EUV lithography scanner. The characteristics of the sheath, as well as the influence of background gas pressure and source intensity on the ion energy and flux of the plasma, were discussed.
2.
Model and method
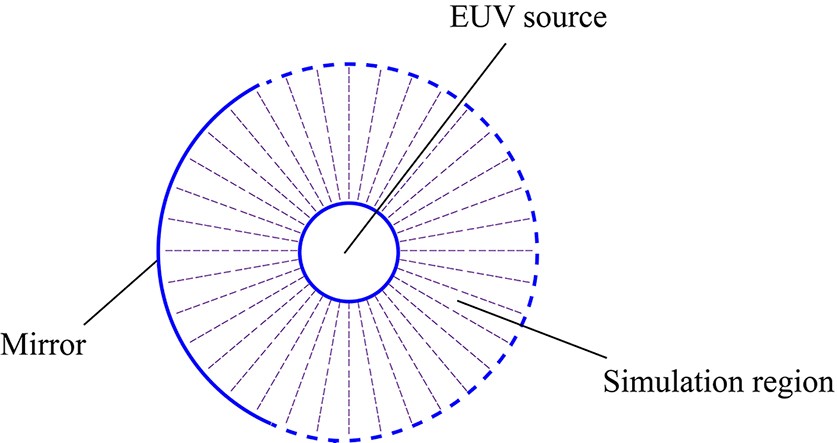
In this study, the simulation code of the traditional PIC method was independently developed using C++ to simulate the dynamic evolution of hydrogen plasma near the mirrors of the EUV source. The simulated region was chosen to be the space between two concentric spheres, as depicted in figure 1. The inner sphere represents the EUV source, while the outer sphere represents the mirror surface, with radii of 3 cm and 8 cm, respectively. The simulation domain contains about 108 super particles, each representing 106 real particles. These super particles possess three-dimensional position and velocity. Given the symmetry of the problem, the spherical coordinate system was employed and the electric potential distribution was obtained by solving a one-dimensional Poisson equation, forming what is known as the 1d3v model. The Poisson equation was solved by using the finite difference method. The motion equation of particles was solved by employing the well-known frog jumping algorithm. The detailed algorithm can be found in reference [12]. An absorption boundary condition was applied in all directions, which means that all the electrons and ions that reach the walls will be removed from the simulation immediately. Due to the low density of the plasma, recombination reactions between electrons and ions are not considered. The specific parameters of the model are listed in table 1.
Figure
1.
Schematic diagram of the simulation region, where the outer circle represents a simplified mirror surface and the inner circle represents a simplified light source.
Because the photoionization of hydrogen by EUV light is very complex, we did not consider the interaction between EUV and hydrogen since our focus is the dynamics of the hydrogen plasma. The photoionization process was taken into consideration by using the Lambert−Beer absorption law [13]:
Nph=Ihν{1−exp[−nσL(1+R)]},
(1)
where Nph is the total number of photoionization events, I is the source intensity, h is the Planck constant, ν is the photon frequency, n is the background gas density, σ is the cross-section corresponding to the photoionization type, L=5cm is the distance between the EUV source and the mirror, and R=0.68 is the reflection coefficient of the mirror.
In this study, three photoionization mechanisms are considered, i.e. non-dissociative ionization, single dissociative ionization and double dissociative ionization, which are represented respectively by equations (2)‒(4) as follows:
H2+hν→H+2+e−
(2)
H2+hν→H++H+e−
(3)
H2+hν→2H++2e−
(4)
For 92 eV EUV photons, the cross-sections of the three photoionization processes are 4.6×10⁻²⁴ m2 [14], 1.4×10⁻²⁴ m2 [14] and 0.27×10⁻²⁴ m2 [15], with energy thresholds of 15.4 eV [14], 18.1 eV [14] and 48.9 eV [15], respectively. Note that among the three ionization mechanisms, the non-dissociative ionization reaction corresponding to reaction (2) has the largest cross-section and thus is expected to occupy the largest proportion in the total ionization events.
During a photoionization reaction, considering the significant difference in mass between electrons and ions and the laws of momentum and energy conservation, it can be inferred that electrons will acquire most of the energy. Therefore, in our simulation, it is assumed that all the energy of the photons is transferred to the electrons, while the energy of the ions conforms to a Maxwellian distribution at room temperature [16].
2.2
Particle collisions
In addition to the ionization reactions between photons and the background gas, ions and electrons will also engage in various types of collision reactions with the background gas. In this study, we employed the Monte-Carlo method [17] to control collisions between various charged particles and the background gas. For electrons, we consider the following collision reactions:
e−+H2→e−+H2
(5)
e−+H2→e−+H∗2
(6)
e−+H2→H+2+2e−
(7)
e−+H2→H++H+2e−
(8)
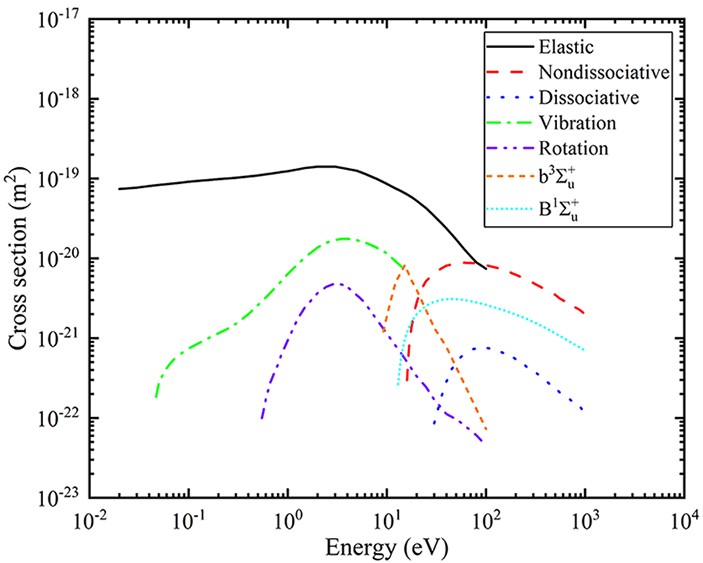
According to figure 2, reaction (5) is elastic collision in the energy range of 0‒100 eV. The cross-section value of elastic collision is much larger than those of other collisions, which makes the probability of elastic collision between electrons and background hydrogen the greatest. Reaction (6) represents excitation collision, which contains vibrational excitation, rotational excitation, b3Σ+u and B1Σ+u electron excitations. The energy thresholds for these excitation reactions are 0.516 eV, 0.044 eV, 7.93 eV and 12.75 eV, respectively. When an excitation collision occurs, the electron will lose the threshold energy. When the energy of the electron is lower than the threshold energy, the collision will not occur. Reaction (7) is non-dissociative ionization collision, with an energy threshold of 15.4 eV. When a non-dissociative ionization collision occurs, the electron will lose 15.4 eV of energy, thereby generating a H+2 ion and another electron. After the collision, the energy distribution between the two electrons is random, and the energy of the ion satisfies the Maxwell distribution at room temperature. The cross-section of reaction (7) is very high, near 70 eV, and the cross-section value decreases rapidly as the energy decreases. Reaction (8) is dissociative ionization collision, with an energy threshold of 30.6 eV, which is similar to the non-dissociation ionization collision. The difference is that the dissociation ionization collision generates a H+ ion and a H radical. The energy thresholds and cross-section data for all these reactions are sourced from [18]. Figure 2 shows the cross-sections versus electron energy.
Figure
2.
Cross-section data for various types of collisions of electrons with background hydrogen.
For hydrogen ions and background molecules, the collision reactions considered in our simulations include:
H+momentumtransfer:H++H2→H++H2
(9)
H+chargeexchange:H++H2→H+H+2
(10)
H+2chargeexchange:H+2+H2→H+2+H2
(11)
H+2protontransfer:H+2+H2→H+3+H
(12)
H+3momentumtransfer:H+3+H2→H+3+H2
(13)
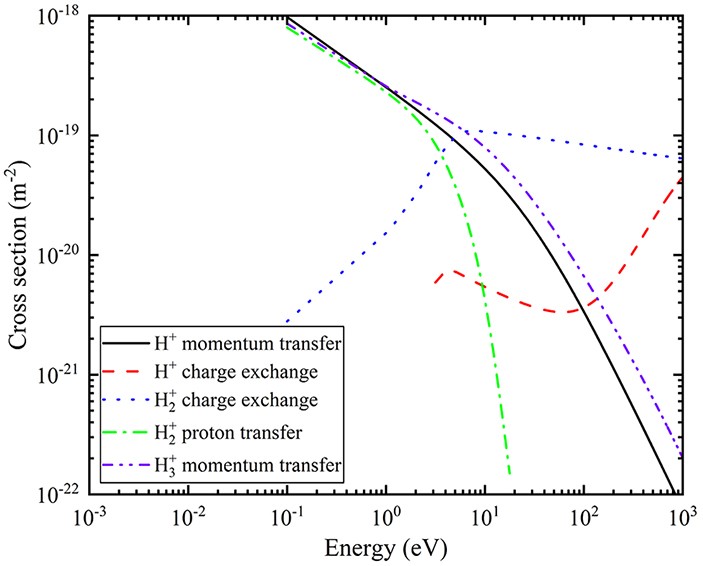
The cross-sections for these collision reactions can be found in [19], as shown in figure 3. For H+, momentum transfer and charge exchange reactions were considered. Since the masses of ions and neutral gas molecules are similar, when a momentum transfer collision occurs, a large energy exchange will occur between the ions and the neutral molecules. A charge transfer collision means that a higher-energy hydrogen ion is transformed into a neutral particle, along with the emergence of a lower-energy ion. As can be seen from figure 3, the cross-section curves for momentum transfer (black curve in figure 3) and charge exchange (red curve in figure 3) intersect at around 100 eV. This implies that when the energy of H+ is below 100 eV, momentum transfer collisions are more likely to occur, while charge exchange becomes more prevalent when the energy of H+ exceeds 100 eV. In EUV-induced plasma, the energy of H+ generally does not exceed 50 eV [16], so momentum transfer is the dominant process. For H+2 ions, the simulation includes charge exchange and proton transfer collisions. The cross-section curves for these two types of collisions (blue and green curves in figure 3) intersect at around 3 eV. When the energy of H+2 is below 3 eV, the cross-section for proton transfer exceeds that of charge exchange, and vice versa. In our simulation, the energy of ions produced by photoionization is determined according to the Maxwellian distribution at room temperature, with the average energy of H+2 being about 0.25 eV. Therefore, the proton transfer reaction predominates, leading to the gradual transformation of H+2 into H+3.
Figure
3.
Cross-section data for various types of collisions of ions with background hydrogen.
When EUV light irradiates the ruthenium coating of the mirror, it internally excites electrons. In addition, these electrons undergo cascade collision reactions with ruthenium atoms, thereby generating more electrons. Some of these electrons are able to escape from the ruthenium surface into the plasma, and are known as secondary electrons. It has been proved that the impact of secondary electrons on EUV-induced plasma is significant [20].
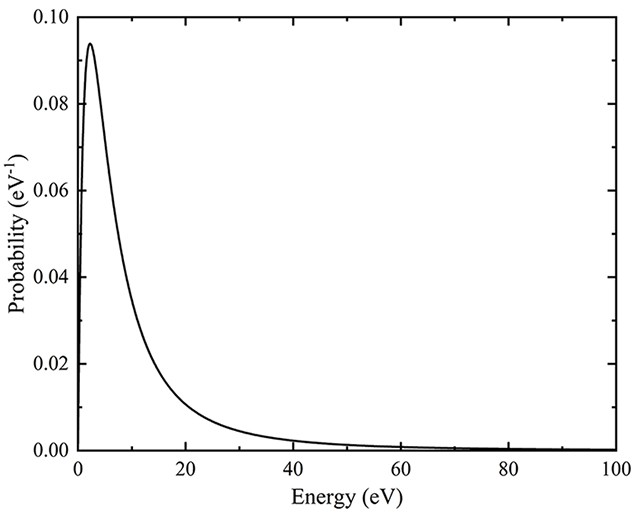
According to experimental measurements by Yakshinskiy et al [21], for EUV photons with an energy of 92 eV, the yield of secondary electrons is about 2.1%, which means that an average of 0.021 electrons is emitted per incident photon. Considering that secondary electrons undergo a variable number of collisions within the ruthenium lattices, they have a wide energy distribution. In our PIC simulations, we describe their energy distribution using the following probability density function [22]:
S(Ee,W)=6W2Ee(Ee+W)4,
(14)
where S is the probability density of secondary electrons, Ee is the energy of secondary electrons and W is work function. For ruthenium, W = 6.74 eV. Substituting into the above formula, the energy distribution curve of secondary electrons can be obtained, as shown in figure 4.
Figure
4.
Energy distribution function for secondary electrons.
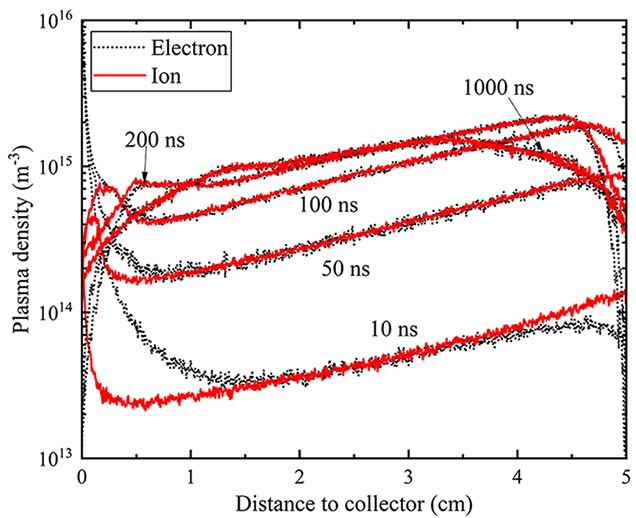
Figure 5 shows the spatial distribution of the density of the EUV-induced hydrogen plasma at different times (background gas pressure: 1.5 Pa, source intensity: 1.8 J pulse−1 m−2). As can be seen in the figure, the plasma density generally tends to increase over time in the early stage of the EUV pulse and then decreases. During the EUV pulse duration (0‒100 ns), the plasma density in the central region of the simulation rapidly increases. This is because the EUV photons ionize the background gas and produce numerous high-energy electrons, which further collide with background gas molecules and generate more plasma. After the EUV pulse (> 100 ns), although no more EUV ionization reactions occur, the ionization process by electrons continues until the energies of all the electrons are below the thresholds of ionization reactions. Afterwards, the density of the plasma close to the walls slowly decreases due to the diffusion of the plasma towards the walls and being absorbed thereafter, while the plasma in the central area barely changes.
Figure
5.
Spatial distributions of electron and ion densities at different times.
From figure 5, it can also be seen that near the mirror surface, there is a significant difference between electron density and ion density, forming what is known as the plasma sheath. Typically, electrons move much faster than ions and reach the walls sooner, resulting in a lower density near the wall than ions. However, as shown in figure 5, the electron density near the left wall is noticeably greater than the ion density during the EUV pulse, especially at the initial stage, e.g. at 10 ns, where both electron and ion densities are the highest at the surface and decrease exponentially with increasing distance from the wall. This is due to the production of numerous secondary electrons at the ruthenium surface, leading to a higher number of electrons than ions. This type of sheath structure is also known as an inverse sheath [23]. During the existence of the inverse sheath, positively charged ions are repelled by the wall, while electrons are attracted to it. Therefore, the difference in electron and ion densities near the mirror gradually decreased with time (see the curves of 50 ns and 100 ns in figure 5). In addition, a peak in ion density appears in the vicinity of the mirror, which indicates that the repelling effect on ions causes numerous ions to accumulate at a certain position away from the mirror.
With the end of EUV pulse (t > 100 ns), the emission of secondary electrons stops. Subsequently, electrons within the plasma rapidly impact on the surface under the effect of the inverse sheath, resulting in a shift of the sheath potential from negative to positive. This transition engenders the formation of a classical positive sheath. At this juncture, as depicted in the curve corresponding to 200 ns in figure 5, the ion density in the vicinity of the mirror exceeds the electron density. In the realm of the positive sheath, electrons decelerate as they approach the surface, whereas ions accelerate.
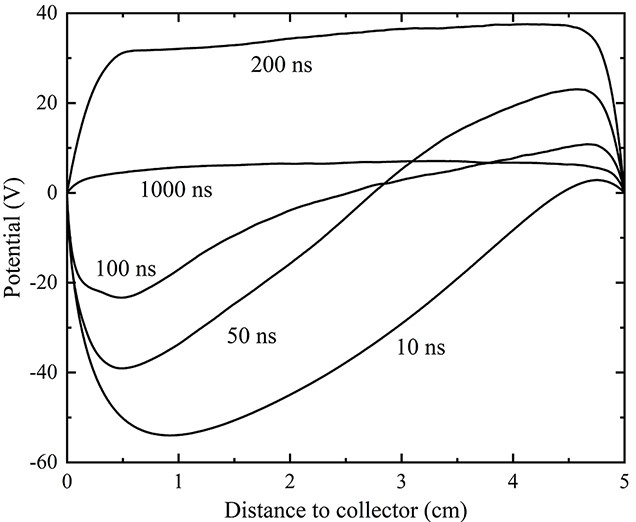
Figure 6 illustrates the temporal evolution of the spatial potential distribution. During the EUV pulse phase (0‒100 ns), it can be observed that the plasma potential near the mirror consistently remains negative, corresponding to the formation of the inverse sheath. According to our calculations, the peak negative potential, which is approximately −54 V, occurs at around 10 ns. Following the termination of the EUV pulse, the plasma potential undergoes a rapid transition to positive values, indicating the formation of a classical sheath, which is consistent with previous descriptions. It is noteworthy that during the existence of the inverse sheath, the wall does not exhibit a positive potential. This is due to the assumption that the surface is grounded, maintaining a potential of zero.
Figure
6.
Spatial distribution of potential of the EUV-induced hydrogen plasma.
Research indicates that EUV-induced plasma serves a dual role when interacting with mirror surfaces. First, the plasma effectively removes impurities deposited on the mirror surfaces. On the other hand, the plasma may also cause irradiation damage to the material surfaces. The underlying mechanism involves physical and chemical processes and is fundamentally linked to the flux and energy of the ions impinging on the surface.
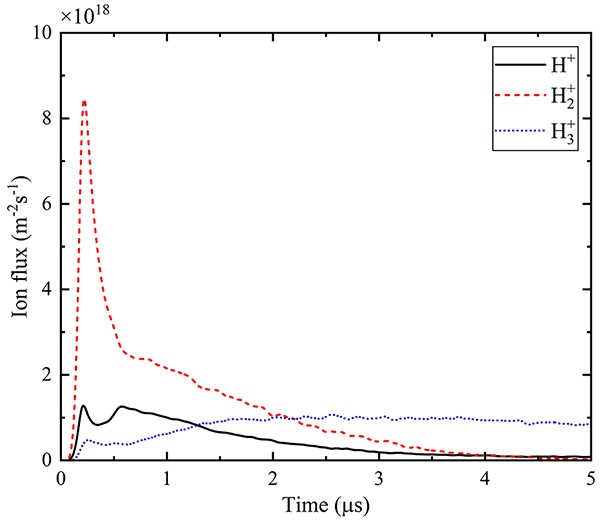
Figure 7 illustrates the temporal flux profiles of three types of ions, i.e. H+, H+2 and H+3. Obviously, the fluxes of these ions start to increase after the EUV pulse, since the formation of the inverse sheath imparts a repulsive effect on the positive ions. Once the EUV pulse ends, the classical positive sheath ensues, resulting in the acceleration and subsequent impact of ions on the mirror. The flux of H+2 ions conspicuously surpasses that of H+ ions in the immediate aftermath of the EUV pulse. This phenomenon is a consequence of the predominant non-dissociative photoionization (reaction (2)), which produces H+2 ions, over the dissociative ionization processes (reactions (3) and (4)) that produce H+ ions. Furthermore, considering that H+2 ions can rapidly convert to H+3 ions via proton transfer reactions (reaction (12)), there is a swift decline in the flux of H+2 ions. Our simulation results indicate that H+3 ions start to dominate the plasma composition from 2.2 μs.
Figure
7.
Fluxes of three hydrogen ions impacting on the mirror surface as a function of time.
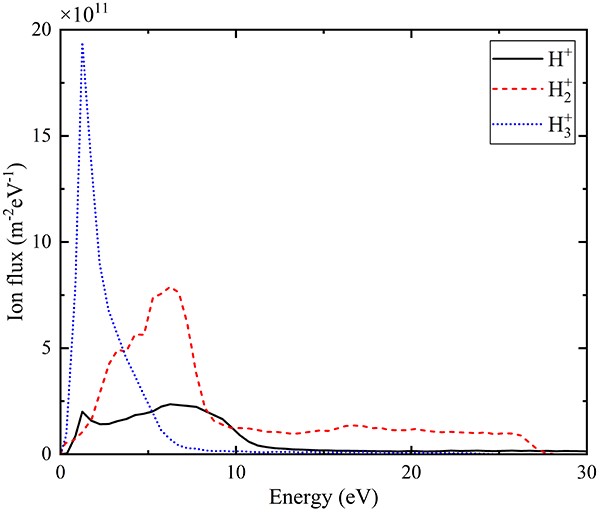
The energy-flux distributions of the three ion species within the simulation timeframe are depicted in figure 8. The results suggest that H+3 ions have the highest flux and lowest energy corresponding to the peak flux compared with H+ and H+2 ions. The energies of all three types of ions are predominantly concentrated in the range of 0‒10 eV, with a subset of H+2 ions displaying energies between 10 and 28 eV. In concordance with figure 7, these particular H+2 ions are identified as the ones impacting on the walls during the early stage of the positive sheath.
Figure
8.
Energy distribution function of the three hydrogen ions impacting on the mirror surface at 5 μs.
The pressure of the background gas determines the spatial density of hydrogen molecules, i.e. higher pressure yields greater molecular density and thereafter enhances the likelihood of collisions between electrons and background gas molecules, leading to the change in the evolution of the plasma.
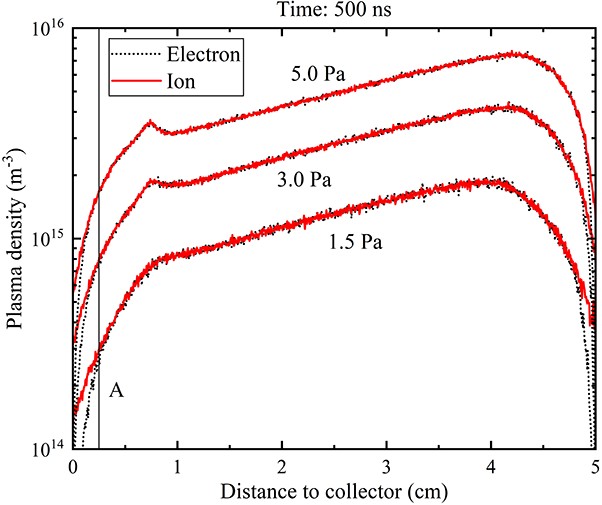
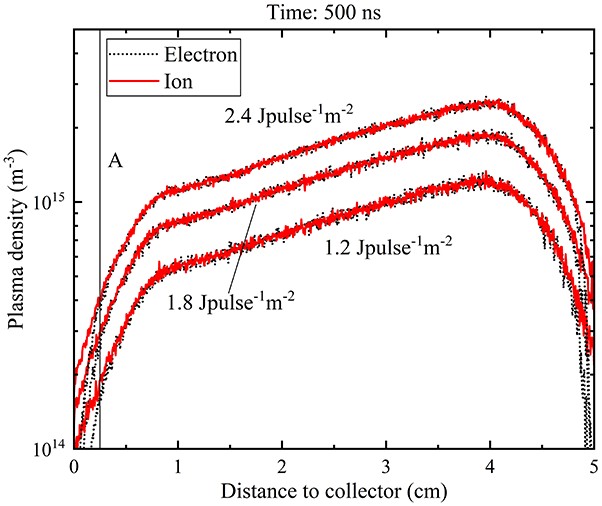
Figure 9 presents the spatial distribution curves of plasma density at 500 ns under different background gas pressures. It is evidenced that plasma density increases with the rising pressure, which is consistent with the experimental results of Horst et al [24]. From figure 9, one may also note that, conversely, the thickness of the sheath decreases as the pressure increases. Research has shown that the thickness of the sheath is proportional to the Debye length (λD) of the plasma [25]. The Debye length is defined as λD=(ε0Te/ene)1/2, where ε0 is the vacuum permittivity, Te is the electron temperature in eV, e is the elementary charge and ne is the electron density. Therefore, as the electron density increases, the Debye length decreases, resulting in the decrease in the sheath thickness.
Figure
9.
Spatial distributions of electron and ion densities at different pressures.
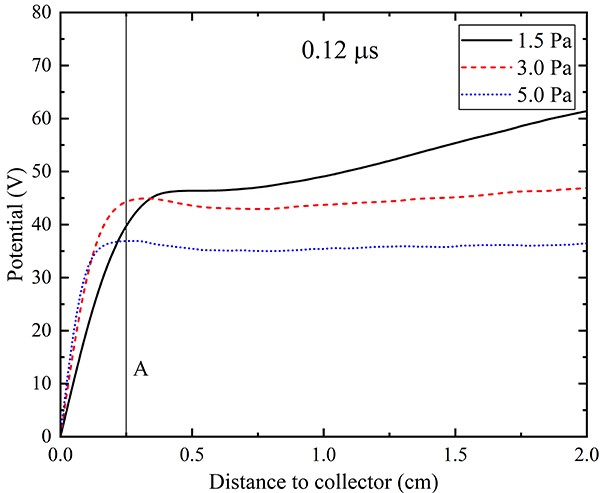
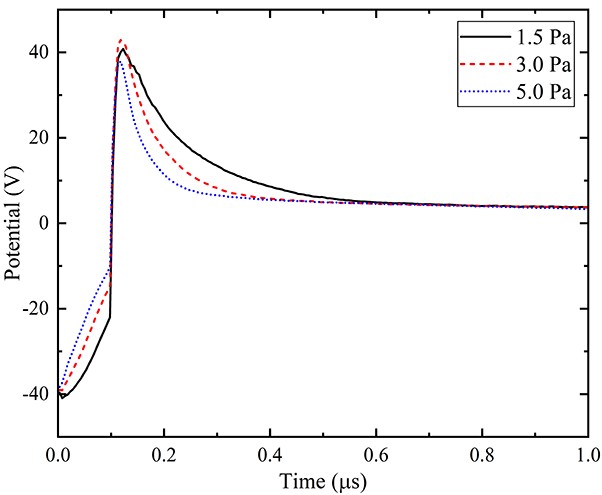
To examine the impact of background gas pressure on the sheath potential, we selected a specific location around the edge of the sheath, named point A in figure 10, which is at a distance d = 0.25 cm from the mirror. It can be seen from figure 10, that point A is close to the edge of the sheath under 3.0 Pa and 5.0 Pa background gas and inside the sheath under 1.5 Pa. By monitoring the potential of point A over time, the influence of the pressure of the background gas was revealed. The results are shown in figure 11. For all three cases, the potential at point A remains negative during the EUV pulse, as previously mentioned. This phenomenon is attributed to the secondary electrons generated by EUV irradiation on the ruthenium surface. As the background gas pressure increases, the density of the plasma generated by photoionization increases, gradually lowering the proportion of secondary electrons. Consequently, the potential at point A gradually increases. As the EUV pulse stops (> 100 ns), the secondary electrons disappear, and the potential within the sheath swiftly becomes positive, forming a classical sheath structure. Subsequently, as time progresses, the potential within the sheath gradually decreases. With increased background gas pressure, the rate of decrease in the sheath potential also grows. This is due to the increased collision frequency of electrons with background gas molecules as the pressure rises, meaning that electrons lose energy more rapidly and fewer electrons will reach the mirror surface. Eventually, a decrease in potential can be expected.
Figure
10.
Potential profiles in the sheath under different gas pressures.
Furthermore, it is discernible in figure 11 that the overall maximum potential at point A occurs at the background gas pressure of 3.0 Pa, followed by 1.5 Pa and 5.0 Pa. This phenomenon can be elucidated by looking into the potential distribution under different background gas pressures. As depicted in figure 11, the sheath potential increases faster with higher background gas pressure. Simultaneously, the potential outside the sheath decreases with increasing pressure. Consequently, it causes the potential distribution curves to intersect at multiple points. At t = 0.12 μs, with the background gas pressure of 5.0 Pa, point A is outside the sheath. Under the pressure of 3.0 Pa, point A is at the boundary of the sheath, and under 1.5 Pa, it is inside the sheath. This spatial variation eventually leads to the highest potential at point A when the background gas pressure is 3.0 Pa.
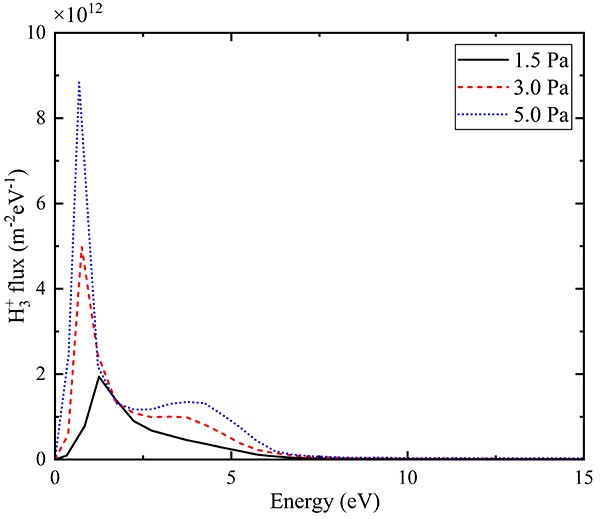
Considering the predominant flux of H+3 among the three types of ions, the influence of background gas pressure on the energy profile and flux of H+3 was investigated. Figure 12 presents the energy-flux distribution curves of H+3 ions received by the left wall under varying background gas pressures. It is evidenced that with increasing pressure, the flux of H+3 increases approximately linearly. In addition, the increase in pressure correlates with the reduction in the energy of H+3. At pressures of 1.5 Pa, 3.0 Pa and 5.0 Pa, the peak flux of H+3 corresponds to energies of 1.24 eV, 0.75 eV and 0.68 eV, respectively. The augmentation in ion flux can be primarily attributed to the increase in the density of the background gas, which leads to a higher frequency of photoionization events and collisions between electrons, ions and background gas molecules. The decrease in ion energy is associated with the changes in the sheath potential. As inferred from previous analyses, an increase in background gas pressure induces an accelerated decrease in the sheath potential, thereby reduces the energy of H+3 ions impacting the mirror.
Figure
12.
Energy distribution function of H+3 ions that impact on the mirror at different background gas pressures.
It is worth noting that the maximum value of the horizontal axis in figure 12 does not represent the upper limit of the energy of H+3. For the sake of graphical clarity, the curves were truncated. According to our simulations, the maximum energy of H+3 ions is about 25 eV. However, as indicated by the trend of the curves in figure 12, the flux of H+3 exceeding 10 eV is considerably low.
3.3
Influence of source intensity
Equation (1) elucidates that an increase in the intensity of the source light directly leads to a higher frequency of photoionization events and therefore generates more high-energy electrons, which in turn affects the dynamic evolution of the plasma. Figure 13 depicts the spatial distribution of plasma density at 500 ns under different source intensities. It can be observed that as the source intensity increases, the overall plasma density increases while the shape of the curves remains basically unchanged. As previously discussed, the Debye length decreases with the increase in electron density. Therefore, with the enhancement of source intensity, the thickness of the sheath decreases slightly.
Figure
13.
Spatial distribution of electron and ion densities with different EUV intensities.
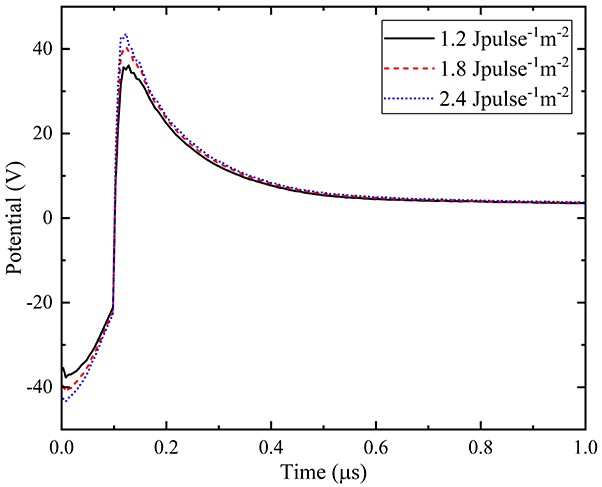
Figure 14 illustrates the temporal profile of the potential at point A (as shown in figure 11) under different source intensities. The results indicate that the overall impact of source intensity on the sheath potential is relatively trivial. During the inverse sheath phase, an increase in source intensity leads to the reduction in potential, which is attributed to the higher yield of secondary electrons. In the positive sheath phase, the sheath potential marginally rises as the source intensity increases. This can be interpreted as caused by the increased frequency of photoionization events and higher production of high-energy electrons with the intensification of the source light.
Figure
14.
Curves of the potential of a point within the sheath (distance from the mirror d = 0.25 cm) as a function of time with different EUV intensities.
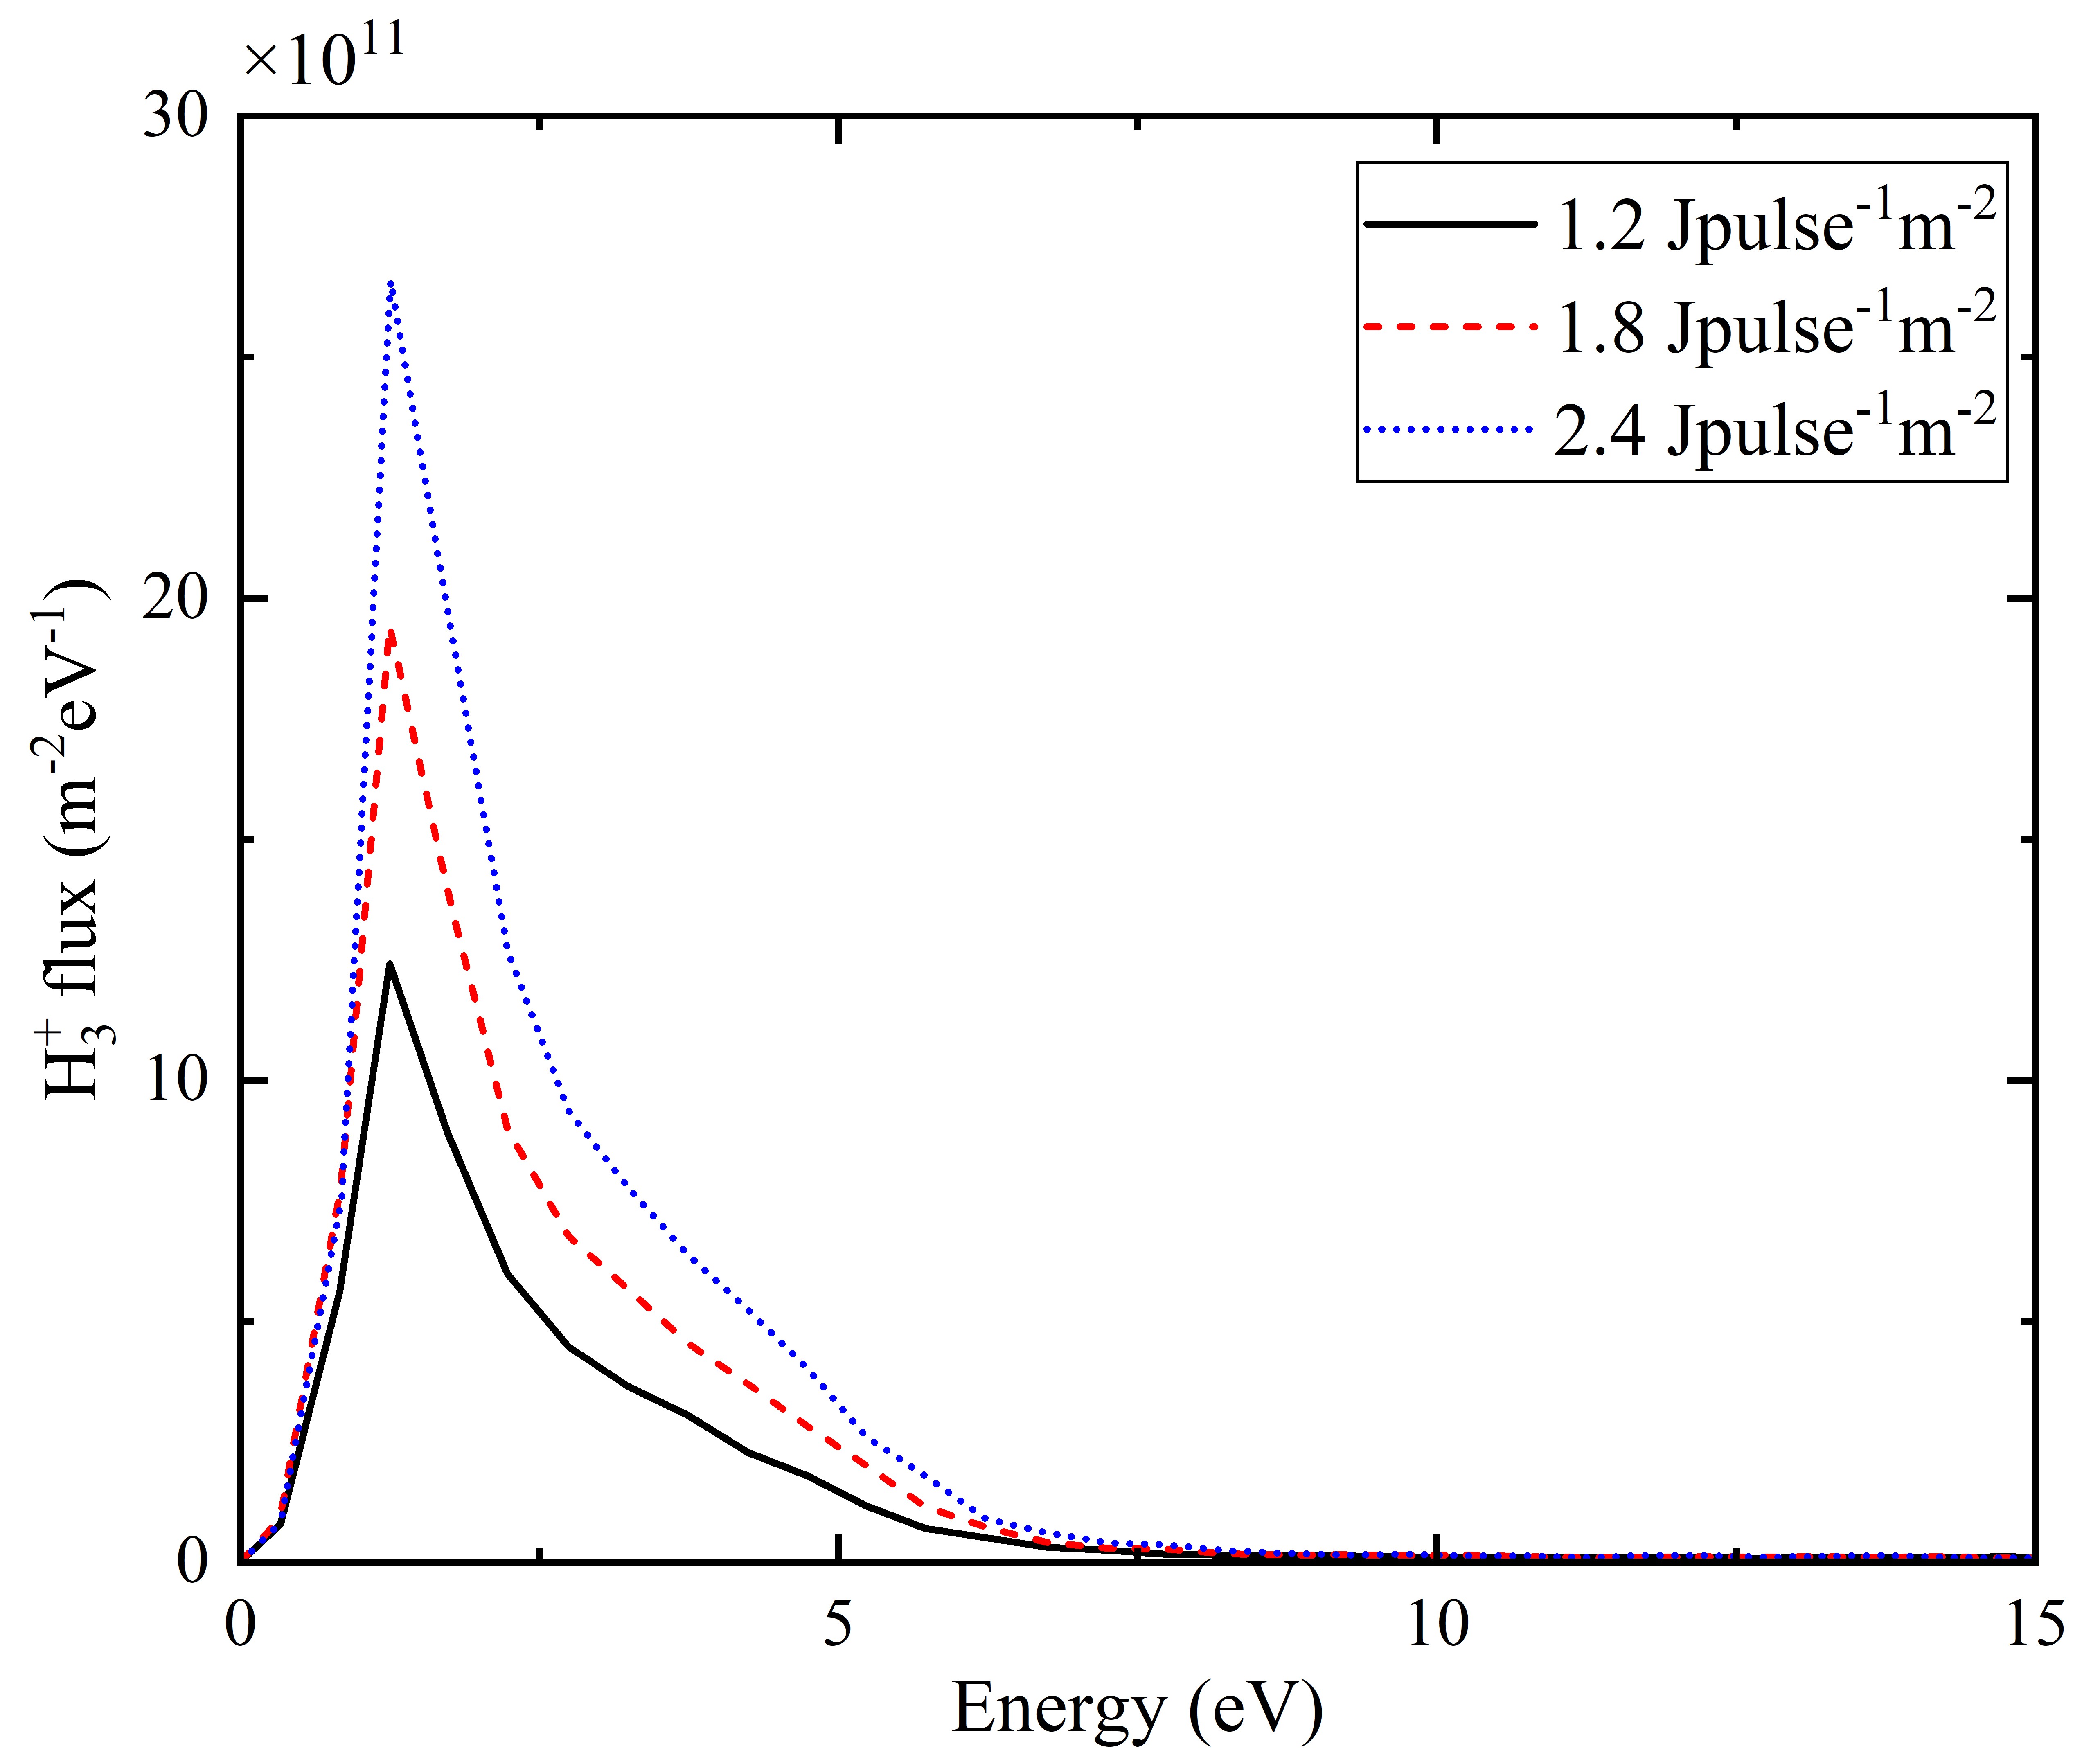
The influence of EUV source intensity on the energy-flux distribution of H+3 impinging on the mirror surface is depicted in figure 15. The results show that the flux of H+3 increases approximately linearly with the intensity of the source. According to equation (1), the probability of photoionization events is proportional to the source intensity. Similarly, the yield of secondary electrons is also proportional to the intensity, elucidating the linear relationship between the H+3 ion flux and the source intensity. In addition, prior analysis indicated that the increase in source intensity marginally elevates the peak potential of the sheath. Consequently, this change in the sheath potential is supposed to lead to an increase in the maximum energy of H+3. However, considering that the peak potential of the sheath appears right after the end of the EUV pulse and the density of H+3 is still very low at that time, the source intensity has very limited influence on the energy profile of H+3 ions.
Figure
15.
Energy distribution function of H+3 impacting on the mirror with different source intensities.
Similarly, the curves in figure 15 were truncated as well. Our simulations indicate that for source intensities of 1.2 J pulse−1 m−2, 1.8 J pulse−1 m−2 and 2.4 J pulse−1 m−2, the respective maximum energies of H+3 were 23.67 eV, 25.54 eV and 26.22 eV.
4.
Conclusion
PIC simulations were performed in this work to investigate the EUV-induced hydrogen plasma in the vicinity of reflective mirrors in EUV devices. The sheath of the plasma, as well as the flux and energy profile of ions impinging on the mirror, was discussed. The results suggest that the secondary electrons generated by the EUV irradiation on the ruthenium mirror coating are nonnegligible. The emission of the secondary electrons creates a positively charged wall, which prevents the ions from moving towards the mirror. However, this phenomenon only exists during the EUV pulse. Once the EUV pulse ends, a classical sheath will be formed and accelerate the ions towards the mirror.
Among all the ions, H+3 possesses the major proportion since most of the H+2 ions will transform to H+3 through proton transfer reaction with the background gas molecules. Gas pressure has a more significant effect on the sheath properties and the flux and energy of ions impinging on the mirror surface than EUV intensity. With greater gas pressure, the sheath potential decreases more rapidly. The flux of ions received by the mirror grows approximately linearly and at the same time the energy corresponding to the peak flux decreases slightly. The EUV source intensity barely changes the sheath potential and its influence on the ions impacting on the mirror surface is mainly limited to the approximate linear increase in ion flux.

 DownLoad: