Lili DONG, Li LI, Wenjun LIU, Tong LIU, Yunfeng LIANG, Jiaqi DONG, Huasheng XIE, Yuejiang SHI, the EHL-2 Team. Instabilities of ideal magnetohydrodynamics mode and neoclassical tearing mode stabilization by electron cyclotron current drive for EHL-2 spherical torus[J]. Plasma Science and Technology, 2025, 27(2): 024006. DOI: 10.1088/2058-6272/ada421
Citation:
Lili DONG, Li LI, Wenjun LIU, Tong LIU, Yunfeng LIANG, Jiaqi DONG, Huasheng XIE, Yuejiang SHI, the EHL-2 Team. Instabilities of ideal magnetohydrodynamics mode and neoclassical tearing mode stabilization by electron cyclotron current drive for EHL-2 spherical torus[J]. Plasma Science and Technology, 2025, 27(2): 024006. DOI: 10.1088/2058-6272/ada421
Lili DONG, Li LI, Wenjun LIU, Tong LIU, Yunfeng LIANG, Jiaqi DONG, Huasheng XIE, Yuejiang SHI, the EHL-2 Team. Instabilities of ideal magnetohydrodynamics mode and neoclassical tearing mode stabilization by electron cyclotron current drive for EHL-2 spherical torus[J]. Plasma Science and Technology, 2025, 27(2): 024006. DOI: 10.1088/2058-6272/ada421
Citation:
Lili DONG, Li LI, Wenjun LIU, Tong LIU, Yunfeng LIANG, Jiaqi DONG, Huasheng XIE, Yuejiang SHI, the EHL-2 Team. Instabilities of ideal magnetohydrodynamics mode and neoclassical tearing mode stabilization by electron cyclotron current drive for EHL-2 spherical torus[J]. Plasma Science and Technology, 2025, 27(2): 024006. DOI: 10.1088/2058-6272/ada421
Instabilities of ideal magnetohydrodynamics mode and neoclassical tearing mode stabilization by electron cyclotron current drive for EHL-2 spherical torus
Hebei Key Laboratory of Compact Fusion, Langfang 065001, People’s Republic of China
2.
ENN Science and Technology Development Co., Ltd., Langfang 065001, People’s Republic of China
3.
College of Science, Donghua University, Shanghai 201620, People’s Republic of China
4.
Key Laboratory of Materials Modification by Laser, Ion, and Electron Beams (Ministry of Education), School of Physics, Dalian University of Technology, Dalian 116024, People’s Republic of China
5.
Forschungszentrum Jülich GmbH, Institute of Fusion Energy and Nuclear Waste Management-Plasma Physics, Partner of the Trilateral Euregio Cluster (TEC), Jülich 52425, Germany
6.
Southwestern Institute of Physics, Chengdu 610041, People’s Republic of China
The next generation fusion device listed on ENN’s fusion roadmap, named as (ENN He-Long) EHL-2, is under both physics and engineering designs. The instabilities of ideal magnetohydrodynamics (MHD) mode and neoclassical tearing mode (NTM) stabilized by electron cyclotron current drive (ECCD) for EHL-2’s two typical operation scenarios are analyzed. For high-ion-temperature operating (HITO) scenario, the vertical displacement event (VDE) could be a big challenge to the device safety. For the steady-state operating (SSO) scenario, the limitation may rise from the ideal MHD mode, NTM, etc. This suggests that the MHD analysis of both operation scenarios should be done with different focusing. Preliminary analysis based on the current physics and engineering design of both two scenarios is given in this paper. Based on the analysis result of above, the future assessments might target at active control method and the effect of boron on MHD activities.
Fusion energy is widely recognized for its potential as a clean and virtually inexhaustible source of power for future generations. A favourable fusion reaction rate requires extreme high temperature which no currently known material could directly hold. Consequently, numerous fusion reactor designs have been conceived to achieve ‘controlled fusion’, and several feasible fusion reactions have been figured out. Among all types of fusions, magnetic confinement fusion (MCF) is treated as a highly promising approach. This method utilizes magnetic fields to confine the plasma, thereby facilitating the fusion process. Among the various fusion reactions, deuterium-tritium (D-T) fusion is considered the most accessible due to its relatively high reaction rate at low temperature. Significant effort has been put into achieving MCF using the tokamak configuration. Key examples of such endeavours include the ongoing design and construction of major experimental facilities like the International Thermonuclear Experimental Reactor (ITER) and China Fusion Engineering Test Reactor (CFETR) [1, 2]. In addition to the traditional tokamak configuration, an alternative design known as the spherical torus (ST) has been put forth. This design is characterized by its compact configuration and is recognized for its enhanced efficiency in magnetic field utilization. For the fusion fuel, the proton-boron (p-11B) fusion reaction necessitates a temperature order higher than that required for the D-T fusion reaction. The p-11B fusion reaction is considered as a viable alternative because it does not produce dangerous high-energy neutron compared to D-T fusion. The ST configuration has been experimentally demonstrated to confer benefits on ion temperature, which is a critical parameter in the field of fusion research [3]. By considering the advantages and disadvantages of different types of fusion devices and fusion reactions, ENN has selected the p-11B fusion reaction, in conjunction with the ST configuration, as a route to achieving commercial fusion [4, 5]. Since 2018, ENN has constructed two ST devices, the EXL-50 and EXL-50U, with the goal of establishing the foundation for ST p-11B fusion and developing key technologies for p-11B fusion on ST, respectively. The EXL-50U has conducted feasibility tests focusing on both the physics and engineering aspects for the EHL-2, which is the next-generation ST under both physics and engineering designs on ENN roadmap. The objective of EHL-2 is to verify the rate of the thermonuclear reaction for p-11B fusion, to investigate the scaling laws at ion temperatures on the order of 10 keV, and to give fundamental ideas for subsequent experimental endeavours aimed at validating and actualizing proton-boron fusion burning.
The net fusion energy gain is one of the commonly used assessment parameters for commercial fusion viability. The Lawson criterion, which is widely recognized for quantifying the conditions necessary for a net energy gain in fusion reactions, is shown as the following relationship:
Fusiongain∝nτT∝βNHB3,
(1)
where βN is the normalized β, H is a dimensionless parameter that characterizes the confinement quality of the plasma and B is the toroidal magnetic field strength. The βN, H factor and toroidal magnetic field strength are limited by MHD instability, transport and the fusion engineering technology, respectively. Therefore, understanding the MHD behaviour is crucial during the design phase of a fusion device, as it allows for a comprehensive grasp of the operating parameter space. Consequently, analyzing MHD instabilities becomes a critical task in optimizing both engineering and physics designs. As the design of EHL-2 is still in progress, the MHD analysis presented in this paper should be treated as an interim report rather than a final version.
In addition to its impact on fusion gain, the MHD instability control must be addressed during the device design phase due to the potential for disruption. A plasma disruption occurs when the plasma within a magnetic confinement fusion loses its confinement, leading to a release of energy into the surrounding environment. Such events are often precipitated by inadequate control of MHD instabilities, which poses a significant concern for future fusion plants. Therefore, for the safe operation of device like EHL-2, the MHD instabilities need to be analyzed during the design phase to mitigate the risk.
For the analysis purpose, MHD instabilities are categorized into two distinct types: one that establishes the upper limit of plasma performance, and the other that impedes the plasma from reaching this upper limit. The former is characterized by ideal MHD instabilities, while the latter is associated with neoclassical tearing modes (NTMs). The ideal external kink mode and VDE are two types of low n ideal MHD instabilities. The external kink mode directly limits the βN. The VDE does not directly constrain plasma parameters but is critical for operational safety. The NTM is the predominant cause of unintentional disruptions, imposing lower limits on plasma parameters compared to those set by ideal MHD instabilities [6–9]. Considering the above, analyzing these MHD instabilities becomes a critical task in optimizing both engineering and physics designs.
The paper is split into the following parts. In section 2, two of the operating scenarios of EHL-2 are introduced and a general view of these two equilibria is given. Section 3 presents the analysis result of n≠0 instability at various conditions. Section 4 details the linear VDE analysis and corresponding passive stabilizing plate (PSP) design. Section 5 discusses the ECCD required for NTM stabilization. Finally, section 6 summarizes the findings and outlines future research plans.
2.
Designed equilibria used for MHD analysis
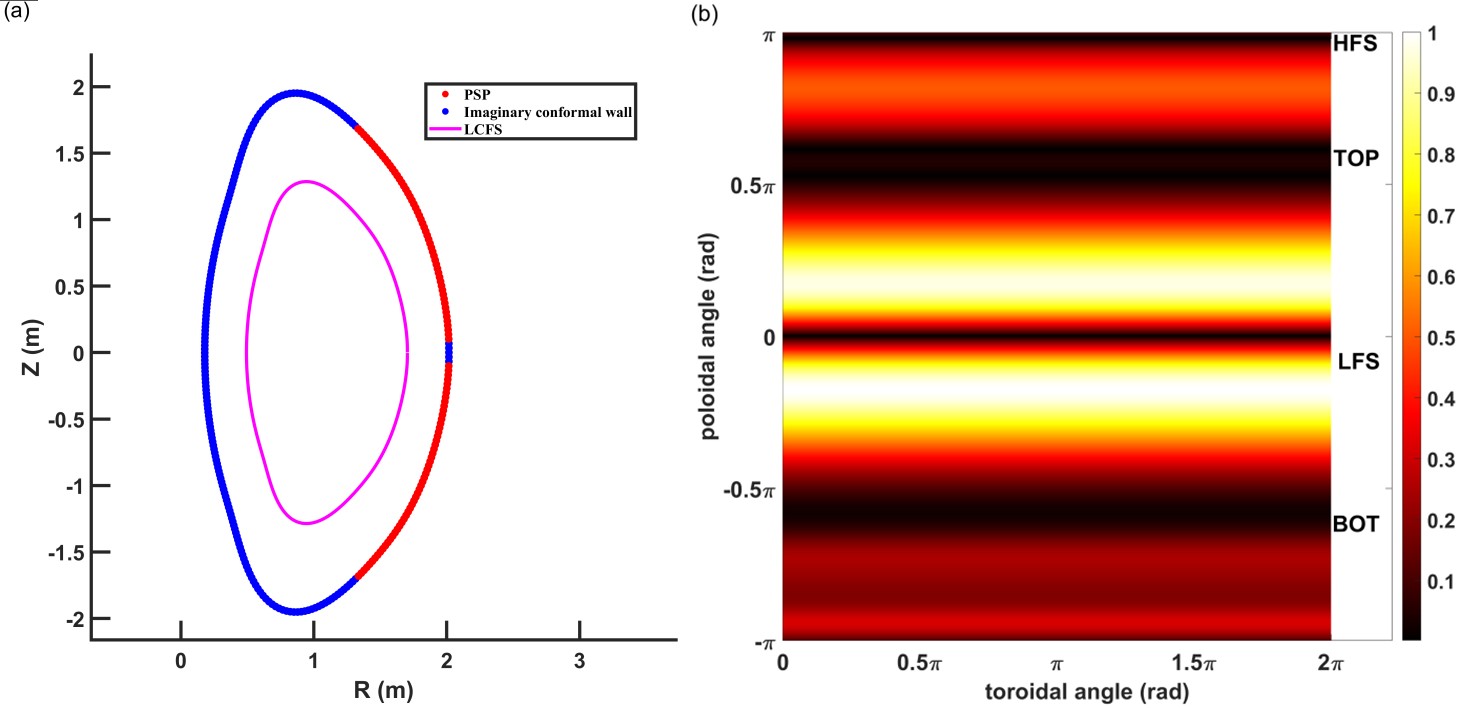
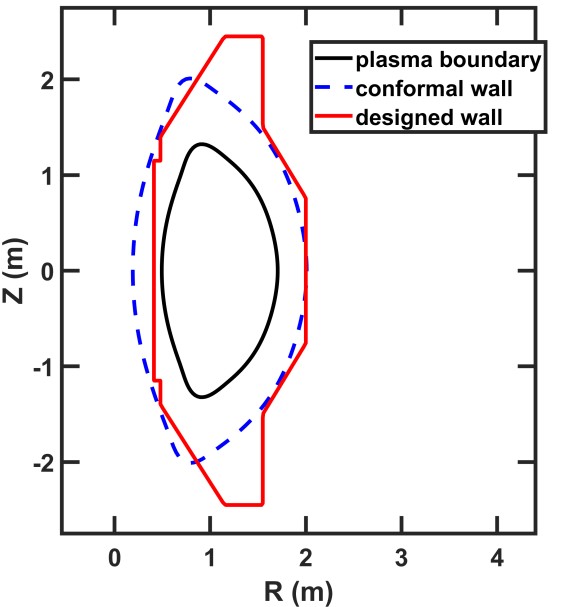
Two scenarios were designed for EHL-2 operation by a multi-dimensional equilibrium code SE [10], which is based on the 0-D parameter requirement and heat load on the vacuum vessel. The latter constraint in achieving equilibrium is particularly influenced by the choice of p-11B fusion and the ST configuration. The requirements of the high operating temperature and the small major radius enhance the engineering challenges associated with the design and operation of the reactor compared to conventional tokamaks. The MHD stability reported in this paper is based on the equilibrium in the form of EFIT [11] equilibrium file (g-file), as shown in the following figures. Figure 1 shows the shared plasma boundary of HITO and SSO scenarios used in calculation, as well as configurations of an imaginary wall and a designed wall. The effect of walls where they stabilize the MHD instabilities will be discussed in later sections.
Figure
1.
A schematic diagram depicting the configuration of plasma boundary and walls in normalized R-Z coordinate, in which the plasma LCFS is in black solid, the imaginary conformal wall is in blue dash, and the designed vacuum wall is in red solid. The X-points in LCFS are smoothed to avoid numerical error in MARS-F code.
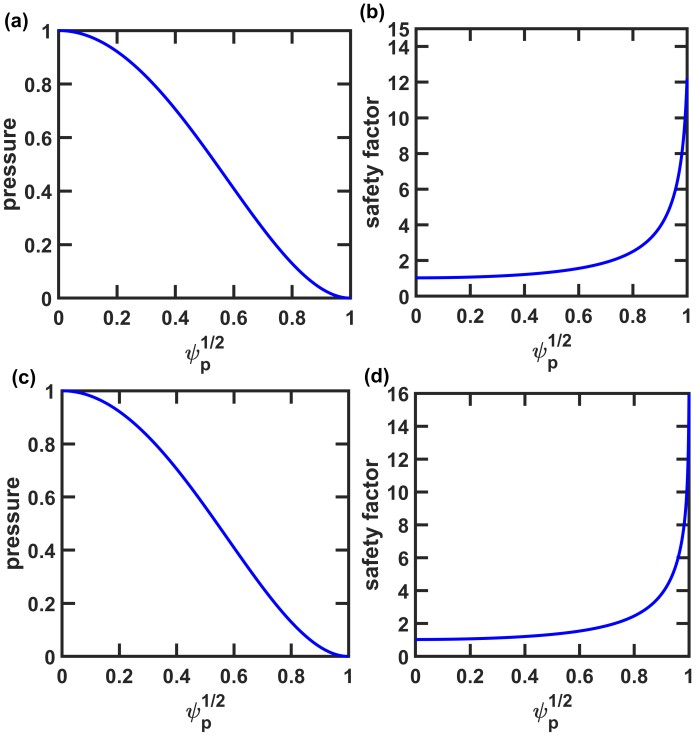
The safety factor and the normalized pressure profiles of two equilibria are depicted in figure 2.
Figure
2.
Radial profiles of (a) the normalized pressure for HITO scenario, (b) the safety factor for HITO scenario, (c) the normalized pressure for SSO scenario and (d) the safety factor for SSO scenario. Pressure is normalized by a factor of B20/μ0, and ψp is the equilibrium poloidal flux.
Comparing figures 2(a) and (c), the main difference in their safety factor profiles is that the qa is approximately 14 in the HITO scenario, while for the SSO scenario, the qa is approximately 16, indicating a slightly more sheared safety factor profile in SSO scenario’s equilibrium, which may lead to a more stable MHD performance. The EHL-2’s equilibria differ from conventional tokamak equilibria with high qa, high βN, high elongation, high rotation velocity, small aspect ratio, etc. Due to the relatively flattened safety factor profile of the SSO equilibrium, one should expect to have a reversed-shearing q profile upon considering the transport and current drive effect in the usage of integrated simulation. Furthermore, the minimum safety factor, qmin=q0, is greater than 1, which gives a benefit of avoiding internal kink modes. The HITO equilibrium, characterized by a less favourable MHD stability profile, is expected to be more affected by the presence of NTM. Both HITO and SSO equilibria have elongation ~ 2.27, which poses significant challenges for the control of VDE. The HITO scenario, with its designed plasma current of 3 MA containing significantly higher energy, necessitates the avoidance of VDE to ensure safe operation, while for the purpose of SSO, the system must be capable of operating at least under the resistive wall mode (RWM) stable conditions. These differences highlight a significant divergence in focus during the later MHD analysis process.
3.
Instabilities of ideal MHD with n≠ 0 for EHL-2 operating scenarios
The external kink mode is one of the most dangerous MHD modes for the static operation, which can be driven by the plasma pressure and current. It induces kinking of the magnetic surfaces, which could ultimately lead to a disruption [12]. The ideal MHD model suggests that the destabilization forces arise from the current gradient and pressure gradients combined with magnetic field curvature. The pressure gradient-driven external kink mode is an ideal case within the ideal MHD model, which becomes unstable even when the plasma is considered to be perfectly conductive. This instability becomes unstable when the βN exceeds the Troyon no wall limit [13]. In practical experiments, the resistivity on the vacuum vessel cannot be avoided, which will lead to a so-called RWM, its growth rate is associated with the resistivity of the vacuum vessel. A single-fluid linear code, MARS-F code, was utilized to evaluate the above MHD instabilities [14, 15]. In the MARS-F code, for the purpose of testing βN limit corresponding to the above instabilities, the growth rate of the instability at various βN values has been scanned. The CHEASE module integrated in the MARS-F code is utilized to solve the Grad-Shafranov equation corresponding to the modified pressure profiles [16]. Subsequently, the MARS module integrated in the MARS-F code is employed to determine the growth rate of the mode based on the outputted equilibrium conditions from the CHEASE module.
3.1
Computation of no-wall βN limit
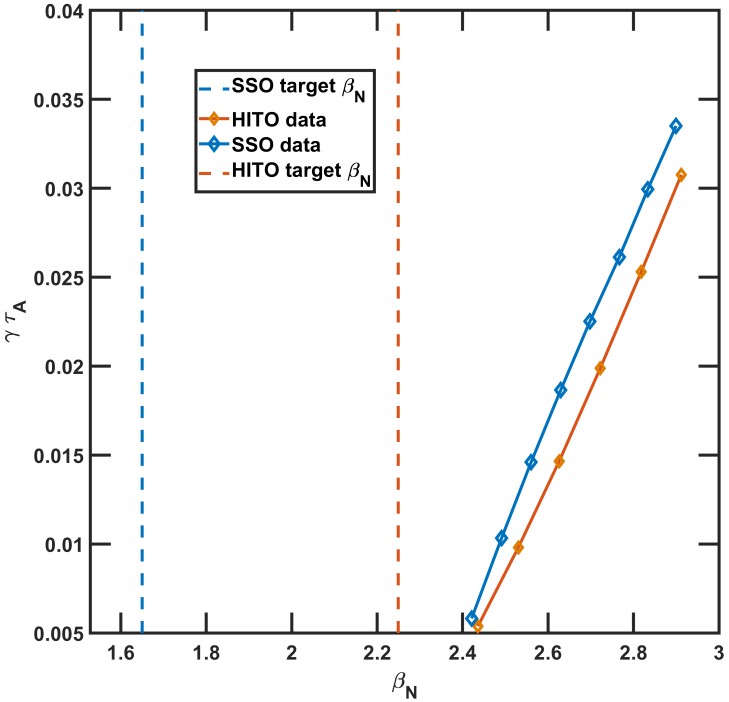
According to the comparison result in section 2, the main constraint for the EHL-2 SSO scenario is the ideal MHD instabilities, especially the n=1 mode. The no-wall βN limits of various equilibria are employed to quantitatively assess the stability of the equilibrium, and the growth rates of the n=1 toroidal modes for each case are calculated. The calculated growth rates are then used to identify the βN limit of the equilibrium at which the growth rate transitions to a non-zero value.
The result in figure 3 shows that the no-wall βN limits for both the SSO and HITO scenarios are higher than the target βN, meaning that the equilibria are both stable for operating. However, as demonstrated in equation (1), achieving higher fusion gain requires higher βN, and exploring more operating parameter space is still necessary during the design phase of the device. The mode spectrum of the simulation result could offer insights into how to improve the MHD performance and thereby increase the βN limit.
Figure
3.
Growth rates of the n=1 ideal MHD mode against βN. The x-axis is the βN, the y-axis is the growth rate times Alfvén time of instability. The target βN is represented in the dashed line, and the fitting result is represented in the solid line with exact result shown in diamond points. The target βN of the SSO and HITO scenario equilibria are 1.718 and 2.249, respectively. The calculated fitting results of SSO and HITO scenario no-wall βN limit are 2.331 and 2.356, respectively.
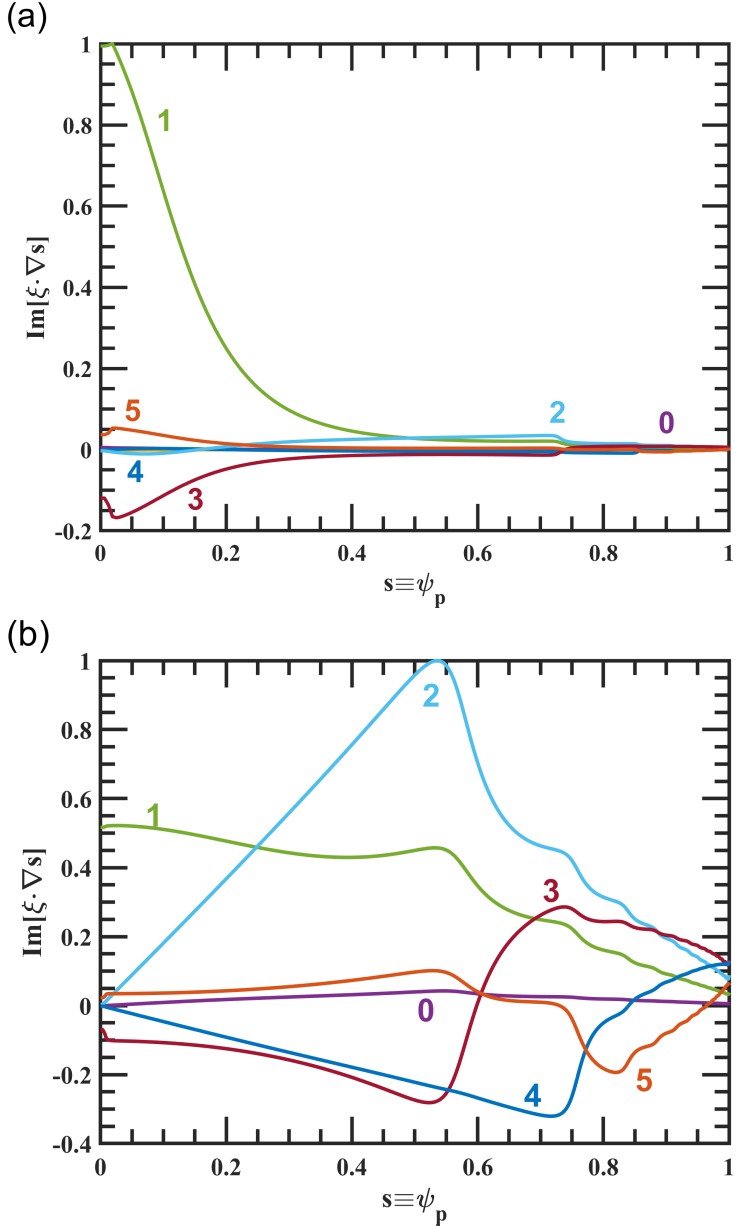
As depicted in figure 4, two mode spectra from SSO and HITO simulation data, where the instability starts growing linearly, are chosen for further analysis. The amplitude of the real part of the mode spectrum is negligible compared to the imaginary part and trivial for MHD analysis, and thus only the imaginary part of the spectrum is shown. The spectra are simplified to highlight low m results, as they are the most dangerous instabilities which lead to MHD events. In figure 4(a), the m=1, n=1 mode is significantly larger than the others, indicating a strong internal kink instability as expected in section 2.
Figure
4.
Comparison of the poloidal Fourier harmonics of eigen function (radial displacement) of two cases. The number on the lines is the corresponding poloidal number m, the x-axis is the normalized poloidal flux, and the y-axis is the imaginary part of radial displacement. (a) The HITO scenario with βN of 2.436, (b) the SSO scenario with βN of 2.421.
To extend the operating βN range, one possible strategy for the current HITO equilibrium is to increase q0 to a value greater than 1. This adjustment aims to avoid triggering the internal kink mode, which could be detrimental to plasma stability. In figure 4(b), the SSO equilibrium mode spectrum is dominated by m=2, n=1 mode, which is associated with the external kink instability. The internal kink mode appears less strong in this SSO scenario compared to the HITO scenario. To increase the βN limit, the 2/1 external kink mode could be mitigated using passive control which will be discussed in later sections, the active control method could also be applied.
3.2
Computation of with wallβNlimit
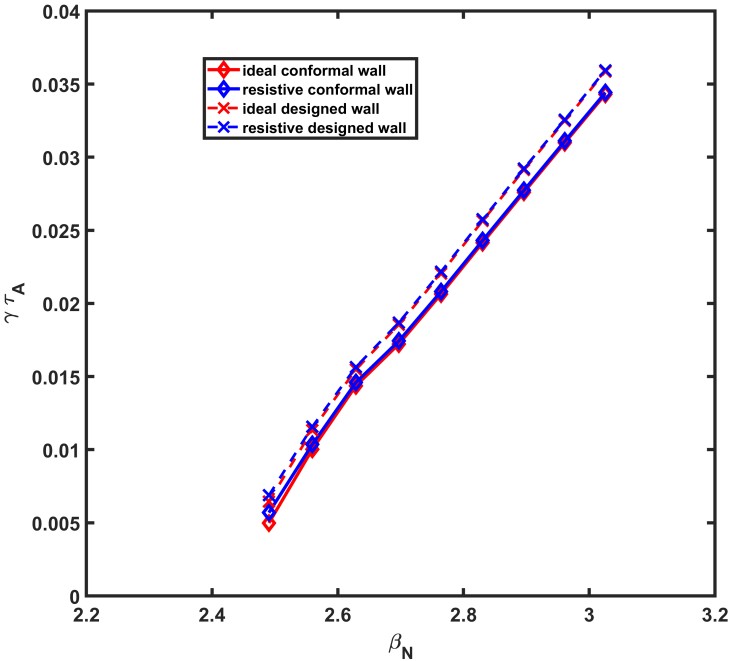
Following the simulation of the no-wall case, more realistic factors including design and resistivity of the wall are incorporated. The purpose of testing effect of imaginary conformal wall is to have a standard of the maximum achievable βN limit. The effect of current EHL-2 designed vacuum vessel wall is also assessed. For both imaginary conformal wall and designed wall, which are introduced in figure 1, scenarios of ideal and resistive wall are tested with the purpose of establishing a standard of the best-case scenario and a more realistic outcome.
The results in figure 5 show that both resistivity and shape of the wall have negligible influence (< 3%) on the βN limit, indicating that the current designed vacuum vessel wall may be too distant from the plasma to provide stabilizing effect on the n=1 MHD mode. Based on this conclusion, further investigation of the distance of the wall to the plasma dwall has been carried at the same plasma pressure level (keeping βN equal), the result is shown as follows.
Figure
5.
Results for the ideal wall and resistive wall cases of βN against the growth rate of the n = 1 mode are presented for both the conformal wall scenario and the designed wall scenario. The x-axis is the βN, and the y-axis is the growth rate times Alfvén time. The red and blue lines represent the results from ideal and resistive cases, respectively. The diamond and cross markers represent the results from conformal wall and designed wall cases, respectively.
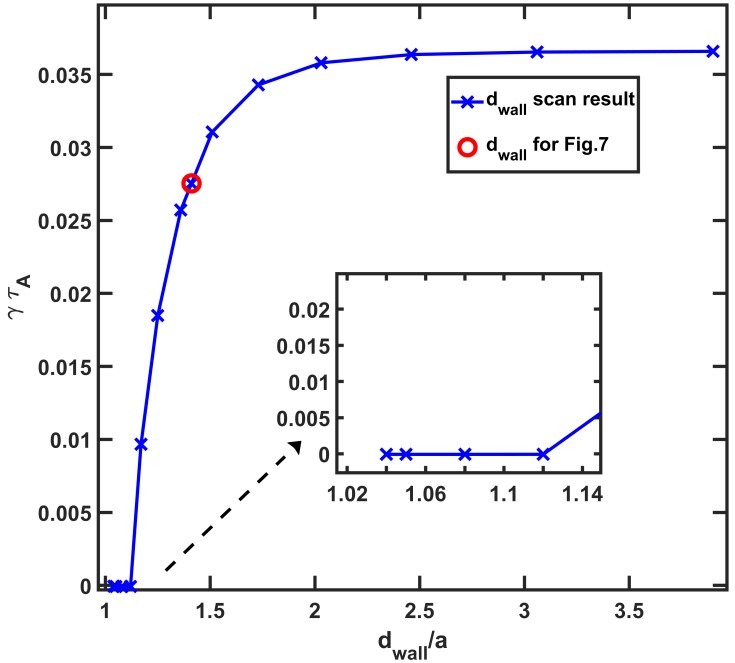
In figure 6, the growth rate is zero when the ideal conformal wall is sufficiently close to the plasma. It increases rapidly after exceeding a certain limit at βN = 1.14 and becomes saturated at around βN over 2. Considering the data in the red circle in figure 6, the dwall is sufficiently far from the plasma as the increasing rate of the growth rate against the dwall starts decreasing at this stage. Overall, figure 6 suggests that as the wall is getting closer to the dwall ~ 1.14, the stabilization effect becomes obvious. If dwall>1.3a, the stabilization effect decreases rapidly.
Figure
6.
Results for the ratio between distance of the wall and minor radius, and the growth rate instability considering an ideal conformal wall case. The x-axis is the dwall/a, and the y-axis is the instability growth rate times Alfvén time. The blue cross represents the simulation result and the red circle is the dwall chosen for the result shown in figure 5. The inset graph is a zoomed-in view of the main graph around dwall between 1.02a and 1.14a, where the growth rate of the instability within the region is zero.
3.3
Effect of toroidal plasma flow on the βN limit
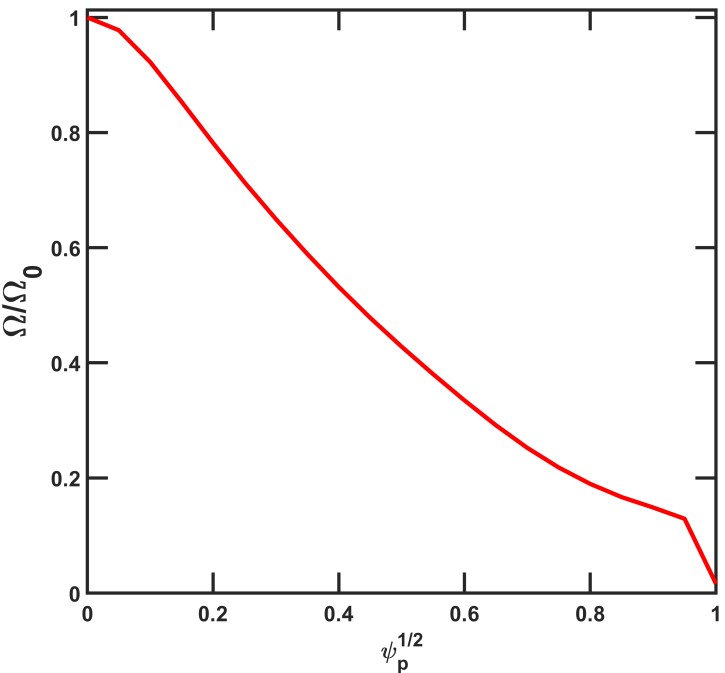
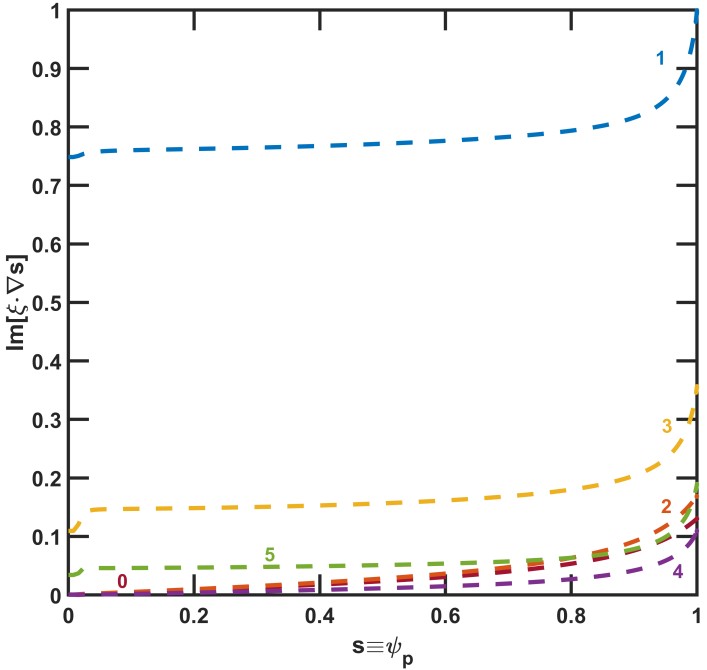
A previous study has demonstrated that in tokamaks, low n, pressure-driven, external modes could achieve complete stabilization through resistive wall effects when the plasma exhibits toroidal rotation at a certain proportion of the sound speed [14]. The same phenomenon has been shown on spherical torus, though spherical torus generally has higher rotation velocity compared to conventional tokamaks [17]. In this research, the MARS-F code is employed, incorporating the rotation velocity profile as shown in figure 7 and derived by considering the transport effect of EHL-2 equilibrium [18], along with the designed wall shown in figure 1 with the red solid line, to simulate a scenario that more approximates real-world conditions.
Figure
7.
Normalized rotation profile determined by considering transport effect based on the HITO equilibrium. The x-axis represents the root of normalized poloidal magnetic flux, and the y-axis is the center rotation velocity in rad/s.
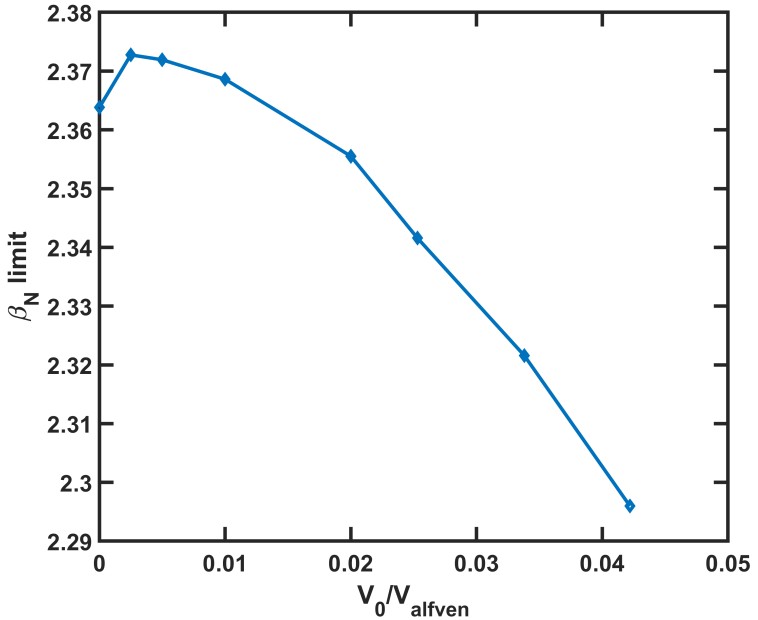
The rotation profile in figure 7 is multiplied by different factors in MARS-F to obtain a central rotation velocity parameter scan. The study examined the growth rate of the n=1 instability at various central rotation velocities when center rotation velocity is up to 0.0422 times Alfvén velocity. In figure 8, the βN limit shows a non-monotonic relationship against the central rotation velocity V0. At low plasma rotation velocity (V0 < 0.01Valfvén), there is a small increase in the βN limit, indicating a stabilizing effect on RWM of the plasma rotation. For higher rotation velocity, the βN limit decreases rapidly, indicating a destabilizing effect. The latter conclusion appears to contradict the established understanding of stabilization effect of plasma rotations, and there are several reports on other devices stating that rotation could exert a destabilizing influence [19, 20].
Figure
8.
A plot shows the no-wall βN limit against center rotation velocity V0 ranged from 0 to 0.0422 times Valfvén. The x-axis is the center rotation velocity normalized by Valfvén, the y-axis is the no-wall βN limit of the equilibrium at different rotation velocities, and the data are shown in blue diamonds.
4.
Effect of PSP and instabilities of linear VDE for EHL-2 scenarios
A VDE is a type of plasma instability characterized by the vertical movement of the entire plasma column within the vacuum vessel. The occurrence of VDE becomes particularly significant as the elongation increases, posing a critical challenge for the stability and confinement of the plasma. Given the elongation κ > 2, VDE poses a significant threat to device safety. EM force up to few mega Newtons is unaffordable for devices of all sizes [21]. The HITO scenario in EHL-2 designed with high plasma parameter is potentially in a more precarious situation compared to the SSO scenario, and more effort is spent on the HITO scenario’s VDE analysis. Non-linear simulation code is one of the most common tool calculating VDE [22–24]. However, the equilibria for both operating scenarios are still under regular updating based on the outcomes of various analyses. To keep pace with these ongoing refinements, VDE is analyzed using the MARS-F code by treating it as an n=0 instability. The MARS-F in this scenario provides the EHL-2 group with qualitative results for initial assessment of the equilibrium within several hours, which is significantly faster than the time required by commonly utilized non-linear simulation codes.
The PSP is a critical component within the vacuum vessel as a passive stabilizing method of VDE which prevents the plasma from varying its original position by generating induced current along the opposite direction. The characteristics of the PSP, such as its position and width properties, could significantly influence the effectiveness of VDE mitigation.
4.1
Validation of PSP for n=1 RWM
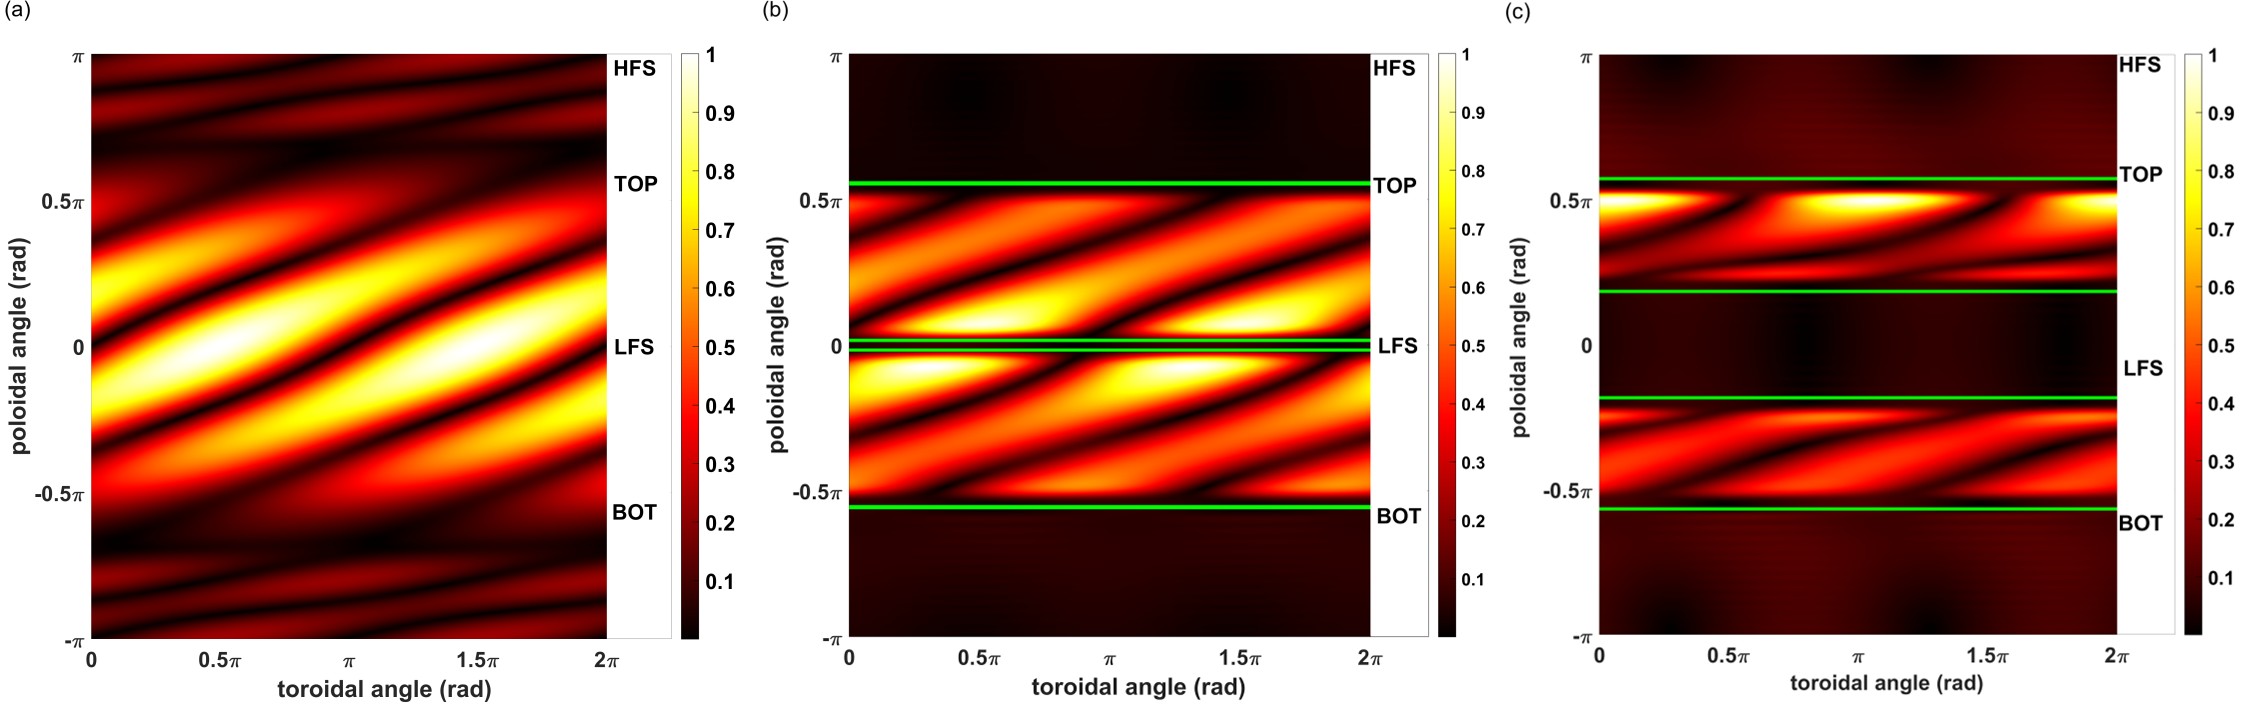
One of the challenges in adopting the MARS-F code for linear VDE simulation and PSP design is the lack of prior work in this field. Therefore, it is necessary to demonstrate the feasibility of introducing PSPs in the simulation and assess their impact before proceeding to subsequent stages. Therefore, the influence of PSP on RWM is firstly assessed, in which we need to prove that PSP has been accurately integrated. Due to the limitations of MARS-F code, the PSP is introduced into the simulation as a close-fit wall with zero conductivity in the vacuum region and finite conductivity in the PSP region. Different types of PSPs are tested and the eddy current (the induced current generated by plasma displacement) spreadings are depicted as follows.
In figure 9(a), the eddy current spreading loops every entire toroidal cycle showing a trend of n=1, indicating that the wall is correctly added into the simulation and provides stabilizing effect to the correct n=1 instability. Comparing figure 9(a) with both figures 9(b) and (c), the eddy current only occurs within the PSP region and the vacuum region appears to have no current as expected. Hence, it is concluded that the PSP model can be self-consistently added into MARS-F code, which leads to the following study.
Figure
9.
The x/y axes represent the toroidal and poloidal angles of the entire wall in radius, respectively. The 0 angle starts at the positive x-axis direction from the center of the magnetic flux surface. The amplitude of the normalized current density is visually represented through the colour bar on the right. (a) The eddy current spreading on the conformal wall. (b) The eddy current spreading on the wide PSP; the PSPs are indicated by two pairs of green lines. (c) The eddy current spreading on the thin PSP; the PSPs are indicated by two pairs of green lines.
Once the MARS-F has been proved to be usable to test the effect of PSP, it is possible to give suggestions for the PSP engineering design. The following is the simulation result of VDE against PSP under the HITO scenario.
The computational models for the EHL-2 VDE analysis are shown in figure 10(a). As shown in figure 10(b), the eddy current spreading of the HITO scenario with an ideal imaginary conformal wall (blue line in figure 10(a)) is predominantly concentrated in the region between roughly 15 and 60 degrees starting in the x-positive direction. This finding implies that the most feasible location for installing PSP to mitigate the VDE would be within this angular range when only MHD instability is taken into account.
Figure
10.
(a) Schematic representation of the HITO equilibrium’s plasma boundary, where the pink line delineates the LCFS of the plasma, the blue line indicates an imaginary conformal wall closely fitting the plasma LCFS with conductivity of 0 (representing vacuum), the upper and lower PSPs are represented in red lines, conforming to the shape of the imaginary conformal wall. (b) Eddy current spreading on the conformal wall as depicted in figure 10(a). The x/y axes represent the toroidal and poloidal angles of the entire wall in degree, respectively. The 0-degree angle starts at the positive x-axis direction from the center of the magnetic flux surface. The amplitude of the normalized current density is visually represented through the colour bar on the right. The X-points of both LCFS and imaginary conformal wall are smoothed to avoid numerical error in MARS-F code
For the purpose of a more realistic scenario of VDE assessment, the PSPs with fixed wall time τw of 104τA, and conductivity of 10−4 were introduced into the simulation. These PSPs are shown by the red lines in figure 10(a) with the same shape of the conformal wall as shown by the blue lines in figure 10(a), and similar width as main eddy current width along poloidal angle shown by the bright part in figure 10(b). It should be noted that these PSP design parameters may not fall within the realm of engineering feasibility, but they remain pertinent for conducting a thorough physics analysis. The result shows some agreements with the eddy current spreading on the conformal wall result, and figure 11 is the mode spectrum of the one of the results.
Figure
11.
Poloidal Fourier harmonics of eigen function (the radial displacement) of the simulation result of PSP case as depicted in figure 10(b). The number on the dotted lines is the corresponding poloidal m number, the x-axis is the normalized poloidal flux, and the y-axis is the imaginary part of radial displacement.
In figure 11, the m=1, n=0 mode exhibits a significantly larger amplitude than other modes, which exactly matches the expectation that the VDE is the most unstable mode in the HITO scenario among all of the n=0 modes. Further refinement of both passive and active control methods for the VDE could be guided by this observation.
5.
Control of the neoclassical tearing modes by electron cyclotron current drive in EHL-2
Statistical investigations in JET ITER-like wall experiments show that more than 90% of major disruptions are related to the existence of large magnetic islands, and the NTM is the most important physics factor among the triggering causes [6]. Large magnetic islands due to the NTM could significantly limit the performance of advanced tokamak devices and easily lead to the plasma disruption once the island width exceeds a critical value. If the NTM is uncontrolled, confinement degradation of the high-temperature plasmas in the core region may be the least unfavourable consequence, along with damage of the fusion devices. Thus, the control of NTM is essential for the steady operation of EHL-2. So far, the most effective way to suppress the NTM islands in experiments is ECCD [25–27]. Externally injecting electron cyclotron wave into tokamak plasmas could drive extra current. The extra EC current deposited in the vicinity of the O-point of the NTM islands could compensate the lack of bootstrap current, which is due to the pressure flattening near the island region since the bootstrap current is proportional to the pressure gradient [28]. The effectiveness of ECCD for NTM control has been repeatedly validated both experimentally and numerically [29–36]. Therefore, in this section, we numerically assess the ECCD schemes for NTM controlling in the HITO scenario and in the high-performance SSO scenario of EHL-2 using MHD@Dalian Code (MDC) [28, 35–37]. In MDC, a set of reduced MHD equations in cylindrical geometry (r, θ, z) is employed. Nonlinear evolving bootstrap current is included for numerical modelling on the nonlinear evolution of NTMs. Westerhof–Pratt’s closure relation [38] is adopted for the numerical modelling of ECCD. EC-driven current density is coupled into the MHD equations via modified Ohm’s law.
Before the assessment of the required ECCD schemes, the nonlinear features of the TMs/NTMs should be investigated first. In order to simulate TM in the HITO scenario of EHL-2, polynomials are adopted to fit the original equilibrium profiles. On the basis of the fitted pressure and safety factor profiles, the new equilibrium on the MDC simulation mesh could be obtained via interpolation. Focusing on the most dangerous TMs/NTMs, m/n=2/1 and m/n=3/2 helicities are investigated. It is found that the m/n=2/1 TM is linearly unstable and the m/n=3/2 TM is linearly stable. Considering the difference between the simple numerical model and the complicated experiments, the linear analysis may need to be further investigated in the next step when more accurate physics effect is included. The NTM-related typical parameters are set as the magnetic Reynolds number S−1A=5×10⁻⁷, the Reynolds number R−1=10−7, the parallel thermal transport coefficient χ∥=10a2/τA, and the perpendicular thermal transport coefficient χ⊥=10−6a2/τA, with a being the minor radius and τA being the Alfvén time. The bootstrap current fraction fb=∫a0jb0rdr/∫a0jz0rdr. The ECCD-related typical parameters are set as the collision frequencies ν1=2.5×10⁻³τ−1A and ν2=5×10⁻⁴τ−1A, and the resonant parallel electron velocity vpres=2VA, with VA being the Alfvén velocity. The ECCD is aiming at the rational surfaces or the O-points of the magnetic islands. The ECCD deposition region widths in the radial direction Δrd=0.1a, and in the helical angle direction, Δξd=0.4×2πrad.
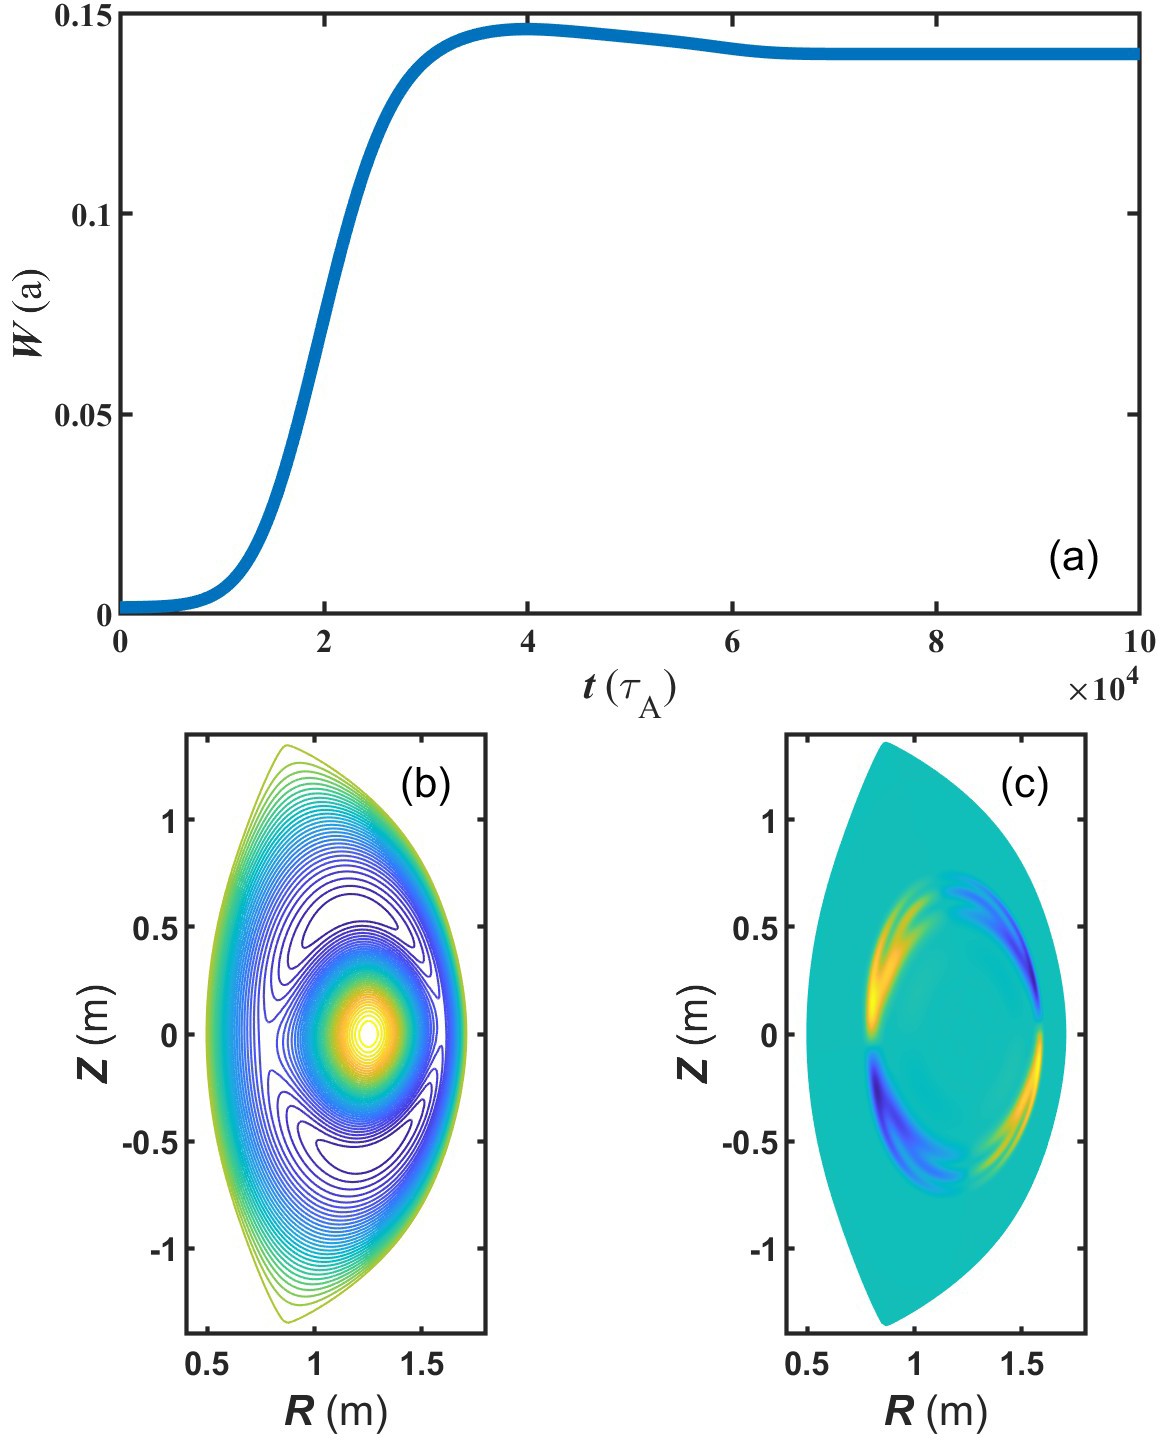
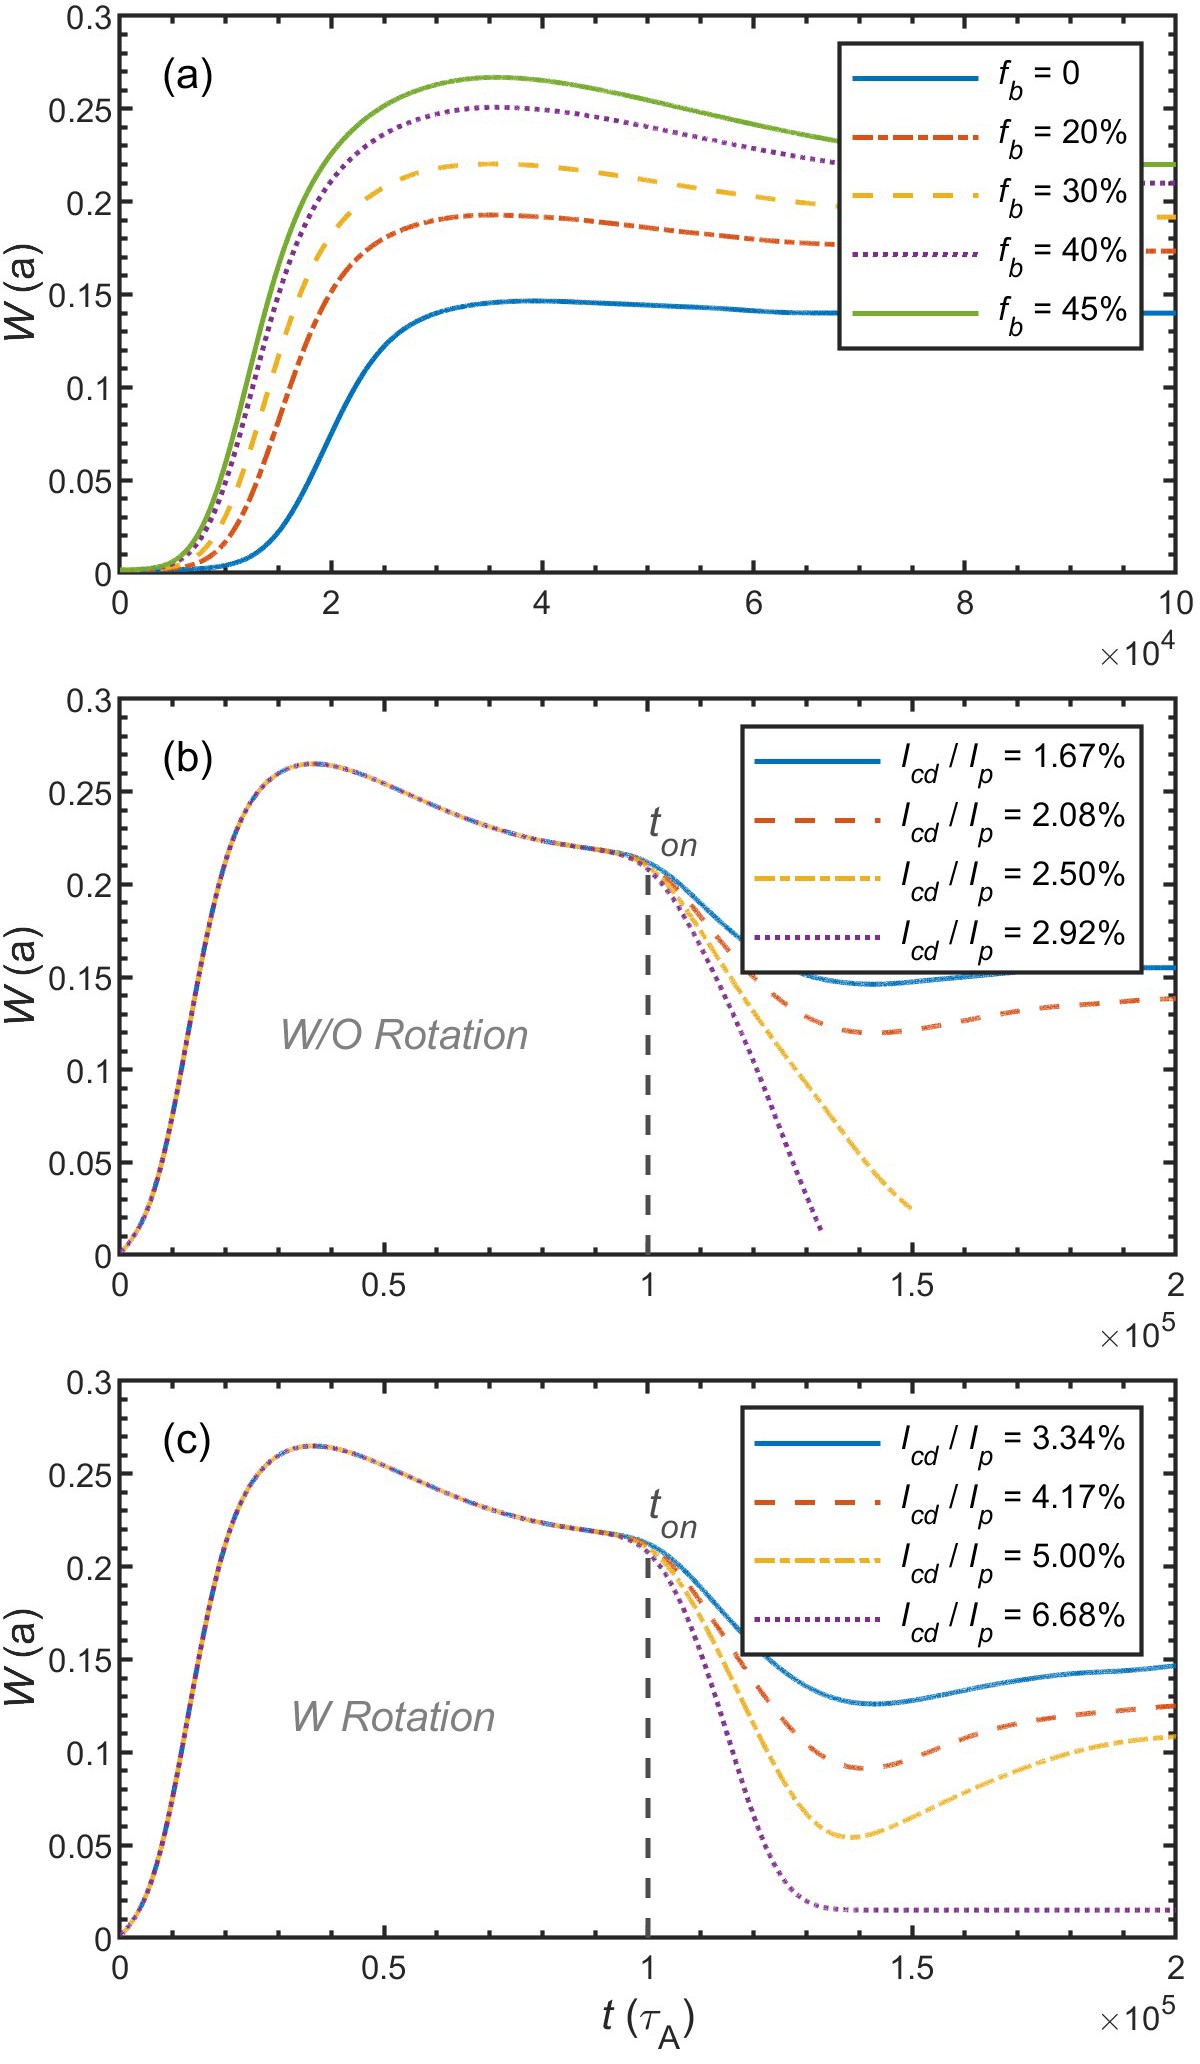
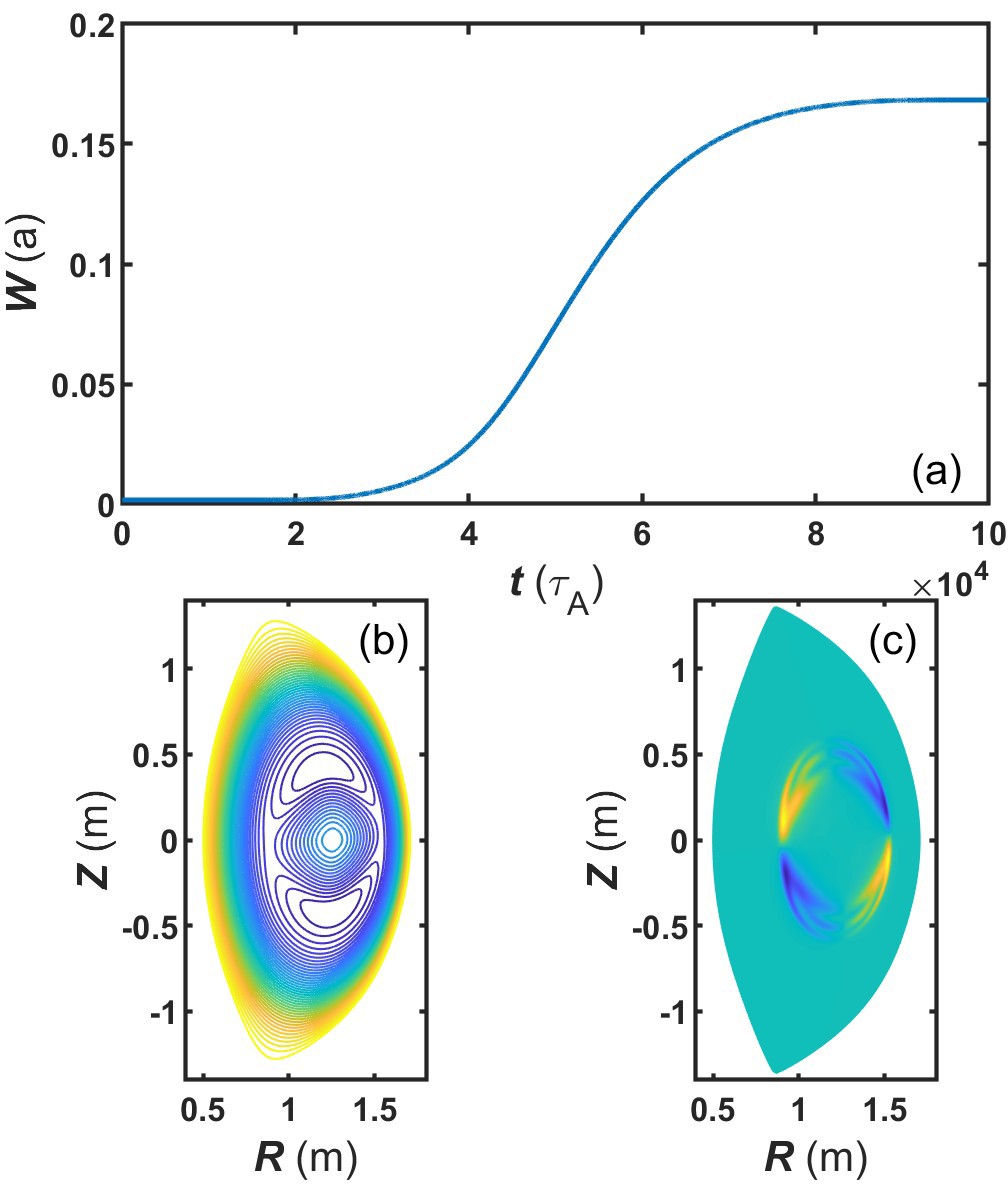
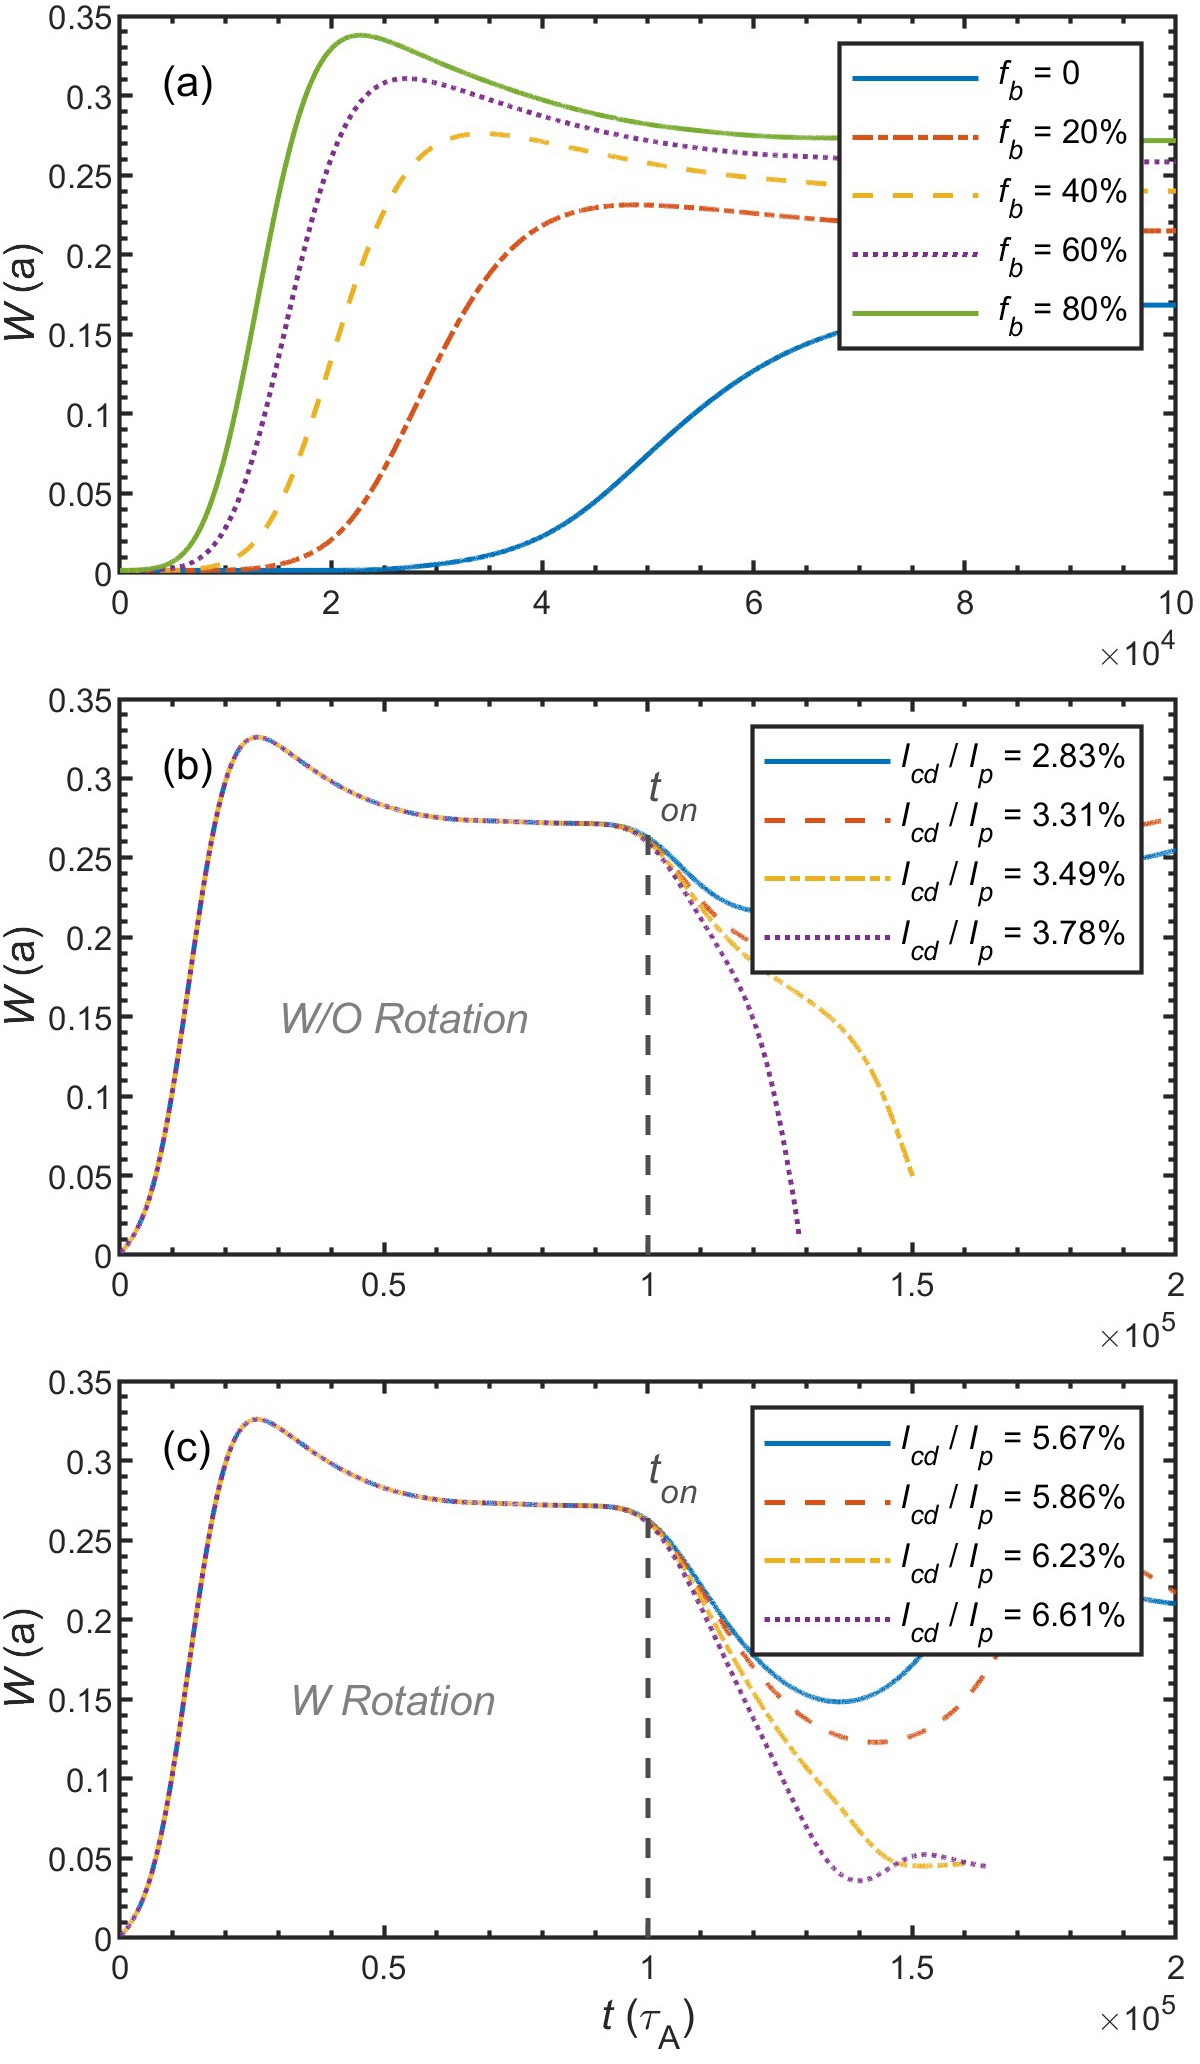
Figure 12 shows nonlinear evolution of the m/n=2/1resistive TM magnetic island width in the HITO scenario of EHL-2, together with corresponding magnetic island structure and plasma flow pattern in the saturation phase. The m/n=2/1 TM magnetic island is relatively close to the plasma boundary, whose width is about 14% of the minor radius. Considering that the fraction of bootstrap current for the HITO scenario of EHL-2 is about 45%, the evolution of magnetic island with various fractions of bootstrap current is investigated here. Figure 13(a) shows that during the saturated phase, it is expected for island width to be nearly 22% of the minor radius when the bootstrap current fraction reaches 45%. Large magnetic island like this could easily cause major disruption during discharges. Thus, the ECCD control of NTMs is almost an essential option for EHL-2. It should be mentioned that the saturated width for m/n=3/2 NTM magnetic islands is less than 5% of the minor radius even under 45% bootstrap current, according to the numerical results. Thus, the ECCD control will be focused on m/n=2/1 NTM. As for ECCD controlling, here two different schemes are attempted. Usually, the ECCD will be directly aiming at the rational surface to control the magnetic islands. For some low-torque advanced tokamak devices such as ITER, the island may be locked before the saturation [39]. Thus, one may consider to intendedly lock the mode so that the ECCD could be aiming at the O-points of the magnetic island to increase the deposition efficiency and lower the required input power. Figure 13(b) shows the scheme of the locked mode, and the ECCD is aiming at the O-points of the m/n=2/1 NTM magnetic island. The ECCD is turned on after the NTM is saturated. It is found that, with increasing the strength of the driven current, the saturated island width is gradually reduced. Numerical results show that the required driven current for completely suppressing the magnetic island could be nearly 2.50% of the total plasma current (3 MA). Figure 13(c) displays the case in which the island is not locked. Thus, the ECCD is aiming at the initial m/n=2/1 rational surface. In this case, the required driven current for completely suppressing the magnetic island could be as high as 6.68% of the total plasma current (3 MA).
Figure
12.
(a) Temporal nonlinear evolution of the m/n=2/1 resistive TM magnetic island width in the HITO scenario of EHL-2. (b) Magnetic island structure and (c) plasma flow pattern of the m/n=2/1 resistive TM during the saturation phase (t=105) shown in (a) obtained via the MDC simulation.
Figure
13.
(a) Nonlinear evolutions of the m/n=2/1 NTM magnetic island width under different fractions of bootstrap current in the HITO scenario of EHL-2. (b) Nonlinear evolutions of the m/n=2/1 NTM magnetic island width under 45% bootstrap current with different ECCDs turning on during the saturated phases. (c) Employing rigid plasma rotation based on (b).
For the simulation in the high-performance SSO scenario, the pre-treatment of the equilibrium profiles is the same, and the nonlinear features of the TMs/NTMs are also assessed first. It is found that the m/n=2/1 TM is linearly unstable and the m/n=3/2 TM is linearly stable, which is similar to the HITO scenario. Also, the real experiments may be more complicated and should be further investigated in the future. Figure 14 shows nonlinear evolution of the m/n=2/1 resistive TM magnetic island width in the high-performance SSO scenario of EHL-2. The corresponding magnetic island structure and plasma flow pattern in the saturation phase are also displayed therein. Compared to the HITO scenario, the m/n=2/1 TM magnetic island is closer to the plasma core region, and the island width is a little bit larger, nearly 17% of the minor radius. Similar to the HITO scenario, the evolution of the magnetic island with various fractions of bootstrap current is also investigated and shown in figure 15(a). It is noted that the fraction of bootstrap current in the high-performance SSO scenario is extremely large, up to 80% of the total plasma current. Due to the large fraction of bootstrap current, the NTM island is faster reaching saturation phase than the classical case (fb = 0). According to the numerical results, the saturated width of the m/n=2/1 NTM magnetic island is more than 27% of the minor radius when the bootstrap current fraction reaches 80%, which is even more dangerous than that in the HITO scenario. Considering that the island is closer to the plasma core region, the lock mode scheme may not be effective. Figure 15(b) shows the scheme of the locked mode in which the ECCD is aiming at the O-points of the m/n=2/1 NTM magnetic island. The ECCD is turned on after the NTM is saturated. Different from the HITO scenario, in which the saturated width gradually decreases with increasing driven current, the magnetic island width is hardly reduced unless the driven current is beyond a threshold. This phenomenon is similar to the previous work [34, 40], which is apt to occur under large fraction of bootstrap current. Numerical results show that the required driven current for almost completely suppressing the magnetic island could be nearly 3.49% of the total plasma current (1.5 MA). Figure 15(c) displays the case in which the island is not locked. Thus, the ECCD is aiming at the initial m/n=2/1 rational surface. In this case, the required driven current for completely suppressing the magnetic island could be as high as 6.23% of the total plasma current (1.5 MA).
Figure
14.
(a) Temporal nonlinear evolution of the m/n=2/1 resistive TM magnetic island width in the SSO scenario of EHL-2. (b) Magnetic island structure and (c) plasma flow pattern of the m/n=2/1 resistive TM during the saturation phase (t=105) shown in (a) obtained via the MDC simulation.
Figure
15.
(a) Nonlinear evolutions of the m/n=2/1 NTM magnetic island width under different fractions of bootstrap current in the high-performance SSO scenario of EHL-2. (b) Nonlinear evolutions of the m/n=2/1 NTM magnetic island width under 80% bootstrap current with different ECCDs turning on during the saturated phases. (c) Employing rigid plasma rotation based on (b).
To summarize, MDC simulations show that the saturated island width in the HITO scenario of EHL-2 is about 0.22a. The required ECCD for the suppression of the saturated NTM could be above 6.68% of the total plasma current (3 MA). Considering that the island is close to the plasma boundary, it is suggested to attempt to lock the mode to lower the required power of ECCD, which could be about 2.50% of the total plasma current (3 MA). It is noted that mode-locking may increase the possibility of major disruption if the ECCD is not timely turned on. Thus, this scheme should be carefully considered and operated. For the high-performance SSO scenario, the saturated island width is more than 0.27a. The required ECCD for the suppression of the saturated NTM could be above 6.23% of the total plasma current (1.5 MA). The high faction of bootstrap current causes a problem that the island width is barely reduced unless the ECCD exceeds a critical value. Thus, it is suggested to using large ECCD as much as possible in that case. It is noted that the error filed is considered to be the reason that the mode is locked in the investigation of the mode-locking control method here. If resonant magnetic perturbation (RMP) is adopted to lock the rotating mode, the required EC input power may be larger than the case shown in this work due to the extra destabilizing effect of RMP [41]. This situation with RMP could be further assessed in the future. Moreover, previous work shows that by using modulated ECCD at a small island width, the required ECCD for stabilizing NTM may be reduced [33]. Similar simulations for NTM control via ECCD have been carried out in HL-2A/3 [42–44], showing that NTMs can also be effectively suppressed via ECCD in conventional tokamaks. Considering that the fraction of bootstrap current is much larger in EHL-2, especially for the SSO scenario up to 80%, the control of NTMs might be more challenging than that in HL-2A/3. To provide a more realistic assessment of NTM, a comprehensive simulation model may be developed and utilized to yield results that more closely align with experimental observations.
6.
Discussion and conclusion
Designing and constructing the EHL-2 offered unique opportunities and challenges for understanding the MHD activities on spherical torus. In this work, the low n ideal MHD insatiability has been extensively investigated under no wall, ideal conformal wall, ideal designed wall, and resistive designed wall conditions. The difference between βN limit of the resistive wall and ideal wall case suggests that the vacuum vessel might be too far away from the plasma to provide a stabilization effect. Additionally, the influence of plasma rotation in the context of the resistive wall case has been explored to assess a more realistic result. Considering the large elongation and the updating time of the EHL-2’s equilibrium, a linear VDE of HITO scenario was analyzed. This analysis has enabled us to generate an eddy current map, illustrating the spread of eddy currents on an imaginary conformal wall in both toroidal and poloidal directions. The map identifies the optimal orientation for the PSP. We have positioned a corresponding PSP at the eddy current’s center, and the results indicate that the VDE dominates the instability and remains unstable under the given mitigating conditions. For NTM, we numerically assessed the ECCD schemes for NTM control, and the results indicate that the current ECCD engineering design is sufficient to stabilize NTM.
There will be some improvement in future work based on the analysis result reported above. The linear VDE analysis will give more feasible engineering solutions for PSP designs. To provide a more realistic assessment of NTM, other simulation models are under development to benchmark with the current result. For the active control of EHL-2, plans for conducting comprehensive scans of the optimal poloidal positions range of feedback gain amplitude and phase of these coils for maximum stabilization efficacy (RWM in the first stage) have been put forth. The impact of boron content in the plasma on MHD behaviour will also be analyzed, in recognition of its potential influence on the EHL-2’s stability and performance.
Acknowledgment
The authors are very grateful for the supports from the ENN team, Qingquan Yu, and the developers of both MARS-F and MDC codes.
Jardin S C, Clauser C and Ferraro N 2020 Vessel forces from a vertical displacement event in JET and ITER (Invited Talk ID #124 at the IAEA Technical Meeting on Disruptions, Virtual Meeting

 DownLoad: