Figure
1.
The computation domain and the boundary conditions for the ionic species.
| Citation: |
Qingqing GAO, Xiaohua WANG, Kazimierz ADAMIAK, Aijun YANG, Dingxin LIU, Chunping NIU, Jiawei ZHANG. The current pulses characteristics of the negative corona discharge in SF6/CF4 mixtures[J]. Plasma Science and Technology, 2023, 25(2): 025404. DOI: 10.1088/2058-6272/ac8f31

|
This paper presents the results of numerical investigation of the current pulses characteristics in SF6/CF4 mixtures for the negative point-plane corona discharge. The pressure and the temperature of gas mixtures are 0.4 MPa and 300 K, respectively. The CF4 content varies from 20% to 80%. The 2D axisymmetric geometry with point-plane electrodes is investigated, and the three drift-diffusion equations are solved to predict the characteristics of the negative corona discharge. In addition, Poisson's equation is coupled with the above three continuity equations to calculate the electric field. In order to calculate the electron impact coefficients, including the Townsend ionization and attachment coefficients, as well as the mobilities and diffusion coefficients for electrons, the two-term Boltzmann equation is solved. The characteristics of three ionic species at five stages of the first current pulse in 60%SF6-40%CF4 and 20%SF6-80%CF4 mixtures are selected to discuss the development mechanism of current pulses. Moreover, the reduced electric field strengths at the corresponding time instants are presented to help understand the discharge process. The current waveform and the total number of three species are compared in all the cases to analyze the effects of the CF4 content on the discharge. The reduced electric field strength is also helpful in understanding the effects of CF4 content. When the CF4 content increases to 80%, the discharge is more intensive and the pulse frequency also increases.
SF6 has excellent insulation properties, and also can effectively quench the arc. Therefore, it is widely used as the insulation gas in gas-insulated switchgears (GISs), high-voltage gas circuit breakers (HV GCBs) and semiconductor plasma processing industries. Unfortunately, SF6 has a high global warming potential (GWP), and its value is almost 22 800 times higher than that of CO2. Moreover, the liquefaction temperature of SF6 is relatively high at higher pressures. This limits the use of SF6. Therefore, it is urgent to find proper SF6 substitutes to reduce the greenhouse effect, which would satisfy the requirements of extremely cold environment. Among the possible SF6 substitutes, SF6/CF4 mixtures are one of the most promising candidates to replace pure SF6. They have already been successfully applied in the circuit breaker in Manitoba, Canada [1].
However, during the manufacturing, installation and transportation of gas-insulated equipment, burrs and metal particles can inevitably be left behind, causing the distortion of the field strength in the equipment and they initiate partial discharge, which appears mainly in the form of corona discharge [2]. The discharge current in negative corona often has a pulse waveform, and this phenomenon has attracted attention of many researchers. Many experimental and simulation data have been published to reveal details of the negative corona discharge in air related gases, like air, N2 or O2 [3, 4]. However, for SF6 and SF6 gas mixtures, just a few investigations of the discharge mechanism have been published. Morrow [5] first developed a 1D numerical simulation model for the positive corona discharge in SF6. Later, Espel et al [6], Dhali et al [7] and Wang et al [8] performed a lot of research work on the corona discharge in SF6, advancing the simulation model to 2D. However, only the drift and diffusion of electrons have been included in most cases. Saleh et al [9] established a self-consistent 1D model for SF6 and analyzed the sensitivity of the discharge current to the rise time of the applied voltage. In authors' previous work [10], a 2D axisymmetric geometry with point-plane electrodes was developed to analyze the negative corona discharge in point-plane electrodes in SF6 gas. The continuous pulse current waveform has been obtained. The current waveform under different swarm and discharge parameters were compared to analyze the discharge mechanism. Zeng et al [11] developed a 2D hybrid model for corona discharge in SF6 gas, but only one pulse can be obtained using this technique. Cernak et al [12] suggested that the diffusion model is not valid and should be improved by including the formation of the positive streamers and replacing the local field approximation with the local energy approximation. However, such a model would be extremely complicated and would require extensive computer memory and calculation time. Therefore, the model must be simplified to obtain an approximate solution in reasonable time using available computers. The model developed in the authors' previous work [10] can be useful in practical SF6 insulation systems.
This paper reports the results of investigations of the current pulse characteristics of SF6/CF4 mixtures in negative corona discharge with the pressure of 0.4 MPa. The temperature of gas mixture is 300 K. The 2D axisymmetric geometry of point-plane electrode system is considered to numerically simulate the propagation of the corona discharge. The three continuity equations for the three species are solved to analyze the discharge mechanism and predict the current pulse characteristics. In addition, Poisson's equation is coupled with the above three equations to calculate the field strength at each instant of time. The magnitude and the pulse interval under different CF4 contents are compared to interpret the influence of CF4 content on the current waveform. The concentrations of the three species and the reduced field strength are also investigated to analyze the negative corona discharge in SF6/CF4 mixtures and the influence of the CF4 content on the current pulses properties.
The current pulse characteristics of negative corona discharge in SF6/CF4 mixtures are investigated in a 2D axisymmetric geometry assuming the point-plane electrodes. The pressure of SF6/CF4 mixtures is 0.4 MPa, a common pressure in GIS. The temperature of the gas mixtures is room temperature, which means 300 K. Figure 1 presents the computation domain. The discharge is generated between two electrodes: the point and the plane ones. The tip curvature of the point electrode is 0.3 mm. The gap between both electrodes is 8 mm. The computation domain is 30×36 mm2, which has been used before to obtain a reasonable simulation results of the characteristics of the corona discharge [10]. The high voltage is applied on the point electrode, while the plane electrode is connected to the ground. The voltage applied to the point electrode is -25 kV. This choice is due to the fact that the corona discharge starts to appear when the absolute value of voltage is 20 kV, and the breakdown of the gases can occur when the absolute value of voltage reaches 30 kV [10].
It is commonly accepted that the combination of thee continuity equations for the ionic species with Poisson's equation for the electric field is adequate to simulate the corona discharge and predict the discharge current waveform [3]. Therefore, we included the three species in the computational model: electrons, the positive and the negative ions. The drift-diffusion equation for electrons, which includes the ionization and attachment reactions and the recombination of electrons with positive ions, has the following form:
| ∂ne∂t+∇⋅(−μe→Ene−De∇ne)=αne|μe→E|−ηne|μe→E|−kepnenp, | (1) |
where t is time, ne, De, μe represent the electron number density, the electron diffusion coefficient and the electron mobility, respectively. →E is the field strength, α is the ionization coefficients, η is the attachment coefficients, kep denotes the recombination coefficients of electrons with positive ions.
The drift-diffusion equation for the positive ions, including the impact ionization, the recombination of electrons with positive ions and the recombination of positive ions with negative ions, is as follows:
| ∂np∂t+∇⋅(μp→Enp−Dp∇np)=αne|μe→E|−kepnenp−knpnnnp, | (2) |
where np, Dp, μp, are the ion number density, the diffusion coefficient and the mobility of positive ions, respectively, knp represents the recombination coefficients of positive ions with negative ions.
The drift-diffusion equation for the negative ions, which includes the electron attachment and the recombination of positive ions with negative ions is given as:
| ∂nn∂t+∇⋅(−μn→Enn−Dn∇nn)=ηne|μe→E|−knpnnnp | (3) |
where nn, Dn, μn are the negative ion number densities, the diffusion coefficient and the mobility of negative ions, respectively. The values of the swarm parameters are described in detail in section 2.2.
The photoionization process can be ignored in the corona discharge with negative polarity. Poisson's equation governs the electric potential distribution:
| ∇2V=−e(np−ne−nn)εrε0, | (4) |
where V is the applied voltage, ε0 represents the vacuum permittivity, e denotes the electron charge, εr is the relative gas permittivity.
This equation is coupled with the three continuity equations to form a self-consistent mathematical model for the characteristics of the discharge. Figure 1 shows the boundary conditions for the ionic species. At the point electrode, the boundary condition for the number density of electrons is provided by the secondary electron emission and the boundary condition for the positive ions is the outflow condition (the diffusion transport is zero). For the negative ions, zero concentration is applied as the boundary condition at the point electrode. At the plane electrode, the boundary conditions for the negative ions and electrons are the outflow conditions, while for the positive ions, the boundary condition is a zero concentration. For other boundaries, the boundary conditions are set as open boundary.
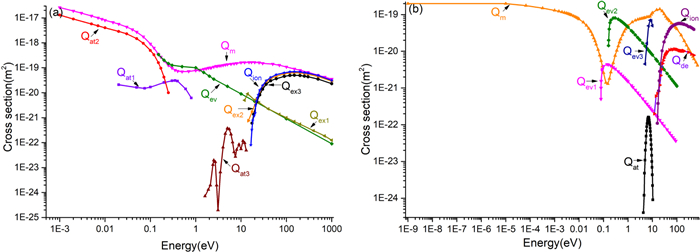
For the SF6/CF4 mixtures, the Townsend ionization coefficients, Townsend attachment coefficients, the electron mobility and the electron diffusion coefficients are the most important parameters to predict the discharge mechanism. These parameters are calculated by the Bolsig+software [13], which solves the two-term Boltzmann equation. The collision cross sections of SF6 and CF4 are the input parameters for this software. From many available databases, the Morgan database for SF6 [14] and the Bordage database for CF4 [15] are chosen in this model. Figure 2 shows the collision cross sections of SF6 and CF4. For SF6, the collision cross sections for the ionization reaction (Qion), the attachment reaction (Qat1-Qat3), the vibrational excitation reaction (Qev), the electric excitation reaction (Qex1-Qex3) and the momentum transfer reactions (Qm) have been considered. For CF4, the cross sections for the ionization reaction (Qion), the attachment reaction (Qat), the vibrational excitation reaction (Qev1-Qev3), the dissociative excitation reaction (Qde) and the momentum transfer reaction (Qm) have been included. The full reactions in the model are presented in table 1.
| Number | Reaction | Symbol | Energy (eV) |
| 1 | e+SF6 = > F+SF5- | Qat1 | 0 |
| 2 | e+SF6 = > SF6- | Qat2 | 0 |
| 3 | e+SF6 = > SF6- | Qat3 | 1.3 |
| 4 | e+SF6 = > e+SF6 | Qm | / |
| 5 | e+SF6 = > e+SF6(V1) | Qev | 0.095 |
| 6 | e+SF6 = > e+SF6* | Qex1 | 10 |
| 7 | e+SF6 = > e+SF6* | Qex2 | 11.7 |
| 8 | e+SF6 = > e+SF6* | Qex3 | 15 |
| 9 | e+SF6 = > 2e+SF6+ | Qion | 15.7 |
| 10 | e+CF4 = > CF2-+F2 | Qat | 0 |
| 11 | e+CF4 = > e+CF4 | Qm | / |
| 12 | e+CF4 = > e+CF4(V1) | Qev1 | 0.078 |
| 13 | e+CF4 = > e+CF4(V2) | Qev2 | 0.159 |
| 14 | e+CF4 = > e+CF4(V2) | Qev3 | 0.4 |
| 15 | e+CF4 = > e+CF* 4 | Qde | 10 |
| 16 | e+CF4 = > 2e+CF4+ | Qion | 15.9 |
 DownLoad:
CSV
DownLoad:
CSV
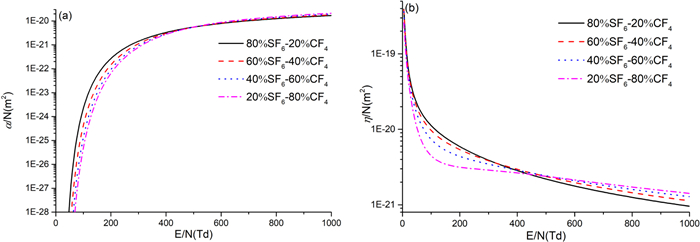
The content of CF4 in the gas mixture increases from 20% to 80%. The relationship between the Townsend ionization coefficients and the reduced field strength for different SF6/CF4 mixtures is shown in figure 3(a). The variation of the Townsend attachment coefficients with the reduced field strength is shown in figure 3(b). The Townsend ionization coefficient increases with the reduced field strength (E/N). However, the Townsend attachment coefficient decreases with E/N. As the percentage of CF4 increases, the ionization coefficient decreases with E/N when it is lower than 500 Td, while when E/N is greater than 500 Td, the ionization coefficient is generally enhanced with the CF4 content. The attachment coefficient decreases with the CF4 content when the value of E/N is smaller than 420 Td, while it increases when the value of E/N is larger than this value. Other discharge parameters containing the mobility of the positive and negative ions as well the recombination coefficients of electron-positive ions and positive ions-negative ions were obtained from the work of Morrow [16]. The diffusion coefficients for the positive and negative ions were calculated from the Einstein relation. As the masses of positive and negative ions are much larger than that of the electron, the drift velocities of the positive and negative ions are much smaller. In addition, the diffusion coefficients of the positive and negative ions are less than 10-5 m2 s-1. Therefore, the electric field dependent mobility of positive and negative ions in SF6/CF4 mixtures is assumed to be the same as in pure SF6. The recombination coefficients of the electrons-positive ions and positive ions-negative ions are about 10-13 m3 s-1 to 10-10 m3 s-1 for CO2, N2, SF6, etc. Therefore, we use the same recombination coefficients in the mixtures as in pure SF6.
For the negative corona discharge, the secondary electrons is needed to obtain a self-sustained discharge. In the presented model, the secondary electrons are generated by the collision of the positive ions with the tip of the point electrode. The number density of electrons at the point electrode is assumed to be proportional to the electron emission coefficient, the number density of the positive ions and their mobility. The electron emission coefficient can change the frequency of the consecutive pulses and is often determined empirically [10]. In this model, the value of 0.01 is chosen.
The COMSOL commercial software is used to implement the above mathematical model. The initial number densities of the positive ions and electrons are assumed to be the same and they follows a Gaussian distribution with a maximum value of 1016 m-3. The initial number density of negative ions is assumed as zero. The discharge current is calculated from Sato's formula [17]. All three species contribute to the overall discharge current:
| I=1|V|∬ | (5) |
where I is the discharge current, r and z are the cylindrical coordinates, E is the actual (Poissonian) field strength, EL represents the Laplacian field strength, S denotes the computation domain.
The current pulses, the temporal and spatial characteristics of three species in the negative corona discharge in SF6/CF4 mixtures with the CF4 content varying from 20% to 80% are presented to show the influence of CF4 addition on the properties of current pulses. In addition, the reduced field strength is also presented to better understand the corona discharge characteristics and the mechanism of developing the current pulses.
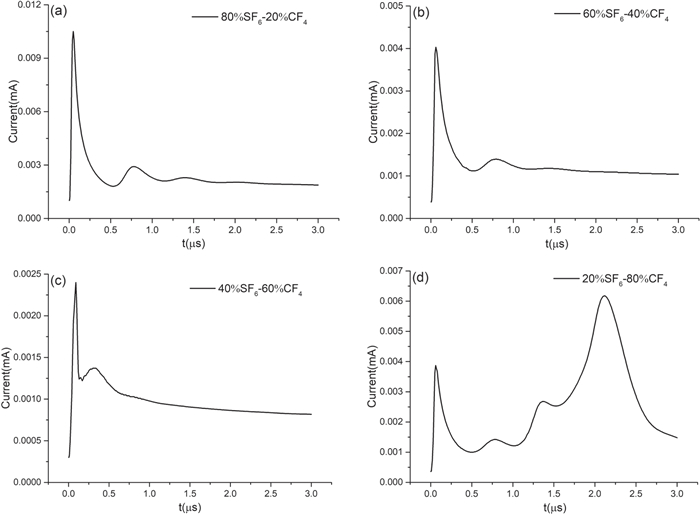
Figure 4 shows the current waveform in SF6/CF4 mixtures for the CF4 content varying from 20% to 80%. It can be seen from this figure that the amplitude of the discharge current in 80%SF6-20%CF4 mixture is about 0.0105 mA. When the percentage of CF4 increases to 40% and 60%, the magnitude of the current decreases to 0.004 mA and 0.0024 mA, respectively. When the CF4 content increases to 80%, the magnitude of the first pulse reaches almost 0.0038 mA, while the magnitudes of the second and third pulses are 0.0013 mA and 0.0025 mA, respectively. The peek value of the fourth current pulse in 20%SF6-80%CF4 mixture is about 0.006 mA. Therefore, the amplitude of the current pulse is reduced when the discharge time is smaller than 1 μs and then starts to increase after 1 μs, when the CF4 content increases to 80%. In 80%SF6-20%CF4 and 60%SF6-40%CF4 mixtures, the intervals between the first two pulses are almost identical. However, when the CF4 content is 60%, the time instant of the second pulse decreases to about 0.37 μs, leading to a reduction of the time interval between the first and second pulse. In 20%SF6-80%CF4 mixture, the interval between the first two pulses shows no obvious difference when compared with those in 80%SF6-20%CF4 and 60%SF6-40%CF4 mixtures. However, the third and fourth pulses in this case are more pronounced. The amplitude of the fourth pulse is even larger than that of the first pulse. Therefore, the amplitude of the current pulses decreases with time when the CF4 content is smaller than 60%. When the CF4 content is larger than 60%, the magnitude of the pulse first decreases and then increases, which is accompanied by the increase of the pulses frequency. This could be due to the dielectric constant of CF4 being about 0.42 relative to SF6 [18]. Therefore, the electric field can be easily larger than the critical electric field, causing the accumulation of electrons and positive ions through the ionization process. In addition, when the electric field is larger, it is more difficult to suppress electric field. The ionization reactions can continuously produce electrons and positive ions. Therefore, the magnitude of the current pulses increases with time. It can be concluded that the percentage of CF4 in the SF6/CF4 mixtures should not exceed 80%.
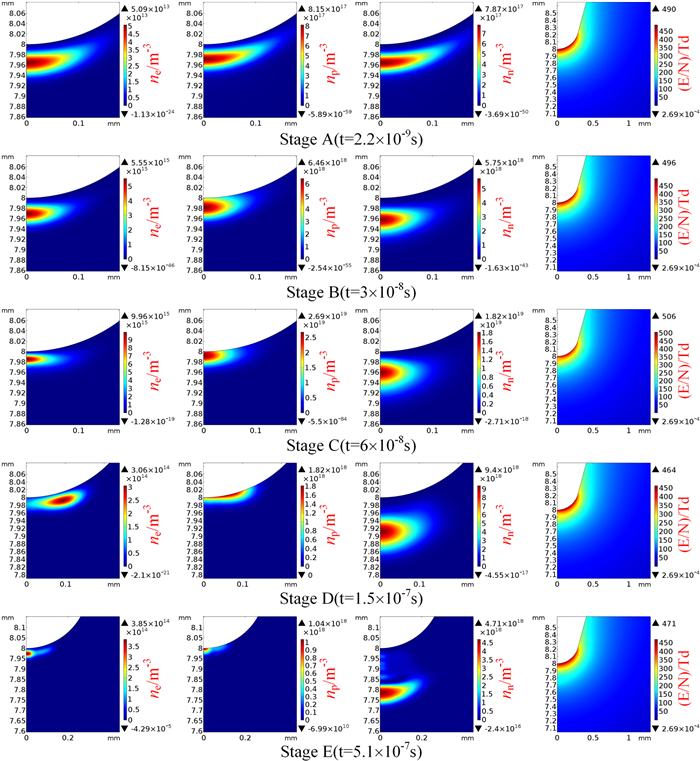
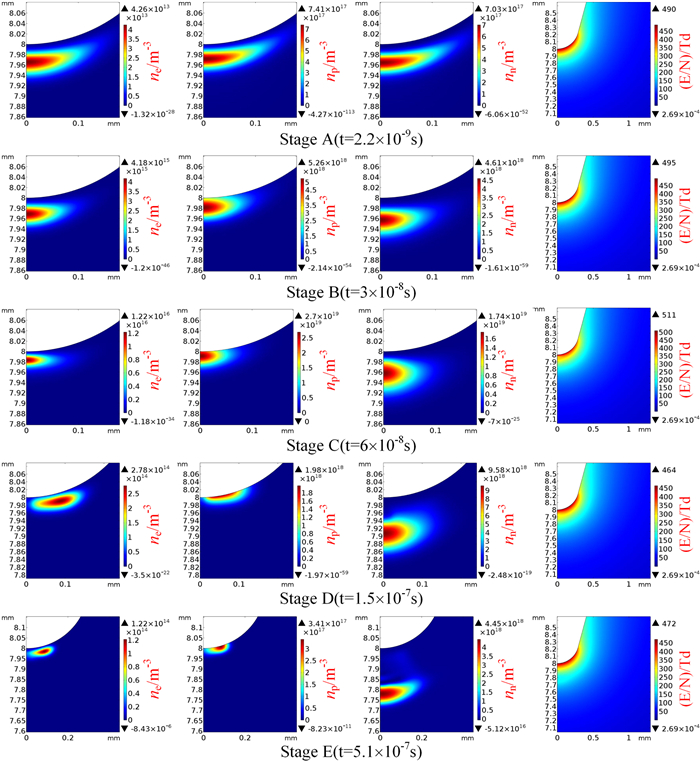
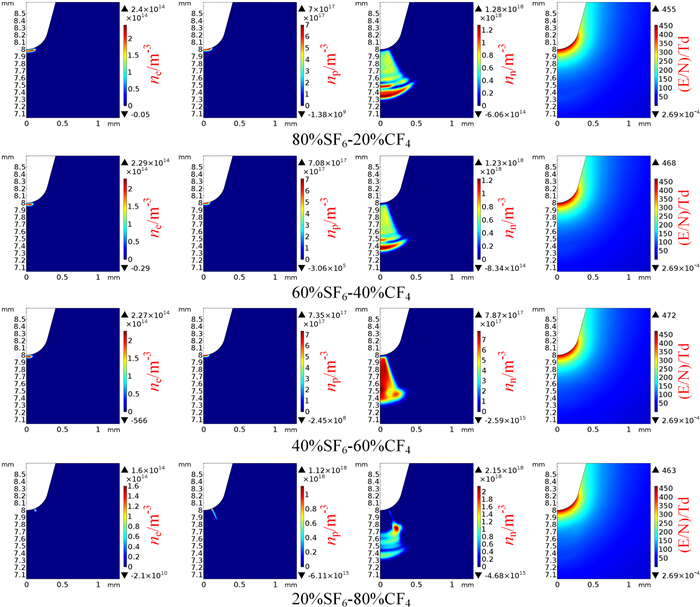
The distributions of the ionic species concentrations at different time instants help to understand the mechanism of the current pulse generation. Moreover, the corresponding field strength at each instant of time helps to interpret the relationship between the space charge and the field strength suppression. As the amplitudes of the first pulse in 60%SF6-40%CF4 and 20%SF6-80%CF4 mixtures are almost the same, the distributions of the ionic species and the reduced field strength in the two cases are shown and compared. Five characteristic stages of the discharge, including the initial stage (stage A, 0.0022 μs), half-peak rising stage (stage B, 0.03 μs), peak value stage (stage C, 0.06 μs), half-peak falling stage (stage D, 0.15 μs) and the end stage (stage E, 0.51 μs) of the first pulse cover the most important moments of the corona discharge and help interpret the formation of the current pulses. The distributions of the ionic species and the reduced field strength at these stages of the first pulse in 60%SF6-40%CF4 and 20%SF6-80%CF4 mixtures are shown in figures 5 and 6, respectively.
Figure 5 shows that the maximum densities of the electrons and positive ions are 5.09×10¹³ m-3, 8.15×10¹⁷ m-3 at stage A, the maximum density of the negative ions has the same order as the positive ions, and its value is 7.87×10¹⁷ m-3. The maximum reduced field strength at stage A is about 490 Td. Under the action of the electric field, both negative species (electrons and negative ions) move towards the plane electrode. However, the positive ions move towards the point electrode. Due to the electron impact reactions, especially the ionization and attachment process, the maximum densities of all species at stages B and C increase, and the maximum reduced field strength at stage C increases to 506 Td. With the increase of the negative ion concentration, the field strength starts to decrease. The reduced field strength on the z-axis between 7.9 mm and 8 mm in stage C is a little bit smaller than that in stage B. The positive ions in stage C concentrate nearer to the point electrode than in stage B and narrow the discharge region. Under a combined effect of the suppression caused by the negative ions and a narrower discharge region, the number densities of electrons and positive ions in stage D decrease. Moreover, the reduction of electron concentration also results in the reduction in the negative ion concentration. The negative ions drift further away from the point electrode as compared with that in stage C. In addition, the amplitude of the reduced field strength also reduces to 464 Td in stage D. The negative ions continuously drift away and occupy the region on the z-axis extending from 7.72 to 7.82 mm in stage E. The negative ions drift further away, so the field strength begins to recover. The maximum reduced field strength in stage E is 471 Td, and the reduced field strength in the region on the z-axis from 7.9 to 8 mm is larger than that in stage C, which means the field strength recovers. The amplitudes of the densities for positive ions and negative ions keep decreasing, while the maximum density of electrons increases. This could be due to the generation of secondary electrons by the collision of positive ions with the point electrode. The emission of secondary electrons helps to generate the next pulse.
Figure 6 shows that the number densities of the ionic species and the reduced field strength for the first pulse of 20%SF6-80%CF4 mixtures at five stages are very similar to those in 60%SF6-40%CF4 mixtures. The positive ions move towards the point electrode, and the electrons and negative ions drift towards the plane electrode. In stage C, the reduced field strength in the regions in the z-axis from 7.9 to 8 mm is reduced by the cloud of negative ions. The negative ions drift away in stage E, which is accompanied by the restoration of the field strength. The amplitude of the reduced field strength in stage C of 20%SF6-80%CF4 mixtures is 511 Td, which is only a little bit higher than that in 60%SF6-40CF4 mixtures.
In addition, the characteristics of the ionic species and the reduced field strength at the end of the simulation time for SF6/CF4 mixtures are also compared to analyze the influence of CF4 content on the stable corona discharge, as shown in figure 7. As seen in this figure, the clouds of negative ions decrease when the CF4 content increases to 60%, which means the number of pulses decreases, as one cloud represents a pulse. When the CF4 content increases to 80%, the number of clouds increases to 4, and four pulses are generated. In addition, the negative ions occupy the region on the z-axis from 7.3 to 8 mm when the CF4 content is smaller than 60%. However, when the CF4 content increases to 80%, the negative ion cloud drifts away from the point electrode, and occupies the regions on the z-axis extending from 7.3 to 7.7 mm. Moreover, the amplitude of reduced field strength enhances from 455 to 472 Td and then decreases to 463 Td.
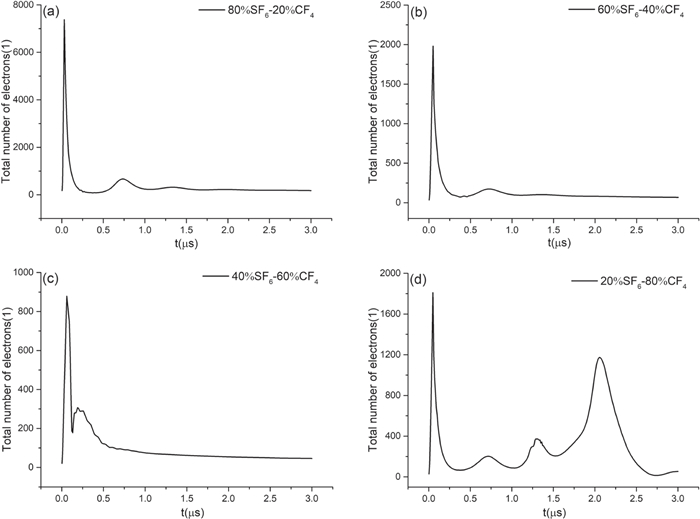
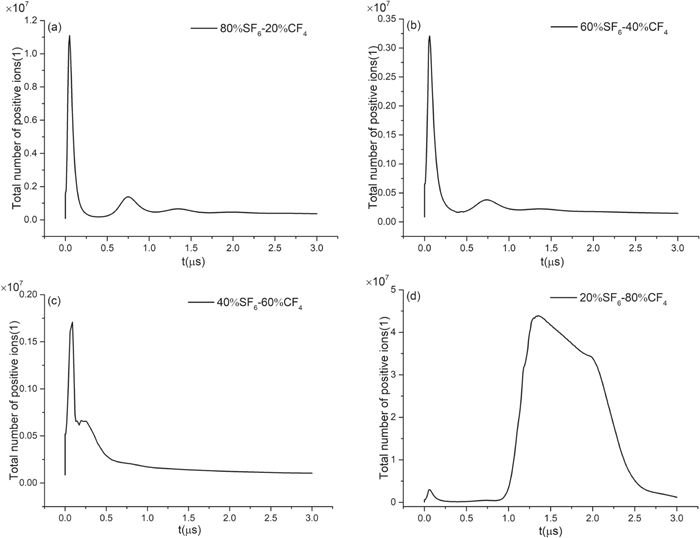
The variation trends of the ionic species with time for SF6/CF4 mixtures with the percentage of CF4 increasing from 20% to 80% are shown in figures 8–10. As seen in the figure 8, in all the cases the change of the total number of electrons over time shows the same waveform as the current. It should be noted that the total number was calculated by the integration of the species density over the entire discharge gap. The maximum value of the total number of electrons decreases with the CF4 content, when the CF4 content is smaller than 60%. In 20%SF6-80%CF4 mixtures, the total number of electrons is almost 1800. After 1 μs, the total number of electrons begins to increase and two peaks appear. When the percentage of CF4 is 20%, 40% and 60%, the total number of positive ions behaves similarly to the corresponding current curves (figure 9). The total number of positive ions in 20%SF6-80%CF4 mixtures increases dramatically after 1 μs, then gradually decreases. The maximum value can reach 4.4×10⁷. The total number of negative ions increases all the time in the four cases (figure 10). When the CF4 content increases to 60%, the maximum value of the total number of negative ions decreases. The growth rate of negative ions in 20%SF6-80%CF4 mixture is first slow and then much quicker. At the end of time, the total number of negative ions in 20%SF6-80%CF4 mixture is close to that in 80%SF6-20%CF4 mixture.
The variation of the reduced field strength with time for the CF4 content increasing from 20% to 80% is also presented in figure 11 to help to interpret the discharge mechanism within the first 3 μs of the discharge. When the CF4 content is less than 60%, the maximum value of the reduced field strength decreases with the CF4 content increasing. However, the minimum value of the reduced field strength increases with the percentage of CF4 (figure 11). The value of the reduced field strength after the discharge tends to stabilize at about 450 Td, 467 Td and 473 Td when the percentage of CF4 is 20%, 40% and 60%, respectively. However, for 20%SF6-80%CF4 mixture, the maximum and minimum values of the reduced field strength are almost the same with those in 60%SF6-40%CF4 mixture. The reduced field strength does not stabilize and there are several waves corresponding to the field strength suppression and field strength restoration processes.
All these observations can be explained using the basic corona discharge mechanism. With the CF4 content increasing, the Townsend ionization coefficient and Townsend attachment coefficient both increase when the reduced field strength is larger than 500 Td, while the growth rate of the Townsend attachment coefficient is higher than that of the Townsend ionization coefficient. Therefore, the effective ionization coefficient decreases with the CF4 content increasing, resulting in a reduction of the total number of electrons and positive ions. Moreover, the electrons will quickly form negative ions through the attachment process with neutral molecules. When the CF4 content is increasing, the reduction of the number of electrons also results in the reduction of the total number of negative ions. The accumulation of positive ions enhances the field strength near the tip of point electrode. Therefore, the reduction of positive ion number in higher CF4 content results in the reduction of the peak value of the reduced field strength. As the number of negative ions also decreases with an increased content of CF4, the suppression of the field strength by the negative ions is weakened, resulting in an increase of the minimum value of the reduced field strength. For 20%SF6-80%CF4 mixtures, the increase of the reduced field strength may be caused by the reduction of the relative permittivity and the weakening of the suppression by the negative ions. The dielectric constant of CF4 (0.42) is smaller than that of SF6 (1.00) [18]. Therefore, with an increased CF4 content, the relative permittivity of the SF6/CF4 mixtures decreases, resulting in an increase of the field strength, which sooner triggers the next pulse. Moreover, with a decreased SF6 content, the number of negative SF6 ions is also reduced. The reduction in the number of heavy negative ions can help the cloud of negative ions to drift further away and to reduce the field suppression effect. Then, the field strength can recover faster and the pulse frequency increases in 20%SF6-80%CF4 mixtures. The second factor may be the main reason for the different trends of the total number of ionic species and the field strength in 20%SF6-80%CF4 mixtures.
The current pulse characteristics of different SF6/CF4 mixtures in the negative corona discharge in a point-plane electrode are investigated in this work. Three continuity equations are solved to predict details of the corona discharge. In addition, the Poisson's equation is coupled with the three continuity equations to determine the field strength, so as to help analyze the development mechanism of the current pulses. The Townsend coefficients for ionization and attachment reactions, the mobility and diffusion coefficients for electrons were calculated by solving the two-term Boltzmann equation. The characteristics of the ionic species and the reduced field strength at five instants of time are compared to identify the mechanism of the current pulses in SF6/CF4 mixtures. By analyzing the influence of the CF4 content on the current waveform, the characteristics of the ionic species and the reduced field strength, the sensitivities of the current pulses characteristics to the CF4 content are clarified.
The maximum value of the discharge current is reduced with an increasing CF4 content when this content is no more than 60%, while it is increased for 20%SF6-80%CF4 mixture. The number of pulses also increases in 20%SF6-80%CF4 mixture. When the CF4 content is less than 60%, the total numbers of electrons and positive ions show the same trends as the current pulses. The maximum total numbers of both electrons and positive ions are reduced with an increased CF4 content. Moreover, the total number of negative ions also diminishes with the CF4 content. The maximum value of the reduced field strength at the tip of the point electrode is reduced with the CF4 content, while the minimum value of the reduced field strength is enhanced with this value. The reduced field strength after the corona discharge stabilizes also raises with the CF4 content. However, when the CF4 content reaches 80%, the magnitude of the total number of ionic species increases and the maximum value of the reduced field strength also increases. The reduced field strength does not stabilize, as the negative ions move further away, several consecutive pulses are presented in the gap. The results of simulation show that when the CF4 content increased to 80%, the discharge is more intensive and the pulse frequency also increases.
This work was supported by Natural Science Foundation of Shaanxi Provincial Department of Education (No. 21JK0792), National Natural Science Foundation of China (No. 51521065), National Key Basic Research Program of China (973 Program) (No. 2015CB251001). This work was also partially supported by the Natural Sciences and Engineering Research Council of Canada (NSERC).
| [1] |
Middleton R L and Eng P 2000 Cold-weather Application of Gas Mixture (SF6/N2, SF6/CF4) Circuit Breakers: a Utility user's Perspective Winnipeg (Canada: Manitoba Hydro)
|
| [2] |
Gao Q Q et al 2018 J. Phys. D: Appl. Phys.
51 295202 doi: 10.1088/1361-6463/aacccd
|
| [3] |
Dordizadeh P, Adamiak K and Castle G S P 2015 J. Phys. D: Appl. Phys.
48 415203 doi: 10.1088/0022-3727/48/41/415203
|
| [4] |
Morrow R 1985 Phys. Rev. A
32 1799 doi: 10.1103/PhysRevA.32.1799
|
| [5] |
Morrow R 1991 IEEE Trans. Electr. Insul.
26 398 doi: 10.1109/14.85110
|
| [6] |
Espel P et al 2002 J. Phys. D: Appl. Phys.
35 318 doi: 10.1088/0022-3727/35/4/307
|
| [7] |
Dhali S K and Pal A K 1988 J. Appl. Phys.
63 1355 doi: 10.1063/1.339963
|
| [8] |
Wang F et al 2013 Trans. China Electrotech. Soc.
28 261(in Chinese)
|
| [9] |
Saleh D N, Algwari Q T and Amoori F K 2020 Phys. Plasmas
27 073501 doi: 10.1063/5.0008411
|
| [10] |
Gao Q Q et al 2018 Plasma Sources Sci. Technol.
27 115001 doi: 10.1088/1361-6595/aae706
|
| [11] |
Zeng F et al 2019 Plasma Chem. Plasma Process.
39 205 doi: 10.1007/s11090-018-9941-z
|
| [12] |
Černák M, Hoder T and Bonaventura Z 2020 Plasma Sources Sci. Technol.
29 013001 doi: 10.1088/1361-6595/ab5051
|
| [13] |
Zhong L L et al 2014 Phys. Plasmas
21 053506 doi: 10.1063/1.4876744
|
| [14] |
Morgan database https://us.lxcat.net/cache/62bd6e937370f/
|
| [15] |
Bordage database https://us.lxcat.net/cache/62bd6e57148fe/
|
| [16] |
Morrow R 1986 IEEE Trans. Plasma Sci.
14 234 doi: 10.1109/TPS.1986.4316534
|
| [17] |
Sato N 1980 J. Phys. D: Appl. Phys.
13 L3 doi: 10.1088/0022-3727/13/1/002
|
| [18] |
Yu X J, Hou H and Wang B S 2017 J. Comput. Chem.
38 721 doi: 10.1002/jcc.24741
|
| [1] | Hongyue LI (李红月), Xingwei WU (吴兴伟), Cong LI (李聪), Yong WANG (王勇), Ding WU (吴鼎), Jiamin LIU (刘佳敏), Chunlei FENG (冯春雷), Hongbin DING (丁洪斌). Study of spatial and temporal evolution of Ar and F atoms in SF6/Ar microsecond pulsed discharge by optical emission spectroscopy[J]. Plasma Science and Technology, 2019, 21(7): 74008-074008. DOI: 10.1088/2058-6272/ab0c46 |
| [2] | Chuang WANG (王闯), Xi CHEN (陈曦), Kai TANG (唐凯), Pengfei LI (李鹏斐). Study on the discharge mechanism and EM radiation characteristics of Trichel pulse discharge in air[J]. Plasma Science and Technology, 2019, 21(5): 55402-055402. DOI: 10.1088/2058-6272/ab03ab |
| [3] | Xuebao LI (李学宝), Dayong LI (李大勇), Qian ZHANG (张迁), Yinfei LI (李隐飞), Xiang CUI (崔翔), Tiebing LU (卢铁兵). The detailed characteristics of positive corona current pulses in the line-to-plane electrodes[J]. Plasma Science and Technology, 2018, 20(5): 54014-054014. DOI: 10.1088/2058-6272/aaa66b |
| [4] | Ming SUN (孙明), Zhan TAO (陶瞻), Zhipeng ZHU (朱志鹏), Dong WANG (王东), Wenjun PAN (潘文军). Spectroscopic diagnosis of plasma in atmospheric pressure negative pulsed gas-liquid discharge with nozzle-cylinder electrode[J]. Plasma Science and Technology, 2018, 20(5): 54005-054005. DOI: 10.1088/2058-6272/aab601 |
| [5] | ZHANG Renxi (张仁熙), WANG Jingting (王婧婷), CAO Xu (曹栩), HOU Huiqi (侯惠奇). Decomposition of Potent Greenhouse Gases SF6, CF4 and SF5CF3 by Dielectric Barrier Discharge[J]. Plasma Science and Technology, 2016, 18(4): 388-393. DOI: 10.1088/1009-0630/18/4/10 |
| [6] | A. K. FEROUANI, M. LEMERINI, L. MERAD, M. HOUALEF. Numerical Modelling Point-to-Plane of Negative Corona Discharge in N2 Under Non-Uniform Electric Field[J]. Plasma Science and Technology, 2015, 17(6): 469-474. DOI: 10.1088/1009-0630/17/6/06 |
| [7] | RAN Huijuan(冉慧娟), WANG Lei(王磊), WANG Jue(王珏), WANG Tao(王涛), YAN Ping(严萍). Discharge Characteristics of SF6 in a Non-Uniform Electric Field Under Repetitive Nanosecond Pulses[J]. Plasma Science and Technology, 2014, 16(5): 465-470. DOI: 10.1088/1009-0630/16/5/05 |
| [8] | LU Na(鲁娜), FENG Yingchun(冯迎春), LI Jie(李杰), SU Yan(宿艳), SHANG Kefeng(商克峰), WU Yan(吴彦). Electrical Characteristics of Pulsed Corona Discharge Plasmas in Chitosan Solution[J]. Plasma Science and Technology, 2014, 16(2): 128-133. DOI: 10.1088/1009-0630/16/2/08 |
| [9] | LIU Xin (刘欣), LI Shengli (李胜利), LI Mingshu (李铭书). Factors Influencing the Electron Yield of Needle-Ring Pulsed Corona Discharge Electron Source for Negative Ion Mobility Spectrometer[J]. Plasma Science and Technology, 2013, 15(12): 1215-1220. DOI: 10.1088/1009-0630/15/12/10 |
| [10] | CHANG Jiasen, WANG Hu, ZHANG Qiaogen, QIU Aici. Multichannel Discharge Characteristics of Gas Switch Gap in SF6-N2 or SF6-Ar Gas Mixtures under Nanosecond Triggering Pulses[J]. Plasma Science and Technology, 2011, 13(6): 719-723. |
Supported by: Beijing Renhe Information Technology Co., Ltd. 
| Number | Reaction | Symbol | Energy (eV) |
| 1 | e+SF6 = > F+SF5- | Qat1 | 0 |
| 2 | e+SF6 = > SF6- | Qat2 | 0 |
| 3 | e+SF6 = > SF6- | Qat3 | 1.3 |
| 4 | e+SF6 = > e+SF6 | Qm | / |
| 5 | e+SF6 = > e+SF6(V1) | Qev | 0.095 |
| 6 | e+SF6 = > e+SF6* | Qex1 | 10 |
| 7 | e+SF6 = > e+SF6* | Qex2 | 11.7 |
| 8 | e+SF6 = > e+SF6* | Qex3 | 15 |
| 9 | e+SF6 = > 2e+SF6+ | Qion | 15.7 |
| 10 | e+CF4 = > CF2-+F2 | Qat | 0 |
| 11 | e+CF4 = > e+CF4 | Qm | / |
| 12 | e+CF4 = > e+CF4(V1) | Qev1 | 0.078 |
| 13 | e+CF4 = > e+CF4(V2) | Qev2 | 0.159 |
| 14 | e+CF4 = > e+CF4(V2) | Qev3 | 0.4 |
| 15 | e+CF4 = > e+CF* 4 | Qde | 10 |
| 16 | e+CF4 = > 2e+CF4+ | Qion | 15.9 |
DownLoad:
CSV