Shuhan GAO, Xucheng WANG, Yuantao ZHANG. Modeling study on different discharge characteristics in pulsed discharges with and without barriers on electrodes[J]. Plasma Science and Technology, 2023, 25(5): 055401. DOI: 10.1088/2058-6272/aca86d
Citation:
Shuhan GAO, Xucheng WANG, Yuantao ZHANG. Modeling study on different discharge characteristics in pulsed discharges with and without barriers on electrodes[J]. Plasma Science and Technology, 2023, 25(5): 055401. DOI: 10.1088/2058-6272/aca86d
Shuhan GAO, Xucheng WANG, Yuantao ZHANG. Modeling study on different discharge characteristics in pulsed discharges with and without barriers on electrodes[J]. Plasma Science and Technology, 2023, 25(5): 055401. DOI: 10.1088/2058-6272/aca86d
Citation:
Shuhan GAO, Xucheng WANG, Yuantao ZHANG. Modeling study on different discharge characteristics in pulsed discharges with and without barriers on electrodes[J]. Plasma Science and Technology, 2023, 25(5): 055401. DOI: 10.1088/2058-6272/aca86d
High-pressure nanosecond pulsed discharges (NPDs) have attracted increasing attention in recent years due to their wide potential applications. In this study, a barrier-free NPD in pure helium plasma at 120 Torr was numerically investigated by a one-dimensional self-consistent fluid model, and its current–voltage characteristics show very different behaviors from those in pulsed dielectric barrier discharges (DBDs), indicating an entirely distinctive discharge evolution in pulsed discharges with or without barriers on electrodes. Without the control of barriers, the computational data suggest that the discharge current increases very sharply during the plateau phase of the pulsed voltage and reaches its peak value at approximately the instant when the pulsed voltage starts to drop, together with a gradual reduction in the sheath thickness and an increase in electric field in the sheath region, which is in good agreement with experimental observations. By increasing the voltage plateau width and repetition frequency, the discharge current density from the simulation can be substantially enhanced, which cannot be observed in conventional pulsed DBDs, and the spatial distributions of the electric field and charged particles are given to unravel the underlying physics. From the computational data, the distinctive discharge characteristics in barrier-free NPDs are deeply understood, and could be further optimized by tailoring the waveform of the pulsed voltage to obtain desirable plasmas for applications.
In recent years, low-temperature high-pressure glow discharges have attracted ever-growing attention for their broad application prospects [1–6]. Due to the abundant reactive species produced in high-pressure plasmas, they have been widely employed in many applications without the need for vacuum facilities, such as in surface modification, deposition of functional films, environmental sensing, etc [7–12], and especially in the novel application of biomedical plasmas [5, 13–15]. However, as the discharge current is further enhanced, low-temperature plasma discharges are prone to suffer from α–γ mode transition at high gas temperature [16–20]. In practical applications, two methods are commonly applied to generate large-volume diffused plasmas in the α mode. Firstly, by reducing the dimensions of the radio-frequency discharge to sub-millimeter size the micro-discharges can obtain a large surface-to-volume ratio to retain the non-equilibrium character of the discharge with high electron density and low gas temperature [4, 5, 21–24]. Secondly, short-pulsed discharges, especially nanosecond pulsed discharges (NPDs), keep the power-on duration shorter than the time needed for the development of instability [25–28].
In this study, we are mainly concerned with the latter. NPDs could provide an intensified electric field and much higher breakdown voltage in electrode space due to the ultrahigh rate of increase in the pulsed voltage; thus, abundant energetic electrons can be produced in an extremely energy-efficient way instead of by heating the ambient gas [25, 27, 29, 30]. The energetic electrons and frequent collisions at high pressures will improve the electron density and generate a large number of reactive oxygen species and reactive nitrogen species with the appropriate mixture of gases rich in chemicals, which are supposed to be very important in biomedical applications of plasmas [13, 15, 31]. Furthermore, it has been proved that modulation of the pulsed voltage waveform, such as pulse rise rate and plateau voltage, could effectively optimize the corresponding discharge characteristics of NPDs for practical applications [25, 26, 32–36]. Generally speaking, high-pressure NPDs are commonly achieved by means of a dielectric barrier covering the electrodes in the experiments [37–41]; however, considering that the dielectric layers may be contaminated after persistent usage, which would cause them to lose their ability to stabilize NPDs, it is desirable to dispense with the use of a dielectric barrier in the various applications [34, 42, 43]. Walsh's group reported that a barrier-free sub-microsecond pulsed discharge was achieved within the kilohertz range in experiments [44], and Iza et al introduced a hybrid computational model to explore the electrical properties of the barrier-free multi-pulse discharge at atmospheric pressure [25]. In addition, Simeni et al investigated the Townsend to glow transition for high-pressure NPDs without dielectric barriers by Stark polarization spectroscopy complemented with a one-dimensional fluid model [45]. However, due to its extreme transient nature and the limited applicability of conventional experimental diagnosis and simulation techniques, the essential evolution processes and ways to optimize high-pressure barrier-free NPDs are still far from being understood [46, 47].
In this paper, a numerical study on the discharge characteristics in barrier-free NPDs in 120 Torr pure helium is systematically carried out with a one-dimensional fluid model, showing very different evolution behavior from the discharge events in pulsed dielectric barrier discharges (DBDs). In the second section, a brief description of the fluid model and discharge conditions is given. Based on the numerical results, the third section illustrates the discharge current–voltage characteristics (CVCs), maximum temperature and density of the electrons, along with the spatial distributions of electric field, electron density and ion density, to further investigate the underpinning physics in barrier-free NPDs. Moreover, the dependences of discharge evolution on the voltage plateau width, voltage amplitude, pulse rise rate and repetition frequency are also investigated in the fourth section to explore the ways to optimize barrier-free NPDs. In the fifth section, our conclusions are summarized.
2.
Computational model
In this paper, a one-dimensional self-consistent fluid computational model is introduced to investigate the discharge dynamics and mechanism of barrier-free NPDs. Since the characteristics of barrier-free NPDs shown in several intensified charge-coupled device (iCCD) images are homogeneous and uniform [25, 44, 45], the one-dimensional assumption is considered appropriate under the given discharge conditions. Furthermore, rather than make a quantitative comparison with specific experimental measurements, this computational code pays more attention to unraveling the characteristic quantities that govern barrier-free NPDs; thus, only six pivotal plasma particles are included in the simulation model, namely electrons (e), helium atoms (He), atomic helium ions (He+), molecular helium ions (He+2), metastable helium atoms [He*, including He(21S) and He(23S)] and metastable helium molecules (He*2). The chemical reactions as well as the corresponding reaction rate coefficients considered for these particles are listed in table 1. This simplified reaction set is compiled from several literature sources [43, 48–50] and was able to capture the main dynamics of high-pressure helium discharges while also achieving a high computational efficiency.
Table
1.
The chemical reaction processes considered in the model of helium discharge.
The equations governing the mathematical model mainly contain the one-dimensional continuity equation, current conservation equation and electron energy equation. The production and destruction of plasma species are described by the continuity equation, and the Poisson equation is also coupled to calculate the electric field
∂Ne,i,n∂t+∂Γe,i,n∂x=Se,i,n,
(1)
ε0∂E∂x=e(Ni−Ne),
(2)
where N and S signify the density and source term of plasma species, respectively, and the subscripts e, i and n denote electrons, positive ions and neutral particles produced in electrode spacing, respectively; E refers to the electric field, ε0 and e are the vacuum permittivity and elementary charge, respectively. With the diffusion–drift approximation, the flux Γ can be expressed as
Γe,i,n=sgn(qe,i,n)Ne,iμe,iE−De,i,n∂Ne,i,n∂x,
(3)
where μ and D are the coefficients of species drift and diffusion, respectively. sgn(qe,i,n) is negative (-) for electrons, positive (+) for ions and nil for neutral particles. Thus, for the neutral species only the diffusion movements are taken into consideration in present model.
The current conservation equation can be analytically obtained from equation (2) [51]
ε0∂E∂t=I0−Ig,
(4)
where I0 is the total current density and Ig is the conduction current density, which is given by
Ig=e(Γi−Γe).
(5)
By integrating equation (4) over the whole electrode spacing, the total current density I0 is presented as [52]
I0=ε0ddV(t)dt+1d∫dg0Igdx,
(6)
where d = dg + 2ds/εr stands for the equivalent thickness of the electrode spacing, which takes the form of d = dg in the simulation of barrier-free NPDs. This model can also be used for simulating pulsed DBDs, in which ds and εr represent the thickness and relative permittivity, respectively, of the dielectric plate.
In the present code, the pulsed voltage waveform is depicted by a piecewise function with the smooth approximation
V(t)={V0t/T1(1+(t/T1)16)116,0⩽
(7)
where V0 denotes the amplitude of applied voltage and T1, T2 and T3 refer to the rise, plateau and fall time of the pulsed voltage, respectively. The smooth approximation is used here mainly to numerically meet requirements of the continuity of equations [53, 54], and the effects of this approximation on the discharge characteristics are considered negligible.
The electron temperature Te is calculated through the equation of electron energy [55], which takes the form of
where ε is the mean electron energy, Kj is the corresponding rate coefficient of the jth reaction, ∆Ej is the electron energy loss during inelastic collision caused by the jth reaction, KB is the Boltzmann constant, me and mHe represent the masses of electron and gas species, respectively, and is the electron–neutral transfer frequency. In this simulation, the gas temperature of the barrier-free NPDs does not change very significantly, which is an advantage of nanosecond pulsed voltage excitation, and the power is used to accelerate electrons not to heat gas, so the gas temperature Tg is assumed to be a constant 300 K in present study. In addition, the energy conservation equation for heavy species is not included in this model since that their temperature shows only a slight variation in the low-temperature plasma and is assumed to be equal to the gas temperature Tg at 300 K.
The above equations are numerically discretized and solved with the improved Scharfetter–Gummel scheme [51, 56, 57]. This study uses a parallel-plate structure, the distance of gas gap is fixed at 3.5 mm and the working gas is pure helium under a pressure of 120 Torr. The cathode is assumed to be the grounding electrode, and a pulsed voltage is applied to the anode. The coefficients for electron drift and diffusion are derived from [55], and the diffusion coefficients of positive ions and neutrals come from [55]; moreover, the Einstein relation is used to compute the drift coefficients of ions based on their diffusion coefficients [58]. The boundary condition of electrons is determined by , where the ∓ sign corresponds to the surface normal direction, and the emission of secondary electrons is also taken into consideration with a simplified coefficient value of γ = 0.03, Γk is the flux density of the kth ion bumping into the cathode [5]; the boundary condition for ions is set to Γi = -NiμiE, and for metastable species the thermally limited boundary flux condition is used in the model [55]. The initial density of all plasma particles is set to 1.0 × 108 cm-3 because within a reasonable range it has very little influence on the numerical results after discharge stabilization. In addition, the steep rate of increase in pulsed voltage and large discharge current density in NPDs bring huge challenges to the fluid code, thus an adaptive time step procedure is taken into account to alleviate the computing time in the present simulation. Based on the Courant–Friedrichs–Lewy condition, the minimum time step is set to be 1.0 × 10⁻¹² s during the power-on phase and the following 200 ns, and it is fixed at 1.0 × 10⁻⁸ s during the rest of the power-off phase. The spatial step is fixed from experience as 1 μm for the sake of both accuracy and simplicity. Due to the high computational efficiency of the present fluid model in investigations of high-pressure discharges, the dynamic steady state of NPDs can be obtained after several pulse repetition periods in time scales of milliseconds, which is computationally prohibitive for the more accurate particle-in-cell/Monte Carlo collision (PIC/MCC) simulation. Although limitations of the fluid model without consideration of kinetic effects ought to be handled with caution in numerical simulations of short-pulsed discharges [25], under the given discharge conditions this model could provide the main dynamics of high-pressure NPDs and has shown a good agreement with experimental observations in [45].
3.
Discharge characteristics of barrier-free NPDs
In this section, the evolution behavior of a barrier-free NPD is discussed in detail and compared with a conventional pulsed DBD. The pulse rise time, plateau time and the fall time are set to 25 ns, 50 ns and 25 ns, respectively, with a pulse repetition frequency of 4 kHz; thus, the corresponding duty cycle is very small at approximately 0.04%. The amplitude of the pulsed voltage applied to the bare electrode is fixed at 1300 V, which suggests that the corresponding rise rate is 52 V ns–1. To ensure that pulsed discharges have achieved a stable state, the presented calculation results are obtained after operating for 10 pulse repetition cycles.
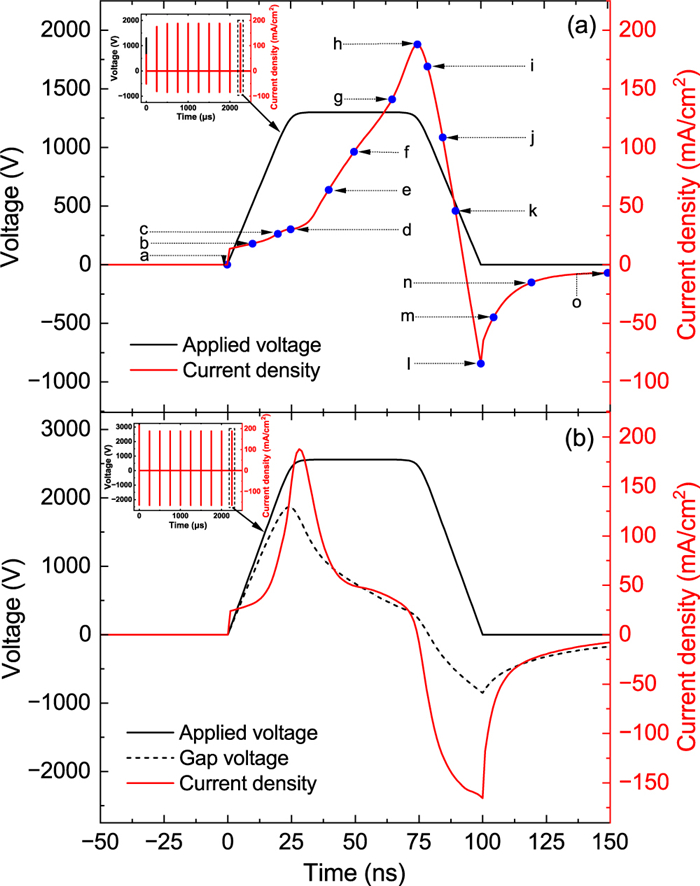
Figure 1(a) gives the CVCs driven by the barrier-free NPD and, for comparison, the CVCs of the corresponding pulsed DBD are also shown in figure 1(b). The inset figures show the whole discharge process of 10 repetition cycles, in which the 10th cycle is taken for detailed analysis. In figure 1(b), the duration of the voltage rise phase, plateau phase and falling phase are the same as in figure 1(a), but the voltage amplitude is increased to 2560 V due to the voltage drop across the dielectric plates [34], and the thickness of the dielectric plates is set to 1.5 mm with a relative permittivity of 7.5. It is obvious from figure 1(b) that there are double peak currents with amplitudes of 187.8 and 165.4 mA cm-2 at the rising and falling phases of applied pulsed voltage, respectively, which is consistent with the findings in [34, 43, 54, 59]. However, in the barrier-free NPD, only a single current pulse appears at the end of the plateau phase of the applied voltage in figure 1(a), as also reported in the experimental observations in [25, 34, 42, 44, 45], which indicates that the new physical mechanism occurs as the dielectric is removed and the underlying physics should be further clarified by the computational data. It is shown in figures 1(a) and (b) that the current density rises rapidly with the application of a pulsed voltage at 0 ns, and it decreases sharply at the end of the pulsed voltage at 100 ns, both mainly due to the displacement current, and for the remainder of the total discharge current the displacement current is negligible. The current density in figure 1(a) increases almost linearly from 13.6 to 30.2 mA cm-2 with increasing applied voltage during the voltage rising phase, and approximately at the beginning of the plateau phase the current starts to sharply rise and reaches an amplitude of 187.8 mA cm-2 at the end of the plateau, which is the same as in figure 1(b); afterwards it drops quickly and a negative current caused by the space charges appears during the falling phase with an amplitude of 84.3 mA cm-2. Finally, in the afterglow phase of the barrier-free NPD, the discharge current density gradually reduces.
Figure
1.
Temporal evolution of applied voltage, gap voltage and discharge current density in a barrier-free NPD (a) and a pulsed DBD (b). The inset figures to show the whole discharge process of 10 repetition cycles.
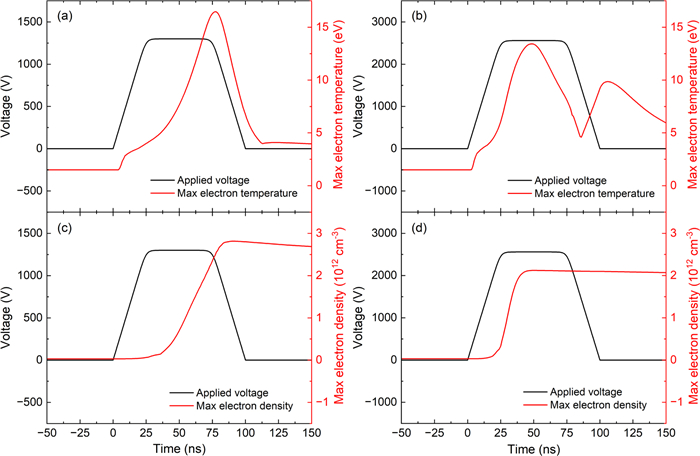
The temporal evolution of maximum electron temperature and maximum electron density with applied voltage in the barrier-free NPD and the pulsed DBD are shown in figure 2 in order to help better understand the evolution of the CVCs in figures 1(a) and (b). In the barrier-free NPD, at the beginning of the pulse, the electrons are accelerated by an external electric field away from the cathode, which causes a rapid increase in the electron temperature (seen in figure 2(a)), and as the maximum electron temperature reaches 5 eV at 36 ns, because the number of electrons with energies beyond the ionization threshold becomes considerable, intense ionization occurs and the electron density experiences explosive growth, as shown in figure 2(c). The maximum electron temperature reaches a peak of 16.47 eV at 77 ns, approximately corresponding to the instant when the discharge current reaches its peak in figure 1(a), and it is 23% higher than the peak of 13.43 eV in a pulsed DBD shown in figure 2(b). After that, under the effects of intense avalanche ionization, the energy loss due to the high collisionality in the plasma bulk is greater than the energy injection by the applied voltage during the voltage falling phase. Thus, the maximum electron temperature decreases rapidly in figure 2(a) while the maximum electron density reaches its peak of 2.8 × 1012 cm-3 at 91 ns in figure 2(c), which is substantially larger than that generated by the high-pressure pulsed DBD with a peak value of 2.1 × 1012 cm-3 in figure 2(d). As illustrated in [7, 8, 13, 14, 60], the high electron temperature and electron density are of great importance for practical applications in a wide range of disciplines. Then, the electron density gradually decreases in the afterglow phase of the barrier-free NPD, mainly due to the absorption of electrodes and recombination of electrons and ions in the gap. Generally speaking, a sufficiently high electron temperature and electron density are required for the occurrence of an obvious current pulse, and due to the absence of the dielectric, both the electron temperature and electron density in the barrier-free NPDs always increase until the voltage falling phase; thus, only one current pulse will be observed at the end of the plateau phase.
Figure
2.
Temporal evolution of maximum electron temperature (a) and (b) and maximum electron density (c) and (d) with applied voltage in a barrier-free NPD and a pulsed DBD.
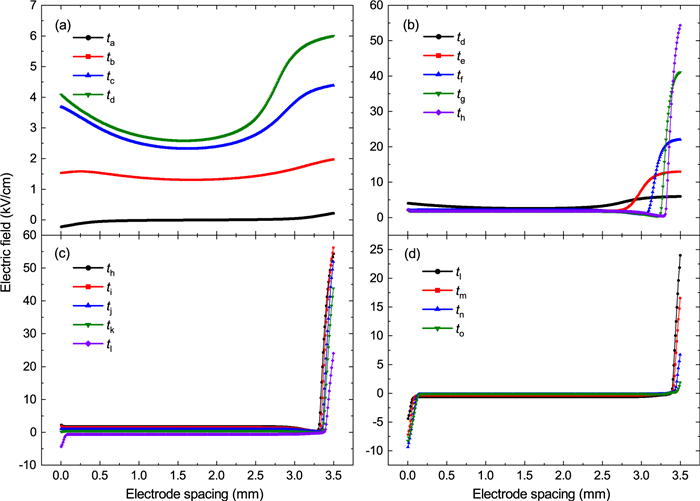
In order to perform more detailed investigations to unveil the intrinsic mechanism of the barrier-free NPD, the spatial distributions of electric field and charged particle density in the electrode spacing at different moments from ta to to marked in figure 1(a) are given in figures 3 and 4, respectively. It is shown in figure 3(a) that, as a pulsed voltage is applied, the profile of the electric field is nearly uniform at both ta and tb but its value increases to about 1.6 kV cm-1 at tb. At ta and tb, as shown in figures 4(a) and (b), the distributions of electron density are obviously different but the ion densities are almost the same, the reason is that with the rapid increase in the electric field, the electrons can be accelerated and drift toward the anode (left-hand side of figure 4), so a new electron density profile is formed at tb; however, the heavy ions find it difficult to respond to the fast-changing electric field and thus are almost unchanged compared with the time point ta. After the initial acceleration, the electrons lead to more ionization, thus the electron and ion densities rise sharply and develop into spatially nonuniform distributions at tc and td, as seen in figures 4(a) and (b). Meanwhile these space charges start to perturb the external electric field with enhanced ionization at the sheath boundary. It is clearly seen in figure 3(a) that the electric field in the sheath becomes stronger from tc to td.
Figure
3.
Spatial distribution of electric field at various times during the pulse rising phase (a), plateau phase (b), falling phase (c) and afterglow phase (d) in a barrier-free NPD.
Figure
4.
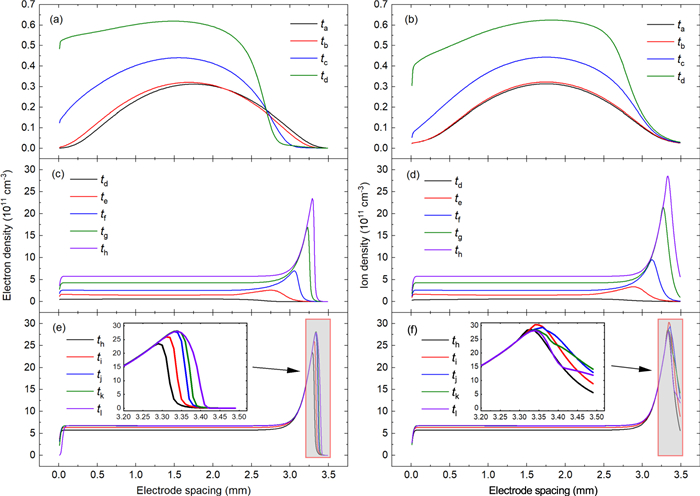
Spatial distributions of electron and ion density at various times during the pulse rising phase (a) and (b), plateau phase (c) and (d) and falling phase (e) and (f) in a barrier-free NPD (the inset figures show details).
As the applied pulsed voltage transforms to the plateau phase, the difference between the electric fields in the plasma bulk and cathode sheath becomes more remarkable in figure 3(b), then a large quasi-neutral plasma bulk and the prominent cathode sheath region take form. At te, it can be seen that the field near the cathode is enhanced significantly, and its peak value reaches 13 kV cm-1; at the same time, the field in the plasma bulk reduces rapidly to 2.2 kV cm-1. This is the result of the combined action of fast electrons moving towards the anode driven by the plateau voltage and heavy ions with substantially lower mobility. Moreover, from te to th in figure 3(b), the peak electric field at the cathode increases from 13 to 54.3 kV cm-1 whereas the thickness of the cathode sheath region with high electric field decreases from 785 to 205 μm. The simulation results have the same evolution trend and amplitudes for sheath thickness and electric field as the experimental measurements from Stark polarization spectroscopy in [45], which partly validates the present computational model. Another noteworthy feature of the simulated electric fields in figure 3(b) is the field reduction near the boundary of the cathode sheath; for example, in the positive column space the field is 1.8 kV cm-1 at th but at the sheath boundary its value reduces to 0.4 kV cm-1, which agrees well with the dark zone as observed by the iCCD camera in [25, 45]. The reduction of electric field and even the field reversal near the cathode sheath boundary have been investigated extensively under diverse discharge conditions [22, 61–64], and is believed to be very important in discharges with high current density for the capacity to maintain current continuity in the sheath region, such as the barrier-free NPD in this study. The rapid increase in sheath electric field from te to th in figure 3(b) is mainly caused by the sharp increase in charged particle density near the sheath boundary, shown in figures 4(c) and (d). The electrons generated by ion-induced secondary electron emission on the cathode could be effectively accelerated by the enhanced electric field in the cathode sheath, and these energetic electrons contribute to the intense avalanche ionization and accumulation of electrons and ions at the cathode sheath boundary. Moreover, the electrons produced by avalanches will be pushed to the plasma bulk promptly while the ions remain static on the time scale of nanoseconds, thus the density of ions is obviously higher than that of electrons in the cathode sheath, as seen at tf, tg and th in figures 4(c) and (d). Finally a space charge region will be formed, which could further enhance the sheath electric field near the cathode. It is also worth noting that the rapid increase in electric field at the cathode and the reduction in cathode sheath size from te to th in figure 3(b) coincide with the steep increase in electron temperature and electron density in figures 2(a) and (c), indicating a transition from Townsend to glow discharge and a significant increase in discharge current density in figure 1(a). If the applied voltage were not reduced at th, the electric field in the cathode sheath would be further enhanced by the increasing electron density and reducing sheath thickness, so electron runaway in NPDs will ultimately occur [65]. Moreover, when inhomogeneous cathode emission is considered, the plasma boundary may become unstable, accompanied by a cathode-directed wave of ionization that develops within the cathode sheath and further transition of the discharge from glow to arc [66], which are both outside the applicability of the fluid model used in this study and will be detailed elsewhere using the more accurate PIC/MCC model or the two-dimensional fluid model.
The electric field distributions in the falling phase of the pulsed voltage are displayed in figure 3(c), and the corresponding distributions of electron and ion density at the time points from th to tl are given in figures 4(e) and (f), respectively, with the insets showing more details. As the applied voltage reduces rapidly the discharge also diminishes. Owing to the decrease in space charge density, the electric field in the cathode sheath gradually reduces from 56.2 to 24 kV cm-1, as shown in figure 3(c), but it is worth noting that the cathode sheath still becomes thinner in the falling phase, mainly as a result of the increase in electron density near the cathode in figure 4(e). Generally speaking, the acceleration of electrons in the sheath will be reduced as the field decreases, thus the number of energetic electrons should also decrease gradually; however, the avalanche ionization induced by the fast electrons could still elevate the electron density substantially during the voltage falling phase. Figure 4(e) shows that the electron density near the sheath boundary has a maximum value of 2.8 × 1012 cm-3 at tl, 21.7% larger than that (2.3 × 1012 cm-3) at th. So, in conclusion, the increase in electron density in figure 4(e) combined with the almost constant ion density in figure 4(f) at the sheath boundary results in reduction of the space charge density in the electrode gap coinciding with a significant decrease in the electric field (figure 3(c)). This ultimately contributes to the decrease in electron temperature in figure 2(a), indicating the rapid decrease of discharge current density during the voltage falling phase in figure 1(a). Interestingly, a negative electric field develops near the anode at the end of the power-on phase, and its value keeps going up to –9.4 kV cm-1 until the time point tn in figure 3(d). Due to the absence of an external electric field, this built-in field triggered by the space charges could pull the electrons from the anode side and re-heat them, which exactly correlates with the negative discharge current in figure 1(a) and the slight increase in electron temperature in figure 2(a) during the afterglow phase. Finally, it is worth pointing out that the high plasma species density in the discharge gap could last for many hundreds of nanoseconds after the current pulse (partly shown in figure 2(c)), which is thought to have a wide range of potential applications.
4.
Effects of discharge parameters on barrier-free NPDs
In this section, the discharge characteristics for various waveforms of the applied pulsed voltage, such as voltage plateau width, voltage amplitude, pulse rise rate and repetition frequency, are carefully investigated to further explore the ways to optimize barrier-free NPDs, helpful for achieving higher electron temperature and larger electron density in applications. The computational data on barrier-free NPDs are also discussed by comparison with the results for conventional pulsed DBDs.
4.1
Voltage plateau width
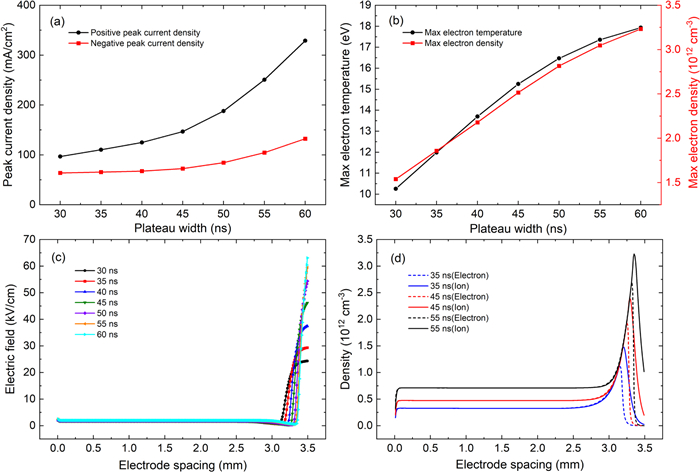
From the foregoing discussion in section 3, during the power-on phase of barrier-free NPDs the discharge current density always increases until the voltage starts to drop, which is completely different from the CVCs in pulsed DBDs [34, 59]. Thus, it is supposed that the voltage plateau width may have a great influence on the characteristic quantities of barrier-free NPDs. Here, the plateau width is varied from 30 to 60 ns with other parameters the same as the pulse waveform in figure 1(a). Figure 5(a) shows that both positive and negative peak current densities increase with plateau width in the range from 30 to 60 ns, but the rise rate of the positive peak is much larger than that of the negative peak. When the plateau width is 60 ns, the corresponding positive and negative peak current densities are 328.9 and 132.3 mA cm-2, respectively. In addition, according to the present simulations, it is found that the time points when the current density achieves positive and negative peaks are always exactly the end of the voltage plateau phase and the falling phase, respectively, consistent with the foregoing analysis in figures 3 and 4 as well as the experimental observations in [34]. As the voltage plateau width increases from 30 to 60 ns, the maximum electron temperature obtained in a whole pulse repetition period rises markedly from 10.3 to 17.9 eV in figure 5(b). Similarly, the maximum electron density also increases from 1.5 × 10¹² to 3.2 × 1012 cm-3 with the plateau width. The increase in maximum temperature and density of the electrons is mainly attributed to field reinforcement in the cathode sheath shown in figure 5(c) combined with the higher power density coupled into the discharge system at a wider plateau. To explore the physics underlying the effects of plateau width on the discharge characteristics, the spatial profile of electric fields calculated by use of various plateau widths at the time points when the discharge current reaches its positive peak is plotted in figure 5(c). As the voltage plateau width increases from 30 to 60 ns, the sheath electric field near the cathode is greatly strengthened, meanwhile the plasma bulk space becomes larger as sheath thickness reduces. At a fixed plateau width of 60 ns, the simulation data show that the peak value of the cathode sheath electric field reaches 63.1 kV cm-1, and the thickness of cathode sheath is 0.16 mm. These evolution profiles suggest that the increase in plateau width could efficiently enhance the sheath electric field near the cathode, and the strengthened field is conducive to enhancement in local ionization rates at the sheath boundary by accelerating the secondary electrons toward the anode. The higher electron and ion densities at a large plateau width can be observed in figure 5(d), and the distributions of charged particle density for different plateau widths of 35, 45 and 55 ns are given. At a plateau width of 55 ns, the peak densities of electrons and ions near cathode sheath boundary are approximately 2.7 × 10¹² and 3.2 × 1012 cm-3, respectively, thus the space charge density can be calculated as nearly 5 × 1011 cm-3. This large quantity of space charge could eventually strengthen the cathode sheath electric field in figure 5(c), and then the electron temperature and electron density in figure 5(b) will be simultaneously elevated, indicating a significant increase in peak current density in figure 5(a).
Figure
5.
Peak current density (a) and maximum electron temperature and electron density (b) as a function of plateau width, and the spatial distributions of electric field (c) and charged particle density (d) at the moment when the current density reaches the positive peak for various plateau widths.
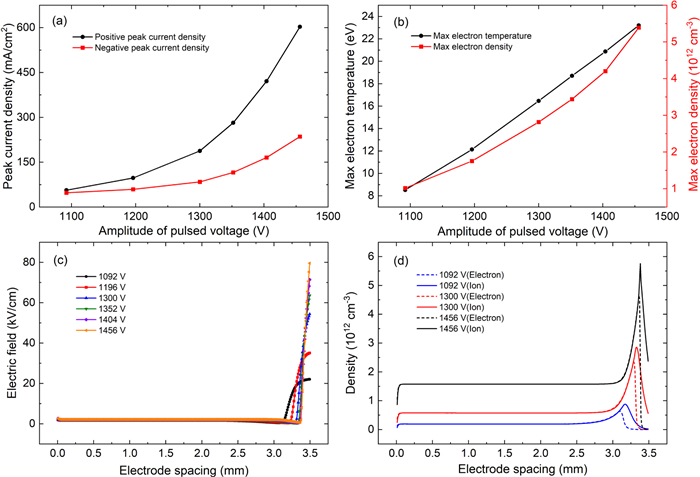
In this section, the effects of voltage amplitude are studied for the same rate of increase in voltage as that in figure 1(a). In our previous simulation work on short-pulsed DBDs [54], the peak discharge current stayed almost constant when the applied voltage amplitude increased at a fixed rate of increase in voltage. However, the evolution of discharge properties with pulsed voltage amplitude in barrier-free NPDs shows substantially different characteristics, as illustrated in figure 6. Figure 6(a) shows that, at a given pulse rise rate, the value of positive peak current density rises sharply from 56.5 to 603.1 mA cm-2 as the voltage amplitude is increased from 1092 to 1456 V, and the negative current peak also increases at a lower rate; namely, their difference is accentuated by the increasing voltage amplitude. The profile of maximum temperature and density of the electrons in figure 6(b) suggests that the maximum electron temperature retains a linear relation with the voltage amplitude; in the meantime, with the increase in applied voltage amplitude, the correlating maximum electron density in the whole repetition period is also increased from 1.0 × 10¹² to 5.4 × 1012 cm-3, which clearly suggests that a larger applied voltage amplitude indicates a higher temperature and density of electrons at a given rate of increase in voltage. For a better understanding of the variation of peak current density, electron temperature and electron density, the spatial distributions of electric fields and charged particle densities at the instant when the discharge current achieves its positive peak are plotted in figures 6(c) and (d), respectively, with the voltage amplitude varied from 1092 to 1456 V at a fixed pulse rise rate. Similar to the effects of voltage plateau width in figure 5, when the voltage amplitude increases, the sheath electric field is strongly strengthened together with the shrinkage of sheath thickness, seen in figure 6(c). At the largest amplitude of 1456 V, the peak electric field near the cathode reaches 79.5 kV cm-1, and the sheath thickness shrinks to 0.14 mm. Then, as shown in figure 6(d), the production of plasma species could be greatly strengthened by the intense electric field, resulting in a higher electron and ion density both in the sheath area and the plasma bulk, with the peak value located at the sheath boundary. On the other hand, the larger space charge density with high voltage amplitudes could further enhance the sheath electric field, suggesting an increase in peak current density, electron temperature and electron density.
Figure
6.
Peak current density (a) and maximum electron temperature and electron density (b) as a function of pulsed voltage amplitude, and the spatial distributions of electric field (c) and charged particle density (d) at the moment when the current density reaches the positive peak for various voltage amplitudes.
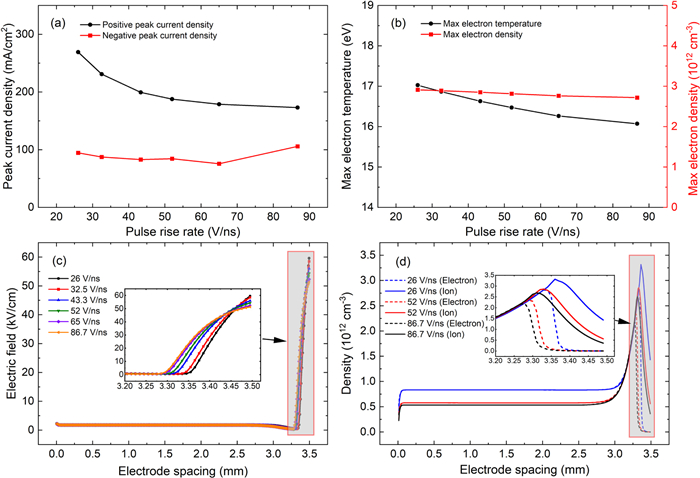
In pulsed DBDs, the peak current depends almost linearly on rate of increase in pulsed voltage. The calculation data further illustrate that the increase in voltage rise rate could effectively enhance the sheath electric field [54]. In this section the influence of the rate of increase in pulsed voltage on barrier-free NPDs is studied with a fixed voltage amplitude and plateau width and, for simplicity, the voltage fall rate is equal to the rise rate. As seen in figure 7(a), the simulation results indicate that the value of positive peak current density only changes slowly from 269.3 to 173.2 mA cm-2 with an increase in pulse rise rate from 26 to 86.7 V ns-1, while negative peak current density is almost unchanged at around 90 mA cm-2, completely contrary to the evolutionary trend in the situation with barriers in [54, 67]. The evolution of maximum electron temperature and electron density with different pulse rise rates is shown in figure 7(b). It is seen that the maximum electron temperature decreases from 17 to 16.1 eV when rise rate is increased, and the maximum electron density is almost invariant at 2.8 × 1012 cm-3. Although it is certified that a larger pulse rise rate could generate the high-energy electrons more efficiently to enhance the ionization rates [54], as the rise rate increases with fixed voltage amplitude as well as plateau width, the duration of the power-on phase is also decreased; namely, a lower power density can be coupled into the discharge systems. Consequently, the maximum value of electric field near the cathode is slightly reduced from 59.6 to 51.4 kV cm-1 as the pulse rise rate increases in figure 7(c); meanwhile, higher electron and ion densities in both the sheath area and the plasma bulk can be observed in figure 7(d) at a relatively small rise rate of 26 V ns–1. Furthermore, it is worth noting that as the voltage rise rate exceeds 52 V ns–1, the variations of electric field and charged particle density tend to be subtle, corresponding to the gradually stabilizing peak current densities in figure 7(a) and suggesting that the effects of applied voltage duration and pulse rise rate will be balanced at a relatively large pulse rise rate. However, it should be mentioned that the kinetic effects may become dominant in pulsed discharges if the voltage rise time is reduced to several nanoseconds, which ought to be treated carefully due to the limitations of the fluid model. Therefore, the minimum pulsed voltage rise time is limited to 15 ns in the model, and the simulation data obtained from the present model still achieve key features of NPDs. To sum up, from the foregoing discussion in figures 6 and 7, it is clear that the duration of the power-on phase is more important than the pulse rise rate for the characteristic quantities of barrier-free NPDs, especially when the pulse rise rate is not large enough. To further verify the above conclusion, the effects of pulse fall time are also investigated individually. As the pulse fall time increases at a fixed pulse rise time and plateau width, the duration of the power-on phase is extended; that is, a higher power density could be coupled into the plasmas, resulting in a slight increase in positive peak current and electron temperature in the computational data (not shown in the figure).
Figure
7.
Peak current density (a) and maximum electron temperature and electron density (b) as a function of pulse rise rate, and the spatial distributions of electric field (c) and charged particle density (d) at the moment when the current density reaches the positive peak for various pulse rise rates (insets show details).
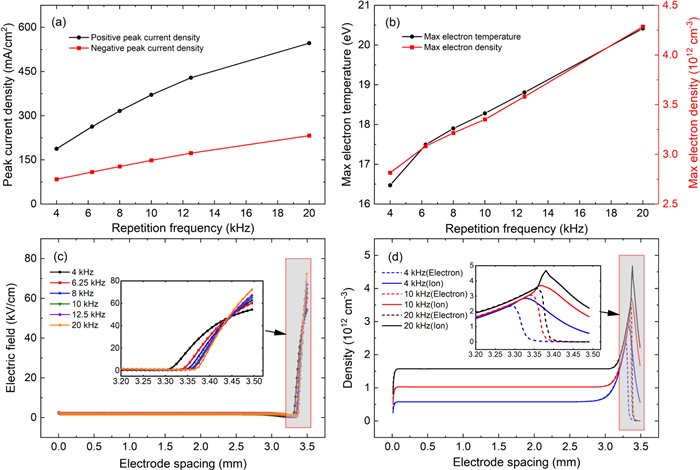
In pulsed discharges controlled by dielectric barriers, the pulse repetition frequency could strongly influence the discharge behavior, which has been experimentally and computationally observed and studied extensively [54, 67–71]. It has already been demonstrated in pulsed DBDs that at relatively low repetition frequencies (less than 50 kHz) the peak current declines very sharply with increase in the repetition frequency; this is known as the memory effect [54, 70]. However, as plotted in figure 8(a) from the present numerical data, two peak values of current density both increase significantly with the repetition frequency. When the repetition frequency is set to 4 kHz, the positive and negative peak current densities are 187.8 and 84.3 mA cm-2, respectively. Further, as the repetition frequency increases to 20 kHz, the value of the positive peak is 546.7 mA cm-2, growing nearly 200%, and the negative peak is 232.4 mA cm-2, increased by a factor of 175%. Figure 8(b) highlights that both the maximum electron temperature and electron density are almost proportional to the repetition frequency. In other words, as the repetition frequency increases from 4 to 20 kHz, a higher electron temperature in the whole pulse repetition period can be achieved, increasing from 16.5 to 20.4 eV. Meanwhile, the electron density also rises from 2.8 × 10¹² to 4.3 × 1012 cm-3 (a factor of 1.5). The evolutionary trends mentioned by the profiles in figures 8(a) and (b) are quantitatively consistent with the experimental observations [72]. Generally speaking, for a fixed pulsed voltage duration, the power-off duration is shortened with increase in the repetition frequency. Thus, intense bursts of charged particles will occur more frequently. Meanwhile, more plasma species could accumulate in the electrode spacing until the next pulse repetition period just because they have less time to completely recombine and quench at the electrodes by traveling across the gas gap. Many of these residual plasma species from the previous pulsed discharge burst are conducive to the initiation stage of pulsed discharge to achieve a stronger cathode sheath electric field and a higher charged particle density at the time points when the discharge current achieves its top value (shown in figures 8(c) and (d), respectively) and hence improve the discharge current density. In figure 8(c), it can be observed that with further increase in the repetition frequency, the thickness of the cathode sheath with high electric field shrinks from about 0.2 to 0.14 mm whereas the maximum value of the electric field increases from 54.3 to 72.3 kV cm-1. From figure 8(d), for a larger repetition frequency of 20 kHz, a higher ion density of 4.7 × 1012 cm-3 as well as an electron density of 3.5 × 1012 cm-3 can be achieved with a wider bulk plasma region, leading to a large space charge density which could substantially enhance the electric field in the sheath region.
Figure
8.
Peak current density (a) and maximum electron temperature and electron density (b) as a function of pulse repetition frequency, and the spatial distributions of electric field (c) and charged particle density (d) at the moment when the current density reaches the positive peak for various repetition frequencies (inset figures show details).
In this paper, a numerical study is performed to investigate the discharge characteristics and underpinning physics in barrier-free NPDs using a one-dimensional fluid model, and the ways to optimize barrier-free NPDs are also discussed by tailoring the waveforms of the pulsed voltage based on the computational data. The simulation shows that a very large discharge current increases initially during the plateau phase, not during the voltage rising phase, and achieves the peak value approximately at the start of the voltage falling phase in barrier-free NPDs, which agrees well with the experimental observations. The discharge evolution of the barrier-free NPDs differs significantly from that of pulsed DBDs. Compared with conventional pulsed DBDs, barrier-free NPDs show advantages in producing plasmas with a relatively higher electron temperature and larger electron density. The distributions of electric field and charged particle density suggest that a space charge region develops near the cathode during the breakdown process. The space charges are produced approximately on a time scale of 20 ns by the intense ionization collisions in cathode sheath, and could be self-enhanced by the increase in the local electric field, resulting in a larger peak in charged particle density near the sheath boundary. In particular, the data from the fluid model also suggest that the thickness of the cathode sheath is reduced with increasing discharge current density, which could further enhance the electric field at the cathode. Because of the accumulated space charge, an electric field with a maximum value of 56.2 kV cm-1 is observed at the end of the plateau phase. As the applied pulsed voltage is converted into the falling phase, or even the afterglow phase, it is found that a negative electric field appears near the anode. This could haul the electrons back to the plasma bulk and contribute to the occurrence of a negative current peak. Meanwhile, the cathode field declines and many of electrons can enter into the cathode region, accompanied by the continued contraction of the cathode sheath. Interestingly, while the pulsed voltage is turned off, the simulation shows that plasma species could still maintain high densities in the range of a few hundred nanoseconds. Further calculation shows that with the increase in plateau width and voltage amplitude, the cathode electric field and space charge density could be enhanced with shrinkage of the sheath. However, if the plateau width and voltage amplitude remain constant while the pulse rise rate is greatly increased, a reduction in discharge current density is observed, which is very different from the discharge behavior in pulsed DBDs. Based on the simulation, the duration of the pulsed voltage seems to be more important than the pulse rise rate for the pulsed discharge characteristics in barrier-free NPDs, and increasing the repetition frequency can obviously enhance the discharge intensity in barrier-free NPDs (but reduce the discharge current in pulsed DBDs). According to the discussion in this study, barrier-free NPDs can be further optimized by tailoring the pulse waveforms to produce desirable plasmas for applications.
Acknowledgments
This work was supported by National Natural Science Foundation of China (No. 11975142).
Data availability statement
The data that support the findings of this study are available from the corresponding author upon reasonable request.

 DownLoad: