Ion temperature gradient (ITG)-driven turbulence with embedded static magnetic islands is simulated by utilizing a gyrokinetic theory-based global turbulence transport code (GKNET) in this work. Different from the traditional equilibrium circular magnetic-surface average (EMSA) method, an advanced algorithm that calculates the perturbed magnetic-surface average (PMSA) of the electric potential has been developed to precisely deal with the zonal flow component in a non-circular magnetic surface perturbed by magnetic islands. Simulations show that the electric potential vortex structure inside islands induced by the magnetic islands is usually of odd parity when using the EMSA method. It is found that the odd symmetry vortex can transfer into an even one after a steep zonal flow gradient, i.e. the flow shear has been built in the vicinity of the magnetic islands by adopting the PMSA algorithm. The phase of the potential vortex in the poloidal cross section is coupled with the zonal flow shear. Such an electric potential vortex mode may be of essential importance in wide topics, such as the turbulence spreading across magnetic islands, neoclassical tearing mode physics, and also the interaction dynamics between the micro-turbulence and MHD activities.
Magnetized confinement fusion can only be achieved under certain conditions where the plasmas can be confined for a long enough time, which is determined by heat transport from the core plasma to the edge [1–3]. The heat transport is mainly classified as classical, neoclassical or anomalous transport, which are induced by collision mechanisms of passing particles, trapped particles and various instabilities, respectively. In general, anomalous transport can be much larger than the other two, and thus governs the plasma confinement. Among the varieties of anomalous transport, those caused by MHD activities, such as tearing instability, and micro-scale turbulence, such as ion temperature gradient (ITG) mode, are of critical importance. Although the scale of tearing instability differs from ITG turbulence both spatially and temporally, the combined influence on transport has attracted considerable interest in the past two decades with the fast development of computation ability. The tearing mode is an instability that is mainly excited on low-resonance surfaces. A fully grown tearing mode can generate large magnetic islands, which has been observed to have a great influence on turbulence in both experiments [4–7] and simulation works [8–11]. The charged particles move fast along the closed field lines so that the pressure gradient vanishes [8, 9] inside large magnetic islands. This gradient disappearance may remove the driving source for the ITG turbulence inside islands. However, the steeper density and temperature profile, as well as strong sheared flow, appear around the island separatrix. Here, the steeper profile can provide a stronger drive force for the ITG turbulence, while the flow shear may simultaneously weaken the turbulence [10]. It is also found that the turbulence can survive inside islands through turbulence spreading [11]. Although a large amount of work has focused on this important and complicated issue, there is still no clear conclusion on the combined influence of a tearing mode that includes magnetic islands and ITG modes on the plasma confinement. Moreover, some phenomena in related experiments are not well understood yet, such as the electric potential vortex, which is possibly caused by the combined influence. An in-phase electric potential vortex was observed in toroidal helical discharges [12]. It was suggested that such a resonant low-n mode may be excited due to different responses of ions and electrons [13, 14]. A similar phenomenon was also observed in GTC simulations using a drift kinetic electron model [15, 16]. However, the underlying physical mechanism of the formation of the potential vortex mode inside the magnetic islands is still an unsolved issue.
This work employs a gyrokinetic theory-based global turbulence transport code (GKNET) to investigate the interaction between magnetic islands and micro-turbulence. The focus is on the influence of static magnetic islands probably resulting from the tearing mode on ITG turbulence with an adiabatic electron response that considers the limitations of computation resources. Note that in previous simulations, the conventional algorithm for the magnetic surface average has necessarily been adopted to solve the zonal flow component, which determines the saturation level of ITG turbulence. Although the commonly used method of the equilibrium magnetic-surface-average (EMSA) is approximately correct for small magnetic perturbation, i.e. small magnetic islands, the result may be questionable in cases with large islands. Specifically, the accuracy when performing the magnetic surface average may obviously influence the simulation results. Therefore, a so-called perturbed magnetic-surface-average (PMSA) operator is developed here. Then, the magnetic-island-induced electric potential vortex mode inside the islands is simulated by employing the GKNET code.
The remainder of this paper is organized as follows. In section 2, the physical model for the GKNET code and numerical settings for simulations are described. The PMSA algorithm is presented and its numerical convergency is checked in section 3. In section 4, GKNET simulations on ITG turbulence with embedded static (2, 1) magnetic islands are carried out using the PMSA algorithm. The focus is on the dynamics of the magnetic-island-induced electric potential vortex mode. Finally, the main results are summarized in section 5.
2.
Physical model and numerical settings in GKNET simulation
GKNET is a five-dimensional (5D) code based on a gyrokinetic theory-based numerical experiment of a tokamak [17, 18]. In this code, coordinates (r,θ,φ,v∥,μ), which denote the radial coordinate, poloidal angle, toroidal angle, parallel and perpendicular velocities, respectively, have been adopted. The physical model consists of following the Vlasov equation ( 1) and Poisson equation ( 2). In the model, the approximation that ω≪ωc is assumed and high-frequency fluctuation is neglected. Therefore, an electron response can be treated as adiabatic.
Note that in our simulations, the collision effect is neglected. Here, f0 and δf above are the equilibrium and perturbed distribution functions; ⟨⟨⟩⟩c, ⟨⟩c and ⟨⟩ are the double gyro-phase, gyro-phase and flux surface average operators; ϕ is the perturbed electric potential; →er, →eθ and →eφ are the unit vectors in (r,θ,φ) directions. The magnetic field can be written as →B0=Bθ→eθ+Bφ→eφ+∇×δ→A∥, where Bθ, Bφ and δ→A∥ are the poloidal and toroidal components of the equilibrium field and the perturbed parallel magnetic vector potential, respectively. Here, δ→A∥ is defined as δ→A∥=α→b0=α0cos(mθ−nφ)→b0 to represent the static magnetic island structure in the code, with m and n indicating the poloidal and toroidal mode numbers, respectively. Here, α0 determines the size of the magnetic island. Accordingly, the perturbed field can be written as δ→B=(1r∂α∂θ−αRsinθ,−αRcosθ,0), where the large aspect ratio approximation and constant magnetic vector potential in the radial direction have been assumed. The constraint of ∇⋅δ→B=0 is satisfied. The normalization used is conventional, as described in related publications [17, 18]. In this work, static (2, 1) magnetic islands are adopted. Ba is the magnetic filed on magnetic axis and R is the major radius.
To stabilize the boundary, a numerical window function in the form of equation (3) is added to the magnetic island model, i.e., δ→A∥⋅Ax(r), where
Ax(r)=(1+A1(r))(1−A2(r))4,
(8)
and A1(r)=tanh(r−rs+ΔxΔ), A2(r)=tanh(r−rs−ΔxΔ), with rs denoting the rational surface, and Δx and Δ determine the shape of this window function together.
In simulations, all parameters and the corresponding profiles are set as follows, unless otherwise stated. The minor radius is taken as a0=120ρi, and the inverse aspect ratio a0R0=0.36, where ρi is the ion Larmor radius and R0 is the major radius on magnetic axis. The safety factor profile is chosen as q(r)=qb+qa(ra0)2, in which qb=0.85, qa=4.6. The radial profile of equilibrium density is expressed as n0(r)=exp(−ΔrLn⋅tanh(r−a02Δr)), the temperature profile T0(r)=exp(−ΔrLT⋅tanh(r−a02Δr)), in which Δr=a0/5, the density scale length Ln=R0/2.22, andthe temperature scale length LT=R0/6.92. The grid number in radial, poloidal and toroidal directions is taken as (Nx,Ny,Nz)=(64,128,64).
3.
PMSA algorithm
In tokamak plasmas, the generation of magnetic islands due to MHD activities (for example, the resistive tearing mode) may change, and may even destroy the equilibrium magnetic topology. Precise identification of a perturbed magnetic surface in the presence of magnetic islands is essentially important. Generally, a perturbed magnetic surface is usually described by a helical flux function as:
ψh=ψp−1qsψt+(R0+rcosθ)α0cos(mθ−nφ),
(9)
where ψp and ψt are the poloidal and toroidal magnetic flux functions. Here, the safety factor q is assumed as a constant qs in the island region. This approximation is acceptable in circular cross section plasmas only in the case with small islands. However, for large islands, especially when islands grow to the saturated state, this helical flux function cannot describe the perturbed magnetic surface precisely. Hence, a more accurate method, which tracks the perturbed field line, is adopted.
For a given magnetic field profile, the field line can be tracked by solving the field-line equation:
1rdrdθ=δBBθ,
(10)
Rrdφdθ=BφBθ.
(11)
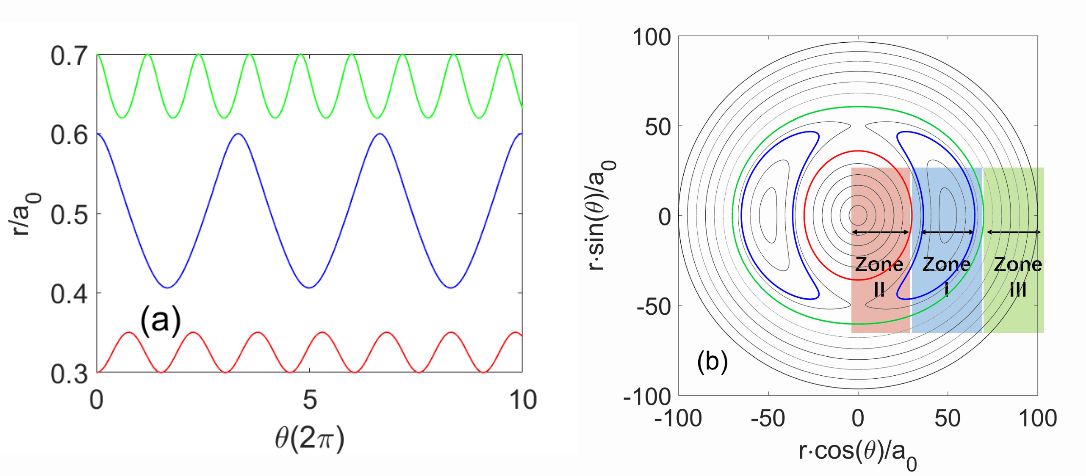
Assuming that the perturbed field is expressed by a sinusoidal function, δB=δ˜B(w)sin(2θ−φ). The radial projections of three field lines passing positions (r=65,θ=0,φ=0), (60,0,0)and(30,0,0) are shown in figure 1(a). Here, the island half-width w=16 and the minus radius of the device a0=100. The corresponding contour plots of these three field lines are drawn in the poloidal cross section, as shown in figure 1(b), which are located in magnetic island regions (zone I), and inner (zone II) and outer (zone III) island regions, respectively. The perturbed magnetic surfaces are defined to locate in zone I. The maximum of the radial projection in zones I and III is chosen to define the perturbed magnetic surfaces on which the field lines lie, and the minimum of the projection is used in zone II. Then, the radial grid is uniformly discretized in these three zones.
Figure
1.
(a) Projections of three perturbed field lines on the (r,θ) plane, and (b) the corresponding contour plots (blue, red and green lines) in the poloidal cross section, which are located in magnetic island regions (zone I), and inner (zone II) and outer (zone III) island regions, respectively.
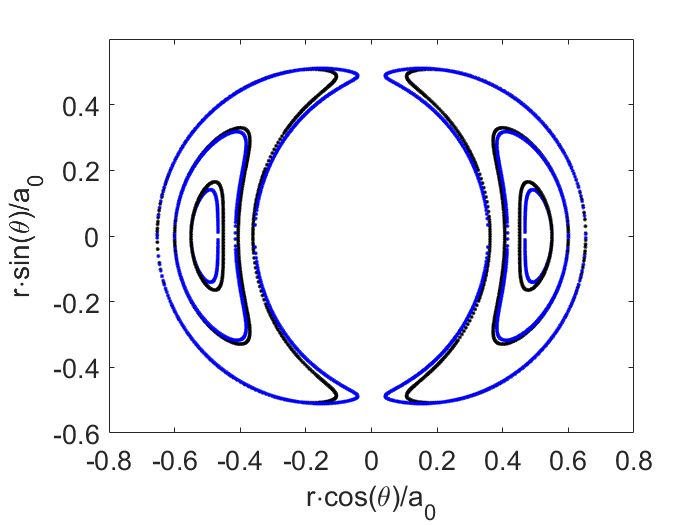
Figure 2 exhibits the comparison of the perturbed magnetic surfaces, calculated by applying EMSA and PMSA methods. The black-dotted and blue-dotted lines denote the perturbed magnetic surface that is solved by tracking the field lines and the helical flux function ψh. It can be seen that the magnetic surfaces calculated using the above two methods obviously differ from each other. Here, only the surfaces inside zone I are plotted due to an ignorable difference in zone II and zone III. Such a large difference in the description of magnetic surfaces inside islands may cause zonal flow inaccuracy in ITG turbulence simulations, which plays an important role in ITG turbulence saturation and transport suppression. Besides, note that the averaged bootstrap current on the perturbed magnetic surface inside islands has a significant influence on the growth of magnetic islands [19]. Thus, this result may also be a valuable reference when studying the growth of neoclassical tearing modes (NTMs). Such an issue is beyond the scope of this work and will be investigated in future work.
Figure
2.
Contour plots of magnetic flux inside zone I, obtained by tracking perturbed field lines (black-dotted) and using a traditional method (blue-dotted), respectively.
After the perturbed magnetic surface grid is uniformly discretized, the Poisson equation can be solved in two steps. Firstly, the ion density is averaged on the perturbed magnetic surface, and the perturbed zonal component of the electric potential is achieved by solving equation (12),
−∇2⟨ϕ⟩pmsa=e⟨δni⟩pmsa,
(12)
in which ⟨A⟩pmsa=∫Ω+δΩΩ−δΩAJdΩ/∫Ω+δΩΩ−δΩJdΩ is the PMSA operator. Secondly, by substituting this zonal component into equation (13), the total potential can be solved.
−∇2ϕ+e2KT(ϕ−⟨ϕ⟩pmsa)=eδni=eδne.
(13)
Note that a similar PMSA method has been introduced recently [20]. Nevertheless, the algorithm in this work is somehow advanced in the following two aspects. First, the ion density on each equilibrium grid is interpolated through two adjacent perturbed magnetic surfaces here. This treatment may be of higher accuracy, especially for the grids around the X-point of magnetic islands. Second, the average operation here is acted upon on the perturbed magnetic surface for all the components of the electric potential, rather than just for the zonal and (2, 1) components.
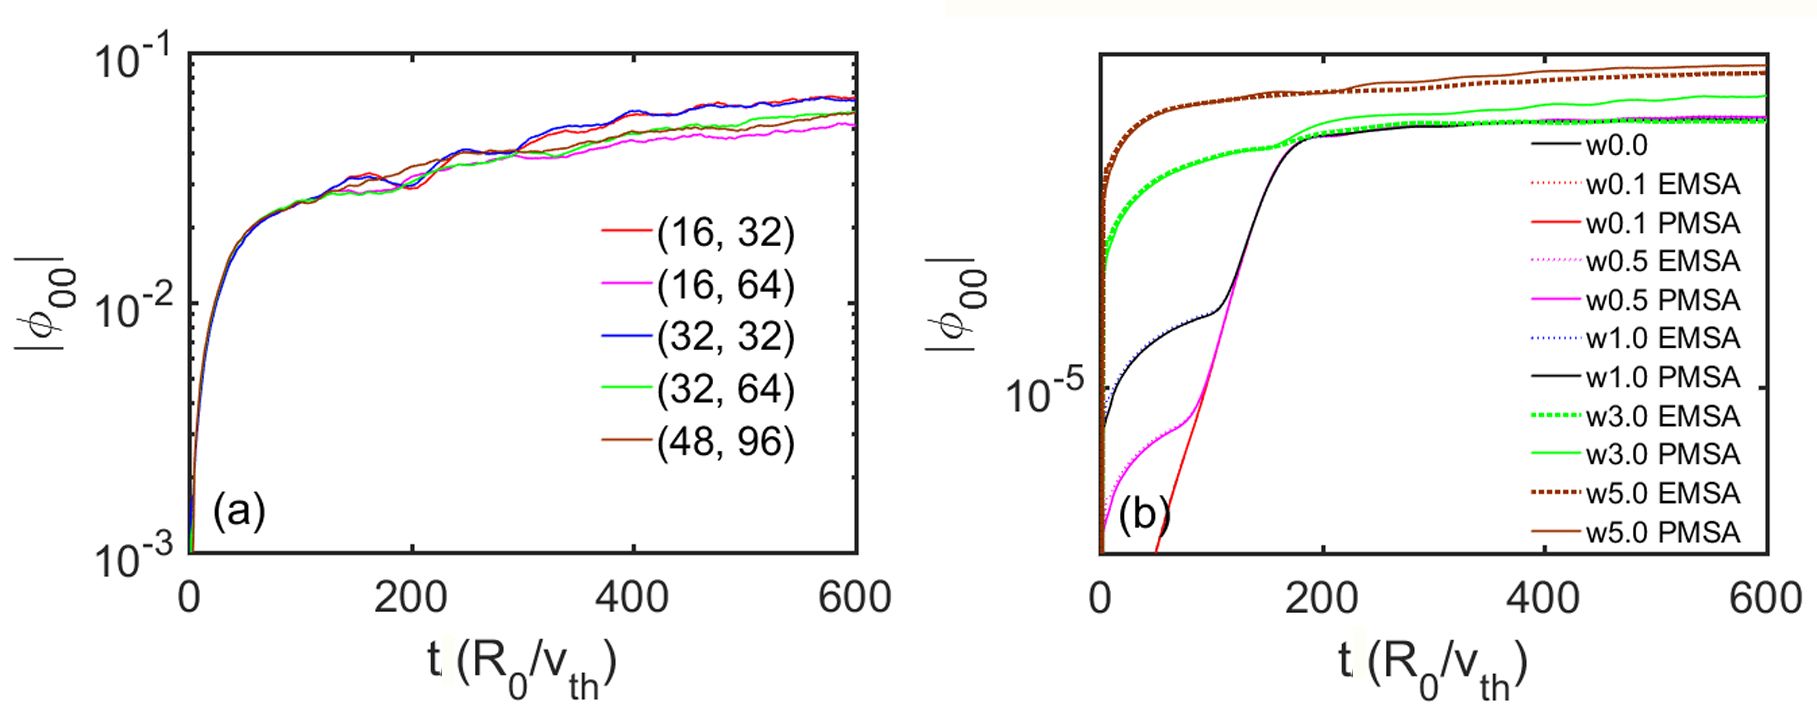
The numerical convergency of the new algorithm above is checked by comparing the zonal flow level. First, for a given island half-width of w=5ρi, the grid number of the perturbed magnetic surface is scanned in figure 3(a) with (NΩ,in,NΩ,out) = (16, 32), (16, 64), (32, 32), (32, 64), (48, 96), where NΩ,in and NΩ,out denote the grid number inside and outside the islands region. The same grid number is chosen in zones II and III. Then, in figure 3(b), the grid number is kept as a constant (NΩ,in,NΩ,out)=(32,64), while the island half-width is scanned for w=(0,0.1,0.5,1,3,5)ρi. The solid and dotted lines represent the results with and without the PMSA operator, respectively. It can be seen from figure 3(a) that the zonal flow level converges with the increase in the perturbed magnetic surface grid number. Figure 3(b) shows that the zonal flow levels converge to the results in the absence of magnetic islands with the PMSA operator when the island width is extremely small.
Figure
3.
The zonal flow level with different perturbed magnetic surface grids for given magnetic islands (a) and with different island sizes for given perturbed magnetic surface grids (b). The solid and dotted curves label the results with and without the PMSA operator, respectively.
4.
Magnetic-island-induced electric potential vortex mode
After the convergence of the PMSA algorithm has been well examined, we employ it to investigate ITG turbulence with embedded static magnetic islands. First, we simulate ITG mode with static (2, 1) magnetic islands turned on from the beginning. The magnetic island sizes are scanned. When the EMSA operator is adopted, it is found that the (2, 1) electric potential vortex mode appears to be a layered structure in the poloidal cross section for an extremely small island half-width with w<3ρi, as shown in figure 4(a). This result is the same as those cases in the absence of magnetic islands. It indicates that very small islands could barely influence the ITG turbulence. However, as the magnetic island half-width increases, i.e., w⩾, an oddly symmetric electric potential vortex mode is formed with a fluctuation structure similar to that in the poloidal cross section, as displayed in figure 4(b).
Figure
4.
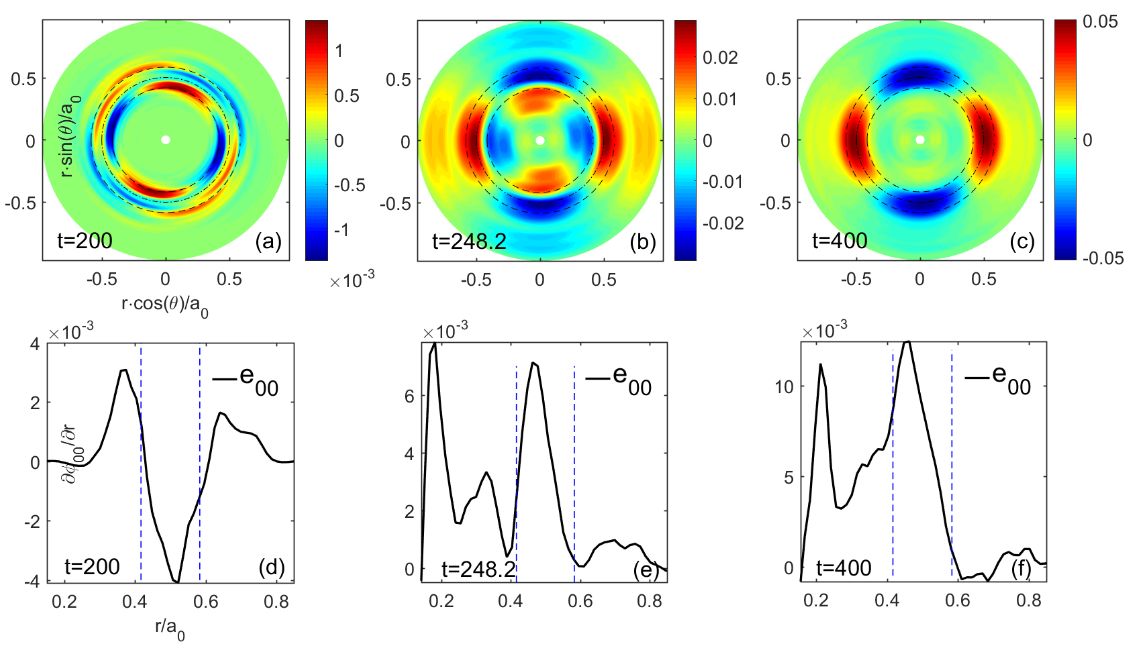
Contour plots of the (2, 1) electric potential vortex mode structure ((a)–(c)) and the corresponding zonal flow profile ((d)–(f)) before (a), shortly after (b) and long after (c) the magnetic island is switched on.
Second, the magnetic surface average operator is switched to the PMSA. The simulation results show that the structure of the potential vortex mode in the small islands stays almost the same as that in EMSA cases. However, for larger magnetic islands with w\geqslant 4{\rho }_{\mathrm{i}} , the potential vortex mode appears with an even parity structure, similar to that shown in figure 4(c). Note that in a similar gyro-fluid slab ITG turbulence simulation with a magnetic island, a parity transition of the potential vortex mode together with the alteration of the flow shear has been observed inside the magnetic island [21]. It seems to be in accordance with the experimental observation of plasma flow at the magnetic island in the Large Helical Device (LHD) [12]. In simulations here, the spontaneously developed zonal flow is found to be of even symmetry and monotonous variation around the O-point when using EMSA and PMSA operators, respectively. This means that, when using the PMSA operator, strong flow shear may result in the formation of this even symmetry potential structure. To testify such speculation, simulations are performed by excluding the magnetic islands \left(w=10{\rho }_{\mathrm{i}}\right) at the beginning until arriving at a quasi-steady state ( t=200 ). Figure 4 shows the transition processes of the zonal flow shear and the structure of the (2, 1) mode. First, the zonal flow inside the island separatrix displays an approximate even symmetric profile in the island region, as shown in figure 4(d) at t=200 . Then, it transfers to a different even symmetric profile with opposite flow shear behind a time lag of {\text{Δ}} t\approx 50 , as displayed in figure 4(e) at t=248.2 . Finally, the simulation ends up to a quasi-steady state with a monotonous zonal flow profile ( t=400 , figure 4(f)). Meanwhile, the parity of the (2, 1) mode structure changes from odd symmetry into even symmetry. Such transition processes clearly indicate that the parity of the (2, 1) potential vortex mode is closely related to the zonal flow shear. Besides, the sign of the electric field inside the island is found to change from negative (figure 4(d)) to positive (figures 4(e) and (f)), which is the same as the observations in the J-TEXT experiments [4].
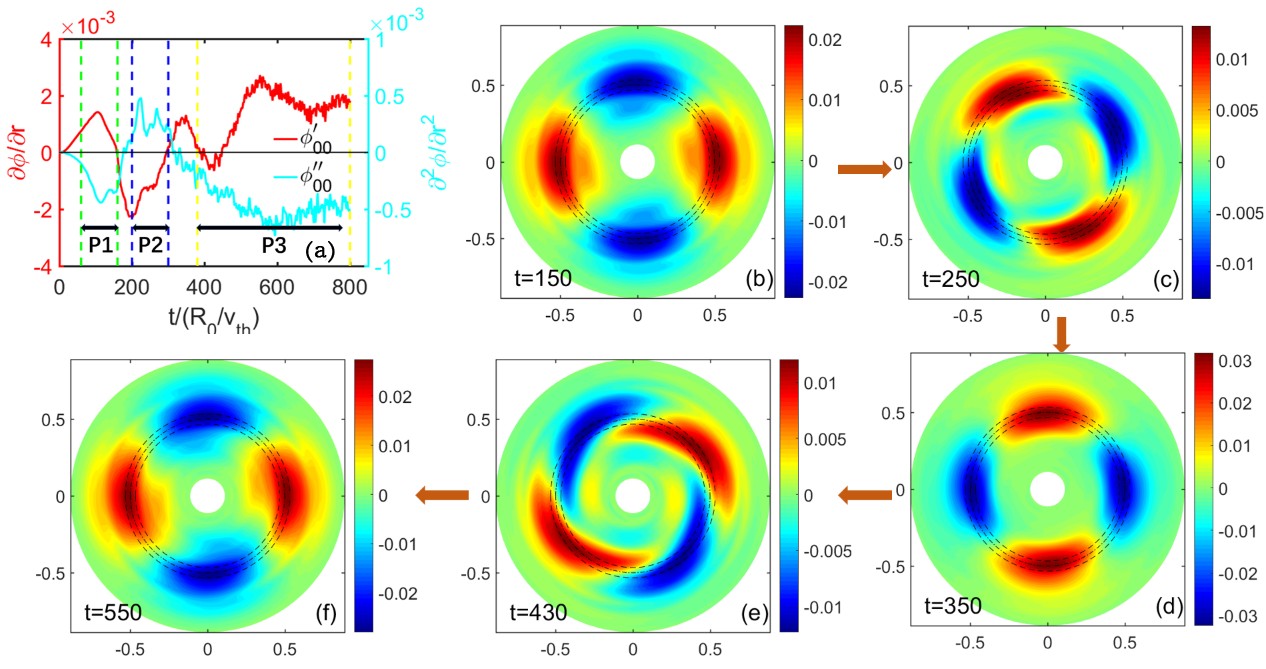
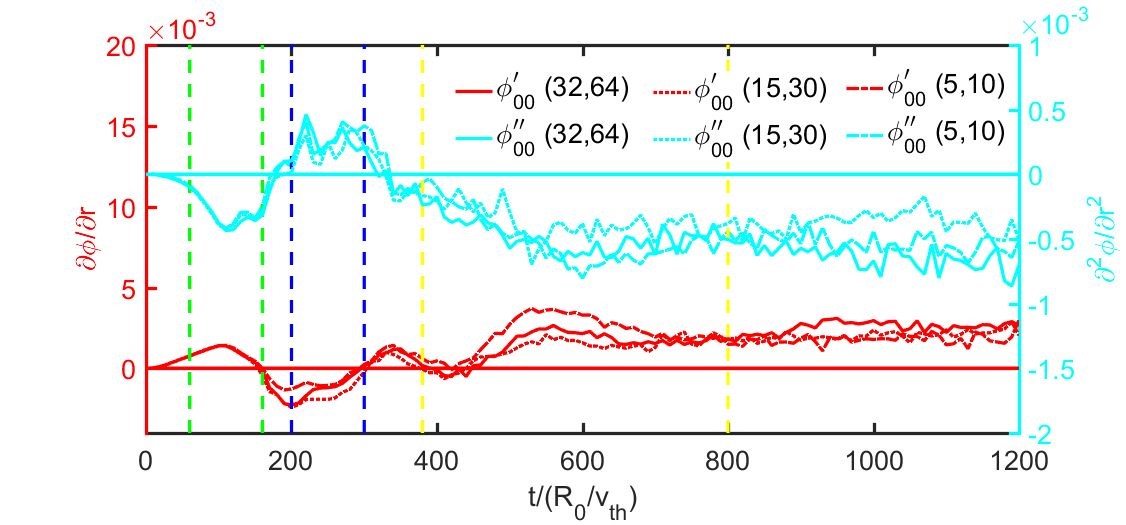
Most interestingly, simulations with medium-sized islands (for example, w=4{\rho }_{\mathrm{i}} ) switched on from the beginning show that the zonal flow dynamics inside island regions change with time. Figure 5(a) displays the time evolution of the averaged zonal flow and flow shear around O-points. The results show that the ITG turbulence reaches a temporary quasi-steady state with a negative zonal flow shear in period 1 ( t=60-160 ). The (2, 1) mode is characterized by an even parity vortex structure inside islands with a time lag of {\text{Δ}} t\approx 65 , as plotted in figure 4(b). Afterwards, the zonal flow shear changes from negative into positive, while the ITG turbulence evolves to another temporary quasi-steady state, i.e., the period 2 within t=200-300 . Meanwhile, the (2, 1) mode is observed to change parity during t= 280-380 , a time lag of {\text{Δ}} t\approx 80 , as shown in figure 5(d). From the time t=300 , the symmetry of the zonal flow is observed to change again and reaches the third quasi-steady state with a negative flow shear in period 3 ( t=380-800 ). Accordingly, the (2, 1) mode changes parity again with a time lag of {\text{Δ}} t\approx 80 , as plotted in figure 5(f). During the alternation of both the zonal flow symmetry and the parity of the (2, 1) vortex mode, it is noticed that the phase of the (2, 1) mode with even parity, as displayed in figure 5(d), in period 2 is π/2, which is different from those in periods 1 and 3, as displayed in figures 5(b) and (f). With similar theoretical analysis, as in reference [21], the (2,1) component of the electric potential {\varphi }_{\mathrm{2,1}} is proportional to \dfrac{{\partial }^{2}{\varphi }_{00}}{\partial {r}^{2}}\mathrm{c}\mathrm{o}\mathrm{s}\left(2\theta -\varphi \right) . It means that the phase of the (2, 1) vortex mode is governed by the sign of the flow shear with a difference of π/2. The simulation results show perfect consistency with the theory of the electric potential vortex mode inside magnetic islands. In addition, the vortex mode exhibits a twisted mode structure without pure odd or even parity, as shown in figures 5(c) and (e). The phase of these structures is not exactly π/2 or −π/2. It may be ascribed to the vortex mode rotation in transition periods. Actually, a similar phenomenon has been observed in GTC gyrokinetic simulations using a drift kinetic electron model [15]. The results here demonstrate that the electric potential vortex mode induced by magnetic islands closely couples with the zonal flow (including neoclassical sheared flow) dynamics, regardless of adiabatic or kinetic electron response. It should be noted that the change in the electric field sign and the vortex mode phase only appears in medium island cases. Furthermore, to remove the interference of resolution problems on the formation of this vortex, the perturbed surface grid number \left(N_{\mathrm{\Omega},\mathrm{i}\mathrm{n}},\ N_{\mathrm{\Omega},\mathrm{o}\mathrm{u}\mathrm{t}}\right) is decreased from (32, 64) to (15, 30) and (5, 10). The changes in the vortex phase and shear sign are also observed in smaller grid number cases, as shown in figure 6, which demonstrates that the phenomenon is not caused by resolution problems.
Figure
5.
(a) Time evolutions of the zonal flow velocity (red) and flow shear (blue). (b)‒(f) Contour plots of the (2, 1) electric potential vortex structure at different times.
Figure
6.
Time evolution of the zonal flow velocity (red) and flow shear (blue) with different perturbed surface grid numbers. The solid, dotted and chain lines represent \left(N_{\mathrm{\Omega},\mathrm{i}\mathrm{n}},\ N_{\mathrm{\Omega},\mathrm{o}\mathrm{u}\mathrm{t}}\right)=\left(32,\ 64\right),\ \left(15,\ 30\right) and \left(5,\ 10\right) , separately.
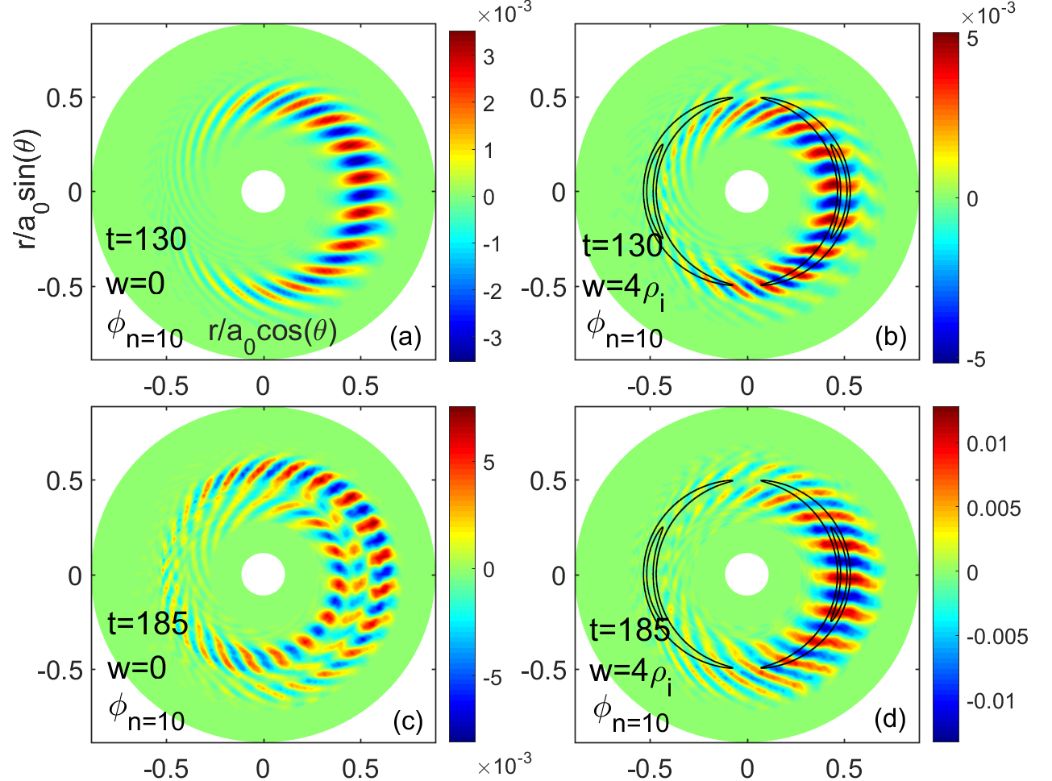
It has been found in both theorical works and experiments that the turbulence is suppressed inside islands but enhanced around the island separatrix [4, 14, 15]. In our simulation work, a similar phenomenon is found. The poloidal contour plots of the most unstable component of the ITG mode (n = 10) are given in figure 7. It can be seen clearly that both the linear (figure 7(b)) and the zonal flow dominated the nonlinear (figure 7(d)) stages, and the ITG mode is strengthened around the island separatrix and suppressed inside islands compared to figures 7(a) and (c). It was observed that significant turbulence modification occurs when the island width is larger than a threshold island width of {W}_{\rm T}\approx 5\;\mathrm{c}\mathrm{m}\approx 1.6{w}_{\mathrm{b}} in DIII-D experiments [5]. In our case, the island width w=4{\rho }_{\mathrm{i}}\approx 1.5{w}_{\mathrm{b}} , and this is consistent with the experimental results.
Figure
7.
Poloidal contour plots of the most unstable ITG mode (n = 10) at t=130{R}_{0}/{v}_{\mathrm{t}\mathrm{h}} [(a) and (b)] and at t=185{R}_{0}/{v}_{\mathrm{t}\mathrm{h}} [(c) and (d)] for the case without islands (left) and the case with islands (right) using the PMSA operator.
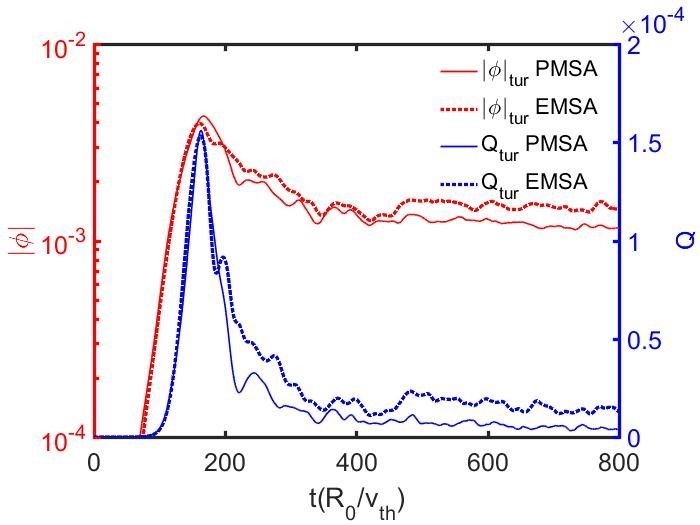
The formation of this vortex mode may have an influence on the turbulence intensity and transport in the magnetic island region. Corresponding to figure 5, the time evolution of the amplitude of turbulence (n = 7–13) and heat transport intensity caused by turbulence are now shown in figure 8, and are indicated by red and blue lines, respectively. The dotted and solid lines represent the results achieved using EMSA and PMSA operators. Here, both the turbulence strength and transport intensity are integrated from r={r}_{\mathrm{s}}-w to r={r}_{\mathrm{s}}+w in the radial direction. The heat flux intensity can be written as: {{Q}}_{\mathrm{tu}\mathrm{r}}={\left\langle{\delta {T}_{\mathrm{i}}{v}_{E}}\right\rangle}_{r,\theta ,\varphi }. From figure 8, it can be seen that the turbulence energy in the EMSA case (red-dotted line) is higher than that in the PMSA (red-solid line) case. By considering the existence of strong shear flow in the magnetic island region with the PMSA operator, which leads to the formation of this vortex mode, it can be inferred that the turbulence is suppressed by this strong flow shear, accompanied with weaker heat transport (blue-solid line). Meanwhile, in EMSA cases, the weak flow shear has a smaller suppression effect on turbulence, which thus causes much stronger heat transport (blue-dotted line).
Figure
8.
Time evolution of the amplitude of turbulence (red lines), and heat transport intensity caused by turbulence (blue lines).
In this work, ITG turbulence with embedded static magnetic islands is simulated by employing the GKNET code with a focus on the dynamics of the electric potential vortex mode induced by the magnetic island. In ITG turbulence, the zonal flow component is robust, which plays a crucial role in turbulence saturation and transport suppression. To precisely simulate the zonal flow level in ITG turbulence with an adiabatic electron response, an advanced algorithm that calculates the perturbed magnetic surface average (PMSA) is developed, in which the field lines are tracked by solving the field-line equation. It has been checked that the PMSA algorithm can simulate the zonal flow level in ITG turbulence with embedded magnetic islands with perfect numerical convergency. Specifically, the zonal flow levels in ITG turbulence simulations applying the PMSA operator converge to the results in the absence of magnetic islands when the island width is extremely small. Simulations are performed to investigate the influence of static magnetic islands on the ITG turbulence and transport by applying the PMSA algorithm. The results show that a prominent electric potential vortex structure is formed inside islands when a larger magnetic island is embedded, such as w\geqslant {4\rho }_{\mathrm{i}} . Such vortex structures are barely excited in the cases with small islands ( w < {3\rho }_{\mathrm{i}} ), regardless of the EMSA or PMSA operator applied. Most importantly, the radial parity of the vortex mode changes, depending mainly on the island width as well as the zonal flow shear. It is found that the radial parity of the vortex inside islands closely couples with the radial symmetry of the zonal flow profile, similar to the observations in gyro-fluid simulations of slab ITG turbulence with static (1, 1) magnetic islands. It is observed that when the zonal flow profile is evenly symmetric around the islands, the corresponding electric potential vortex mode is characterized by radial odd parity and vice versa. Furthermore, it is clarified that the phase of the potential vortex in the poloidal cross section depends on the zonal flow shear, showing an alteration by π/2 as the sign of the zonal flow shear changes.
Imadera K et al Global profile relaxation coupled with E x B staircase in toroidal flux-driven ITG turbulence In: Proceedings of the 25th IAEA Fusion Energy Conference, Saint Petersburg, Russia New York: IAEA 2014


 DownLoad: