State Key Laboratory of Nuclear Physics and Technology, School of Physics, Fusion Simulation Center, Peking University, Beijing 100871, People's Republic of China
2.
Department of Physics, Institute of Space Environment and Matter Science, Harbin Institute of Technology, Harbin 150001, People's Republic of China
3.
Key Laboratory of Materials Modification by Laser, Ion and Electron Beams (Ministry of Education), School of Physics, Dalian University of Technology, Dalian 116024, People's Republic of China
4.
Center for Fusion Science of Southwestern Institute of Physics, Chengdu 610041, People's Republic of China
5.
Shaanxi Key Laboratory of Plasma Physics and Applied Technology, Xi'an 710100, People's Republic of China
6.
Xi'an Aerospace Propulsion Institute, Xi'an 710100, People's Republic of China
Helicon wave plasma sources have the well-known advantages of high efficiency and high plasma density, with broad applications in many areas. The crucial mechanism lies with mode transitions, which has been an outstanding issue for years. We have built a fluid simulation model and further developed the Peking University Helicon Discharge code. The mode transitions, also known as density jumps, of a single-loop antenna discharge are reproduced in simulations for the first time. It is found that large-amplitude standing helicon waves (SHWs) are responsible for the mode transitions, similar to those of a resonant cavity for laser generation. This paper intends to give a complete and quantitative SHW resonance theory to explain the relationship of the mode transitions and the SHWs. The SHW resonance theory reasonably explains several key questions in helicon plasmas, such as mode transition and efficient power absorption, and helps to improve future plasma generation methods.
Producing high-density plasmas with high power efficiency is the central issue in plasma research, with broad applications in science and technology. Helicon wave plasma (HWP) sources are well known for their advantages of high power efficiency and high plasma density, as well as the feature of having no internal electrode [1, 2]. They thus have important applications in basic plasma research [3, 4], materials processing [5], current drive in tokamaks [6–8], electric propulsion [9–11], and many other areas. In particular, high density and high efficiency plasmas can greatly improve the use of energy and working media for better applications. The key to the high density and high efficiency of helicon plasmas lies on the transitions between various discharge modes, especially from the inductive (H) mode to the wave (W) modes, with significant density jumps [12, 13]. The H mode discharge exhibits low density and low power absorption efficiency. As the discharge power increases, the discharge will switch from H mode to W modes, accompanied by a rapid increase in density and power efficiency. Nevertheless, the physical mechanism of the mode transition is still an outstanding issue [14, 15].
Since Boswell discovered helicon plasmas in 1970 [16], their discharge mechanism has been studied extensively [14, 15, 17, 18]. Nevertheless, the calculated collisional absorption rate for helicon waves was much too low to explain the efficient ionization observed in experiments [16, 19]. Chen suggested that the Landau damping of the helicon waves possibly led to efficient power absorption [19]. On the other hand, however, experiments found that such Landau damping was unimportant to helicon plasmas [20]. Then, the strongly damped Trivelpiece-Gould (TG) wave was considered as the main heating mechanism [14, 21, 22]. However, the TG wave induced effects were expected to be important only for low dc magnetic fields and/or low plasma density [23, 24]. Nisoa et al further suggested a connection between high density and standing helicon waves (SHWs) [25, 26]. The presence of SHWs has been observed experimentally [13, 25–27], but the mechanism leading to the high density has not been clarified.
Clearly, the discharge mechanism in helicon plasmas has not been fully understood in previous studies. Thus there are still a few key issues to be resolved: (1) high efficient power absorption [28]; (2) mode transitions and different W modes [13]. There are also other questions to be answered, e.g., why W mode discharges can be realized by different antennas, such as helical, Nagoya, Boswell antennas, and even a single metal loop, etc [14]. In addition, the background magnetic field and measured densities are in agreement with the helicon wave dispersion relation [28]. Moreover, the lower the pressure is, the more pronounced the density jump is found in helicon discharges [13, 29].
Although many experiments have found density jumps [13, 26, 30, 31], direct simulation results are still lacking. The Peking University Helicon Discharge (PHD) code [32] has been developed to study the mechanism of helicon discharges. It is found in this work that the large-amplitude SHWs formed during the discharge processes are responsible for the mode transitions. The processes involved are as those of a resonant cavity for laser generation. The SHW resonance theory proposed in this work reasonably explains the key problems mentioned above. In addition, the SHW resonance theory can predict the conditions of density jumps and can be used to design HWP sources. Moreover, simulation results of the density jumps are presented for the first time. The simulations of the density jump and the theoretical analysis for the SHW resonance are presented as follows.
2.
Mode transitions
Argon discharge processes are numerically studied by the PHD code. A single-fluid model of equations (1)–(5) is applied, with basic discharge processes, such as ionizations, transports, and power depositions. The electromagnetic waves in vacuum and plasma areas can be described by Maxwell's equations (1) and (2) and the generalized Ohm's law equation (3) [1, 32].
∂B∂t=-∇×E,
(1)
∂E∂t=1μ0ε0εr(∇×B-μ0(Ja+Jp)),
(2)
∂Jp∂t=e2nemeE-emeJp×B0-νeJp,
(3)
where Ja,Jp and B0 are current densities of the antenna and the plasma, and the background magnetic field, respectively. The frequency of helicon wave is much higher than the lower hybrid frequency, so that ion motions can be neglected in equation (3). Equations for the plasma density and the electron temperature are
∂n∂t+∇·Γ=S,
(4)
32∂∂t(nTe)+∇·qe=pp-HiS,
(5)
where n is the plasma density. For the single-fluid model, we have n=ni=ne, where ni and ne are the argon ion density and electron density, respectively. Also, the closure for particle flux Γ and electron energy flux qe are written as
Γ=Da⊥∇⊥ne⊥+Da∇||ne||,
(6)
qe=-32n(Da⊥∇⊥Tee⊥+Da∇||Tee||)+52TeΓ,
(7)
where subscripts || and ⊥ represent the parallel and perpendicular directions to the magnetic field. The power deposition density pp in the plasma is pp=Jp·E. The total plasma power absorption Pt is obtained by spatially integrating and periodically averaging pp, i.e.,
Pt=1Trf∭
(8)
where is the period of the radio frequency (RF). The ionization term is only for the ground state atom ionization and is the first ionization energy. The calculation of the ambipolar diffusion coefficients and and other parameters can be found in [32, 33]. The boundary conditions on the plasma-wall interface are
(9)
(10)
where is the normal vector to the wall from the plasma, and is the electron thermal velocity at the wall. Perfect conductor boundary conditions are used for the sidewall and both end plates.
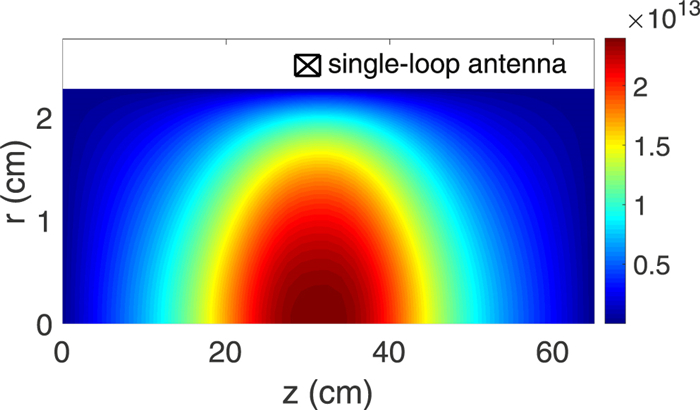
To compare the density jumps of the single-loop antenna between simulations and experiments, we use a configuration similar to that of [26], but with a slightly different antenna size. The configuration is shown in figure 1. In the cylindrical coordinate, the entire computational space is in the range of and with and respectively. The radial and axial distributions of the plasma are in the range of with and The positions of the single-loop antenna with a width of radially and axially are and respectively. The total input power is equal to the electron power absorption plus the Joule heat of the antenna i.e., where is the antenna resistance. The antenna current amplitude is adjusted to the total plasma power absorption to maintain a constant total power The antenna current is taken as with a frequency where is the cross-sectional area of the antenna.
Figure
1.
Schematic diagram of the simulation domain, where the contour is the steady-state electron density in for the parameters of
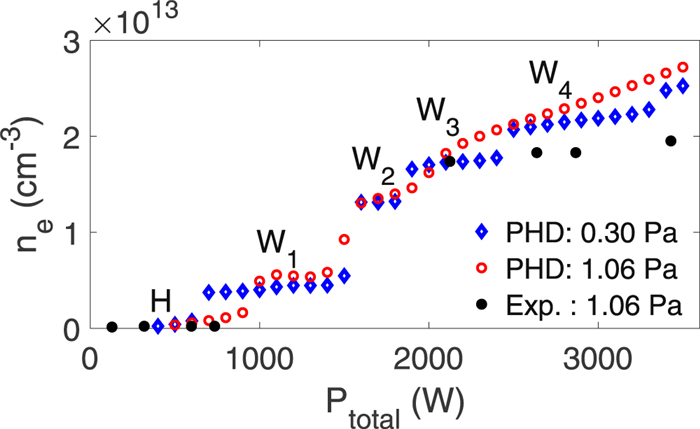
When the initial density is low, the plasma density is relatively low due to the capacitive discharge. Thus, the initial density is set as to discuss the transition of H to W mode. A uniform background magnetic field with a magnitude of is applied. The maximum plasma density at the steady state versus the power is shown in figure 2. The plasma density was measured by the ion saturation current of Langmuir probes at and [26]. Significant jumps in the density are found, especially with the neutral pressure of These modes are named as H, W1, W2, W3, W4 in order, respectively, where W1–W4 are various helicon wave modes.
Figure
2.
The variation of steady-state density with power, where the experimental data in solid black dots are from [26].
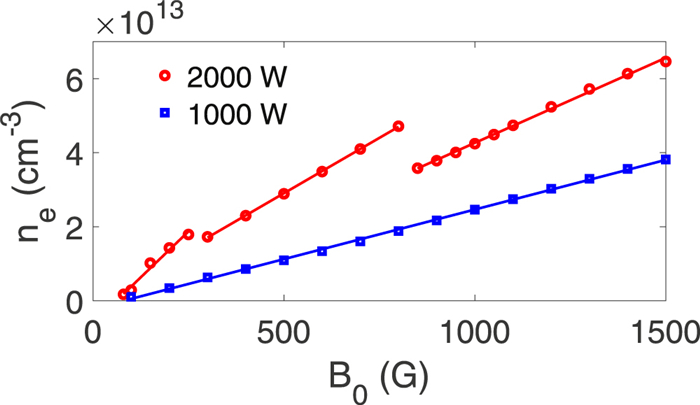
We further discuss the density jumps with the applied magnetic field strengths. Figure 3 shows the variation of steady-state density with the applied magnetic field. It can be seen that the density and magnetic field show a good linear relationship in a certain magnetic field range. In the dispersion relation of helicon waves, if the wave number is assumed to be a constant, the density and the magnetic field are linear as well. Conversely, if the density and the magnetic field show a linear relationship, it can be inferred that the wave number is the same in that magnetic field range. The subsequent analysis in section 3 points out that a wave number corresponds to a wave mode discharge. In the 2000 W power discharge, three line segments with different slopes appear, and we infer that they are three different W mode discharges. In the 1000 W power discharge, the discharges of different magnetic fields are the same W mode. Further analysis is to be carried out in the next article.
Figure
3.
The variation of steady-state density with the applied magnetic field, where the solid lines are linear fits of the simulated data. The argon pressure is 0.3 Pa.
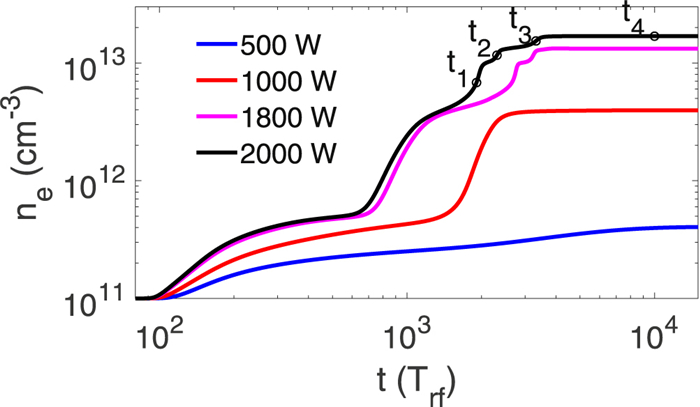
For the W mode discharges, it is found that the plasma density undergoes the second and/or even multiple jumps over time, as shown in figure 4; the same as the results in [32].
Figure
4.
Evolution of the maximum electron density for different RF powers, with parameters of (237 G, 0.3 Pa).
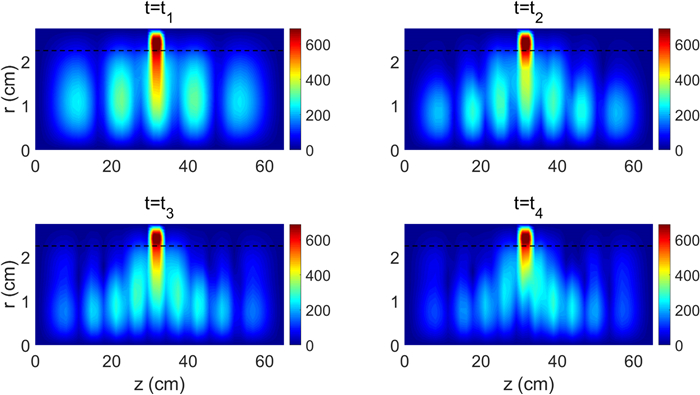
A clear standing wave structure appears at the moments of and shown in figure 5. The density jumps at different moments correspond to different axial mode numbers. The simulated wavelength of these moments is then compared with the dispersion relation of helicon waves in equation (13), where the radial wave number is The simulated wavelengths at moments and are and respectively, and the dispersion relations for the helicon waves are given as and respectively. The simulated results are close to the analytical dispersion relationship. The error comes from the inhomogeneity of the density. Therefore, we conclude that these standing waves are SHWs. The SHWs are observed just before these jumps and disappear at the steady state (similar to the figure 9 in [32]), as shown in figure 5. The reason is that the large-amplitude SHWs corresponding to the standing wave condition lead to a large amount of ionization, which makes the density increase and thus the standing wave condition fails, i.e., the large-amplitude SHWs disappear. When the discharge has reached the W mode, the high density leads to a high enough collision rate, and as a result, the partial SHWs can also maintain a steady-state discharge. Therefore, only partial standing waves are often observed in steady-state measurements [13, 25, 26, 34]. Rather than at the steady state, we thus suggest we should seek to detect the transition between H and W modes, and different W modes. The PHD simulation results closely fit the experimental results, as shown in figure 2.
Figure
5.
The distribution of the amplitude of the azimuthal electric field with units in at different moments, where are marked in figure 4 and the discharge parameters are ().
To further understand the mode transition, we then analyze the mechanism of the high electromagnetic power absorption in the helicon plasmas. That is, the equations (1)–(3) are studied in focus. Similar to Chen's analytical solution in cylindrical coordinates [19], with the polarization current and the electron inertia term neglected in equations (2) and (3), we have the azimuthal electric field
(11)
where is the mth order Bessel function and is the transverse wavenumber. The quantity is defined as and is an integration constant. For simplicity, we analyze the azimuthal mode with the mode number The analysis procedure for other modes () is similar to that for As an example, the simulation of the helical antenna with has been carried out and verified to be similar to Then, for equation (11) becomes
(12)
A perfect conductor boundary condition, is then applied to the plasma radial boundary The dispersion relation can thus be written as a function of plasma parameters,
(13)
where is the th root of with being the radial mode number. The analytical solution (equations (12) and (13)) can be used for cross-validation for simulation results.
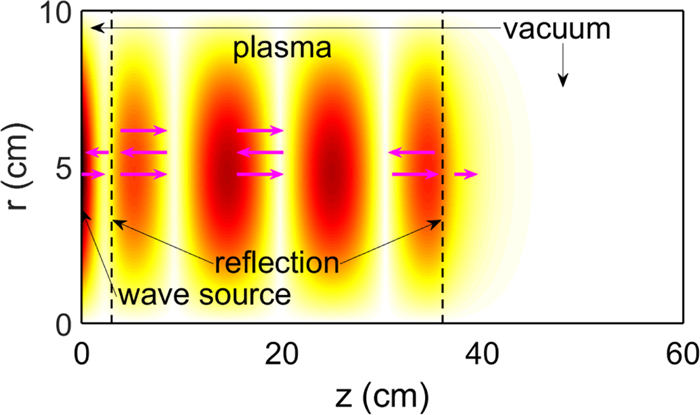
Equations (1)–(3) are numerically solved by the PHD code [32], in which the alternating-direction-implicit finite-difference time-domain (ADI-FDTD) method is used to improve computational efficiency [35, 36]. The schematic diagram of the simulation domain, which has analytic solutions, is shown in figure 6. In the cylindrical coordinate system, the entire computational space is in radially and axially, with and The distribution of the plasma is in the area of radially, and axially, with and With no loss of generality, the plasma region is assumed with a fixed and uniform density, while all other regions are vacuum. The background magnetic field is a uniform magnetic field with a magnitude of and the neutral pressure is
Figure
6.
Schematic diagram of the simulation domain and the distribution of SHWs, where the contour is the amplitude of for and the pink arrows indicate the propagation of helicon waves with reflections at both dashed lines.
The wave-driven boundary conditions are applied as and at with a wave-driven intensity and a frequency Perfect conductor boundary conditions are used at and
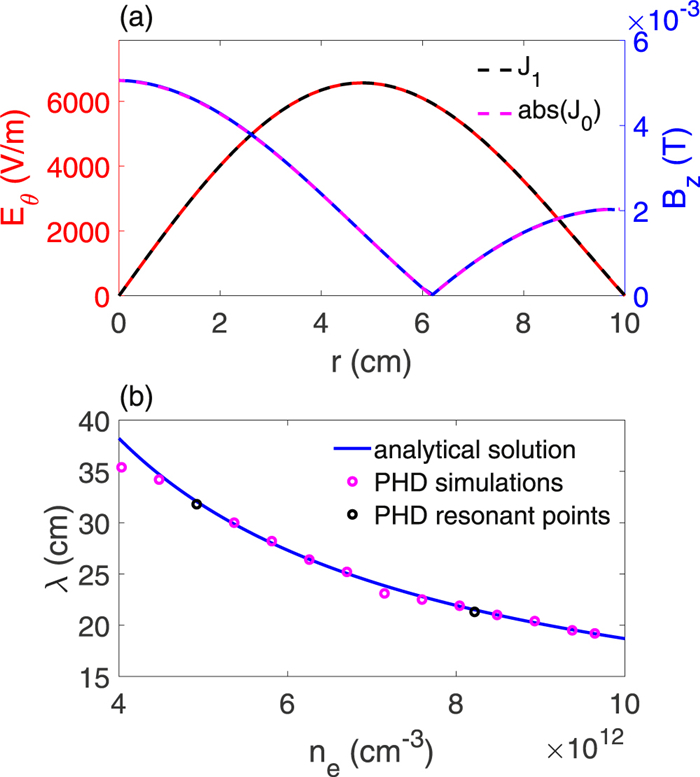
Both the electromagnetic field amplitude and the cycle-averaged power deposition are in steady state after for a specific Figure 7 shows the azimuthal electric field the axial magnetic field and the wavelength at (steady state), for simulations and analytical solutions. Figure 7(a) shows that the radial structures of and fit the Bessel functions very well. Kyeong-Koo Chi et al also observed that the radial had a form of the Bessel function [13]. In fact, simulation results at different densities and positions in our work always show a good fit with the Bessel function-like analytical solution. The wavelengths shown in figure 7(b) are calculated from the axial structure of (shown in figure 8(b)). Thus, one can see that the simulated dispersion relation matches well with the theoretical solution. According to figure 7, the numerical and theoretical solutions mutually verify the conclusion that the dominant waves in the system are the helicons.
Figure
7.
(a) the amplitude of and (point B in figure 8(a)) at fitted by the Bessel function and respectively, and (b) the wavelength of helicon waves for the simulation and the analytical solution.
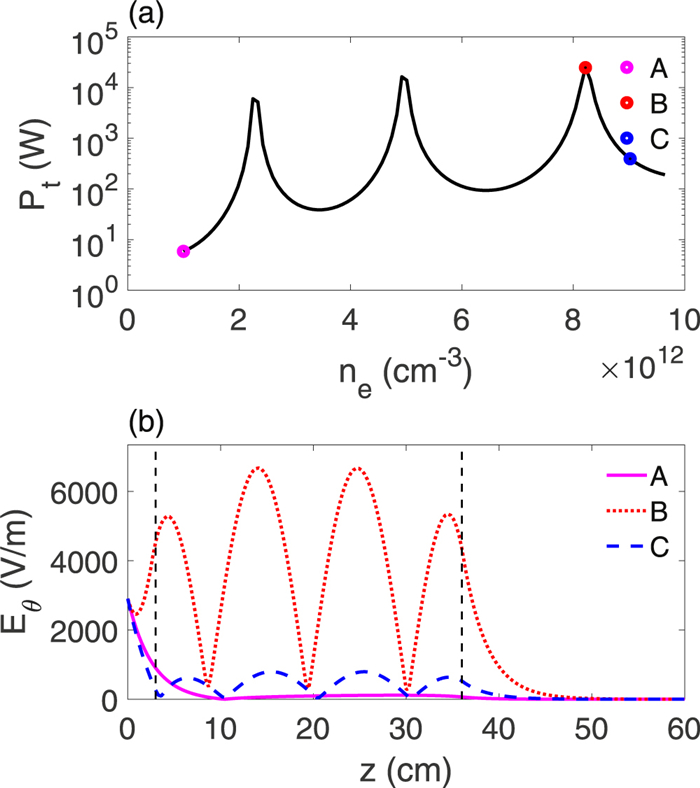
Figure 8(a) shows the dependence of on with three peaks of two orders of magnitude higher than the background. We refer to these peaks as resonances. The resonant and non-resonant at are shown in figure 8(b). It can be seen that at a low density (curve A), decays exponentially along the axis. In the resonance, we have the curve B for the large-amplitude SHW, where a clear standing wave appears and the maximum amplitude of in the plasma considerably exceeds the wave source. In non-resonant and high-density conditions (curve C), the SHW also appears, but with an amplitude significantly lower than that of curve B. It should be noticed that curves A and B in figure 8(b) are very similar to the experiment results in figure 9 of Motomura et al [37].
The power deposition can be written as where and are the amplitudes of and and the phase shift between and respectively. The simulation then reveals the dependence of and on with peaks similar to that in figure 8(a), while the dependence of on is almost monotonically increased by ~40%. Furthermore, is approximately proportional to Therefore, we can predict that the resonance absorption peaks in figure 8(a) are due to the wave energy The simulation results show the large-amplitude SHWs do indeed result in the peaks as varies with
Thus, the numerical simulations predict that the large-amplitude SHWs lead to efficient power absorption and mode transitions. The formation mechanism of the large-amplitude SHWs is now discussed. The helicon wave is weakly damped and able to propagate over a long distance in the plasma. The wave is then reflected at the plasma boundary, with a mechanism described later, and superimposed to form SHWs, as shown in figure 6. When the SHW resonance condition,
(14)
is satisfied, where is the axial length of the plasma column, the wave amplitude is coherently rising and the large-amplitude SHWs are formed to trigger a mode transition. The processes involved are as those for a resonant cavity to generate a laser. This SHW resonance theory is applicable to lots of helicon waves with different usually determined by helical, Nagoya, Boswell and single-loop antennas. Although the wavelengths are different for different helicon waves, their SHW resonance conditions are all determined by equation (14). The peak of power absorption occurs when this condition is satisfied. In applied discharges, there are usually two quantum numbers, the axial mode number and the radial mode number The combination of these two quantum numbers yields different W modes. Multiple W modes observed in experiments [13] can be interpreted by different modes. In addition, the SHW resonance condition requires a density higher than a threshold (corresponding to and ), which is the reason why the W modes cannot be reached at low power. It can be inferred that the longer the plasma column or the lower the magnetic field is, the lower the hopping power will be. In addition, under the same other conditions, the damping rate of the helicon wave does not change as increases. Therefore, the distance the wave travels does not change. As increases, the number of helicon waves traveling through the plasma decreases, resulting in a decrease in the amplitude of the superimposed wave and a decrease in the peak value of power deposition. In the discharge processes, an increase in leads to less obvious density jumps. Nevertheless, the increase in within a certain range may not reduce the power absorption efficiency of the W mode discharge, because the efficient power absorption mechanism of standing wave resonance is still effective. In summary, an increase in will result in 3 effects, including (1) a less obvious density jump, (2) an uncertain change in power efficiency and (3) a reduction in the power threshold required for the W mode. Although the plasma density and the background magnetic field are not uniform in general, the physical process is nevertheless approximately the same.
Reflection is necessary for the formation of SHWs. The metal end plate can easily reflect helicon waves. On the insulated end plates, it is found that with a high plasma density and a strong magnetic field, the helicon wave can also be reflected by the insulated end plates almost completely. The analysis is as follows.
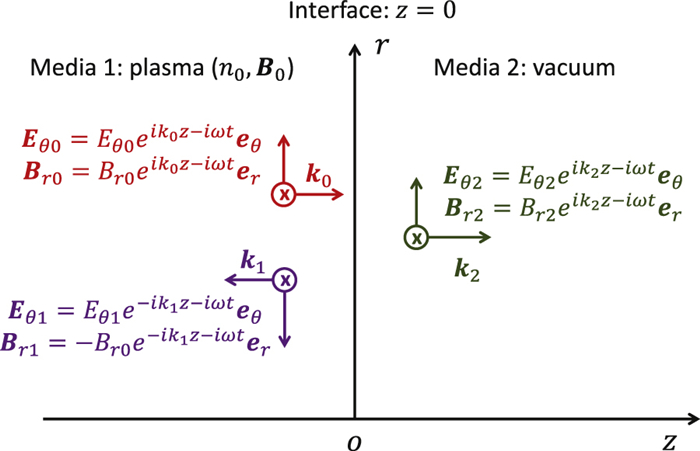
Figure 9 shows a helicon wave propagating parallel to the z-axis from medium 1 (the plasma with ) to medium 2 (the vacuum). The generated azimuthal electric field and radial magnetic field are then analyzed. The interface () separating the two media is an insulated end plate. The subscripts of incident, reflected, and refracted waves are marked as 0, 1 and 2, respectively. The relation between the magnetic and electric fields is written as
(15)
Figure
9.
Schematic diagram of the reflection of a helicon wave, where the incident, refracted, and reflected waves are marked in red, green and purple, respectively.
Considering the strong magnetic field and high plasma density, the wavenumbers and in the plasma are much larger than those in the vacuum, i.e.,
(16)
The insulation boundary condition is applied as
(17)
(18)
where Combining equations (15)–(18), the amplitudes of the reflected and refracted waves are obtained,
(19)
(20)
The amplitude of the reflected wave is approximately equal to that of the incident wave, indicating the wave to be mostly reflected. The amplitude of the refracted wave is nearly twice that of the incident wave, while the energy of the refracted wave is derived from the magnetic energy in the incident wave. The reason for the almost total reflection is that the wave number in the plasma under a strong magnetic field is much larger than that in the vacuum, i.e. equation (16). The reflection on the insulated end plate is then consistent with the experimental results in [37] (figure 11), where the standing wave structures were observed for both conductor and insulated end plates.
Both simulations and experiments show that the lower the pressure is, the more pronounced the jumps are [13, 29]. The reason is that a lower pressure leads to a smaller collision frequency and damping rate of the wave. Thus, the helicon wave travels longer, the superimposed electric field intensity is bigger, and the power absorption peaks become narrower and higher. As a result, the discharge pattern jumps significantly at low pressure. In addition, as the steady-state density exceeds the density jump becomes less pronounced due to the high collision frequency.
4.
Conclusion
In conclusion, the density jumps of a single-loop antenna discharge are reproduced in simulations for the first time and a complete and quantitative SHW resonance theory is presented in this paper. It is seen that the large-amplitude SHWs are responsible for the mode transitions, similar to those of a resonant cavity for laser generation. The SHW resonance theory reasonably explains the key problems of efficient power absorption and mode transitions. In addition, the analysis is independent of the antenna type. Therefore, the SHW resonance theory can be applied to plasmas excited by different types of helicon antennas. Moreover, the SHW resonance theory can also interpret: (1) the background magnetic field and measured densities are in agreement with the helicon wave dispersion relation; (2) the lower the pressure is, the more pronounced the density jump will be in helicon discharges. Finally, the mechanism of standing wave resonance can also be applied to other reflective or periodic systems to improve their efficiency, such as wave drive/heating in tokamak plasmas.
Acknowledgments
We would like to acknowledge Y Lang for useful discussions. This project was supported by the National Key R & D Program of China (No. 2017YFE0301201) and National Natural Science Foundation of China (No. 11975038). We acknowledge the funding support from the State Key Laboratory of Nuclear Physics and Technology, Peking University (No. NPT2021ZZ03).
Kong, W., Dong, H., Wu, J. et al. Control of frictional and total drag by porous media at high Reynolds number wall turbulence conditions. Physics of Fluids, 2025, 37(3): 035205.
DOI:10.1063/5.0260094
2.
Zheng, B., Qi, S., Yu, M. et al. Turbulent drag reduction by sector-shaped counter-flow dielectric barrier discharge plasma actuator. Chinese Physics B, 2025, 34(2): 025205.
DOI:10.1088/1674-1056/ada1c6
3.
Su, Z., Zong, H., Liang, H. et al. Investigation of pulsed direct-current plasma jets in a turbulent boundary layer. Physics of Fluids, 2024, 36(3): 035128.
DOI:10.1063/5.0190336
4.
Zheng, H., Gao, C., Wu, B. et al. Drag reduction control of turbulent boundary layer based on plasma actuation | [基于等离子体激励的湍流边界层减阻控制]. Hangkong Dongli Xuebao/Journal of Aerospace Power, 2023, 38(5): 1157-1165.
DOI:10.13224/j.cnki.jasp.20210546
5.
SU, Z., ZONG, H., LIANG, H. et al. Minimizing airfoil drag at low angles of attack with DBD-based turbulent drag reduction methods. Chinese Journal of Aeronautics, 2023, 36(4): 104-119.
DOI:10.1016/j.cja.2022.11.019
6.
Yan, R., Wu, B., Gao, C. et al. Enhanced heat transfer in Poiseuille-Rayleigh-Bénard flows based on dielectric-barrier-discharge plasma actuation. Physics of Plasmas, 2023, 30(3): 033501.
DOI:10.1063/5.0131414
7.
Su, Z., Zong, H., Liang, H. et al. Optimization in frequency characteristics of an oscillating dielectric barrier discharge plasma actuator. Sensors and Actuators A: Physical, 2023.
DOI:10.1016/j.sna.2023.114195
8.
Xu, Z., Wu, B., Gao, C. et al. Experimental investigation of dynamic stall flow control using a microsecond-pulsed plasma actuator. Plasma Science and Technology, 2023, 25(3): 035509.
DOI:10.1088/2058-6272/aca18f
9.
Zhang, X., Wang, X. RESEARCH PROGRESS AND OUTLOOK OF FLOW FIELD CREATED BY DIELECTRIC BARRIER DISCHARGE PLASMA ACTUATORS DRIVEN BY A SINUSOIDAL ALTERNATING CURRENT HIGH-VOLTAGE POWER | [正弦交流介质阻挡放电等离子体激励器诱导流场研究的进展与展望]. Lixue Xuebao/Chinese Journal of Theoretical and Applied Mechanics, 2023, 55(2): 285-298.
DOI:10.6052/0459-1879-22-377
10.
Zhao, J., Zhang, H., Meng, X. et al. Aerodynamic effects of a tube-type AC-SDBD plasma actuator. 2023.
DOI:10.2514/6.2023-3747
11.
Su, Z., Zong, H., Liang, H. et al. Progress and outlook of plasma-based turbulent skin-friction drag reduction | [等离子体湍流摩擦减阻研究进展与展望]. Kongqi Donglixue Xuebao/Acta Aerodynamica Sinica, 2023, 41(9): 1-19.
DOI:10.7638/kqdlxxb-2023.0083
12.
Chen, J., Zong, H., Song, H. et al. AI-based real-time noise reduction of flow field pressure signals under plasma electromagnetic interference | [等离子体电磁干扰下圆柱绕流壁面压力信号 AI 实时降噪]. Shiyan Liuti Lixue/Journal of Experiments in Fluid Mechanics, 2023, 37(4): 59-65.
DOI:10.11729/syltlx20230030
13.
Zong, H., Wu, Y., Liang, H. et al. Experimental Investigation and Intelligent Optimization of Airfoil Zero-Lift Drag Reduction with Plasma Actuators. AIAA Journal, 2023, 61(1): 223-240.
DOI:10.2514/1.J062099
14.
Hui, W., Meng, X., Li, H. et al. Flow induced by a pair of plasma actuators on a circular cylinder in still air under duty-cycle actuation. Physics of Fluids, 2022, 34(12): 123613.
DOI:10.1063/5.0124744
15.
ZHENG, B., JIN, Y., YU, M. et al. Turbulent drag reduction by spanwise slot blowing pulsed plasma actuation. Plasma Science and Technology, 2022, 24(11): 114003.
DOI:10.1088/2058-6272/ac72e2
16.
Zong, H., Su, Z., Liang, H. et al. Experimental investigation and reduced-order modeling of plasma jets in a turbulent boundary layer for skin-friction drag reduction. Physics of Fluids, 2022, 34(8): 0104609.
DOI:10.1063/5.0104609
17.
Li, Y., Wu, Y., Liang, H. et al. Exploration and outlook of plasma-actuated gas dynamics | [等离子体激励气动力学探索与展望]. Advances in Mechanics, 2022, 52(1): 1-32.
DOI:10.6052/1000-0992-21-044
18.
Zhu, Z., Fradera-Soler, P., Jo, W. et al. Numerical simulation of the flow around a square cylinder under plasma actuator control. Physics of Fluids, 2021, 33(12): 123611.
DOI:10.1063/5.0072081
19.
Zhao, L., Xiao, Z., Liu, F. Simulation of flow induced by single-dielectric-barrier-discharge plasma actuator using a high-order flux-reconstruction scheme. Physics of Fluids, 2021, 33(4): 047108.
DOI:10.1063/5.0046900
20.
Li, Y., Gao, C., Wu, B. et al. Turbulent boundary layer control with a spanwise array of DBD plasma actuators. Plasma Science and Technology, 2021, 23(2): 025501.
DOI:10.1088/2058-6272/abce0d

 DownLoad: