The scattering points in a plasma sheath characterized with coupled velocities can cause pulse compression mismatching, which results in displacement and energy diffusion in the one-dimension range profile. To solve this problem, we deduce the echo model of the plasma-sheath-enveloped reentry object. By estimating the coupled velocities, we propose a compensation method to correct the defocus of an inverse synthetic aperture radar (ISAR) image in range dimension to improve the quality of the ISAR images. The simulation results suggest that the echoes from different regions of the surface of the reentry object have various coupling velocities, and the higher the coupled velocity, the more serious the displacement and energy diffusion in the range dimension. Our proposed method can correct the range dimension aberration. Two measurement metrics were used to evaluate the improvement of the compensation method.
Inverse synthetic aperture radar (ISAR) imaging is an effective technique by which images of moving targets in the range-Doppler domain can be obtained [1, 2]. Two-dimensional high-resolution images of the reentry object can be obtained by ISAR imaging for subsequent operations of target recognition, which is of great significance to the safe recovery of spacecraft. When a reentry spacecraft enters into the Earth's near-space atmosphere, the effect of the generated aerodynamic heat can form a plasma sheath covering the surface of the reentry object [3–5], absorbing, attenuating and reflecting electromagnetic (EM) waves [6–8].
For the ISAR imaging of high-speed targets, research on the compensation method of the moving-in-pulse duration (MPD) has attracted much attention. Feng et al proposed an effective algorithm based on Radon transform for the range profile of a hypersonic target, through which the range profile aberration and ISAR image blurring can be compensated [9]. Tian et al studied the integrated cubic phase function and estimated the second-order phase coefficient to compensate for the high-speed movement on ISAR images [10]. However, these studies mainly focused on the influence of the target's high velocity on ISAR defocusing and ignored the problem of the generated plasma sheath enveloping the target during the flight.
In addition to the above problem, most of the related studies focused on the influence of the plasma sheath imposed on radar detection. Yuan et al analyzed the relationship between the plasma parameters and the reflection that is a combination of the power reflected from the plasma interface. They derived that the reflections of the incident wave power depended on the thickness of plasma for different incident wave frequencies and various plasma parameters [11]. Ding et al discovered that the velocity of the plasma sheath had an effect on the one-dimensional range profile, which caused a false target and even detection failures [12]. In their approach, the reentry object was treated as a single scattering point rather than multiple scattering points, which is a prerequisite for high-resolution ISAR imaging. Zhang et al proposed a wideband radar scattering center model of a plasma-sheath-covered reentry target, in which the reflection characteristics and velocity of the plasma sheath are considered [13]. Despite the fact that their research proposed a basic model, they did not conduct a profound analysis of the problems caused by the plasma sheath. Xu et al presented the MPD model for hypersonic targets and evaluated the performances of pulse compression under the stop-and-go and MPD models by theoretical analysis and simulations [14]. However, the effect of plasma was not considered in their study.
Unfortunately, few studies concerning the ISAR defocusing of the reentry object can be found so far. This work analyzes the reflection characteristics of the plasma sheath to obtain the radar echo model of the plasma-sheath-enveloped reentry object. It is found that in the areas with high electron density, the EM wave cannot penetrate through the plasma sheath, and the radar scattering points are distributed at a certain depth in the plasma sheath. These scattering points are affected by the flow field of the plasma sheath, exhibiting coupled velocities. The coupled velocities will further introduce linear frequency modulation (LFM) in the pulse compression results, causing displacement and energy diffusion in the one-dimension range profile. Because the coupled velocities of scattering points differ in the plasma sheath, certain regions of the ISAR image will be distorted and defocused to some extent in the range dimension. By estimating the coupled velocity, we propose a compensation method to correct the range dimension aberration. The simulation results and two measurement metrics have verified the effectiveness of our proposed method.
The remainder of this paper is organized as follows. Section 2 introduces the reflection coefficient of the plasma sheath and the reflection depths with different electron densities. Section 3 deduces the echo model of the plasma sheath and discusses the formation mechanism of displacement and energy diffusion in the range dimension. Section 4 proposes the compensation method. Section 5 simulates the results of ISAR imaging using the compensation method, and evaluates the improvement effect. Section 6 summarizes the conclusions of this paper.
2.
Reflection coefficient and reflection depth of plasma sheath
The plasma is an ionized medium that can absorb, attenuate and reflect EM waves. Functioning as the most important parameter of plasma, the reflection characteristics of plasma primarily correlate with the electron density [15]. Currently, the most commonly used method to analyze the parameters of the plasma sheath is numerical simulation of computational fluid dynamics (CFD) [16, 17]. In this work, we adopt the simulation data from the CFD of RAM-C Ⅱ to establish the blunt cone model [18, 19]. In the study of the RAM-C Ⅱ project, the altitude of the reentry object ranges from 20 to 80 km. At high altitude, the air density and temperature are lower, so the plasma has lower electron density, and can be penetrated by the EM wave. At low altitude, the air density and temperature are higher, so the plasma has a higher electron density that is difficult for the EM wave to penetrate through. In this study, we choose the reentry object with different velocities at the altitude of 50 km, which is an intermediate transition state. The reentry object at 50 km altitude has the plasma characteristics of both low electron density and high electron density when the velocity is changed. For the application scenario of analyzing the displacement and energy diffusion caused by the coupled velocity of the plasma sheath, 50 km is a typical value.
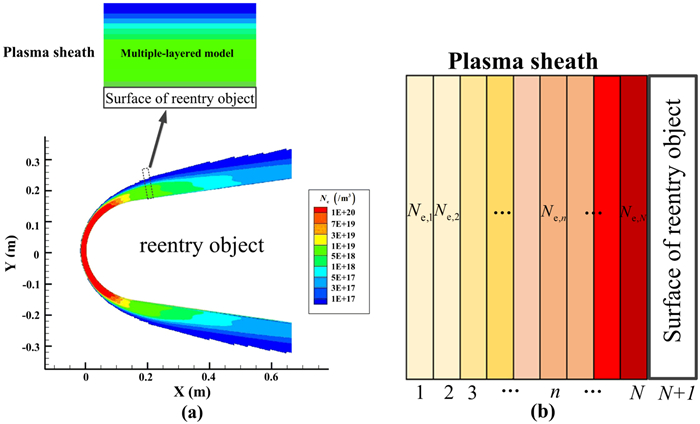
Figure 1(a) shows the electron density distributions of the plasma sheath enveloping the surface of a blunt cone reentry object with 15 Mach velocity and 50 km altitude. It can be seen that the electron density varies by several orders of magnitude at different positions and depths of the plasma sheath, ranging from 1×10¹⁷ to 1×10²⁰m-3. Furthermore, along the surface of the reentry object, the closer to the stagnation point, the higher the electron density. Along the vertical direction of the surface, a higher electron density appears closer to the surface. According to the research of the RAM-C Ⅱ project, a non-uniform plasma sheath can be generally stratified into a model of evenly distributed plasma with multiple layers, and the multiple-layered model of plasma has been adopted in several related studies [12, 13, 20]. Figure 1(b) is a schematic diagram showing the uniform plasma sheath with N layers at the local part of the spacecraft surface.
Figure
1.
Electron density distribution (a) and stratification model (b) of the plasma sheath.
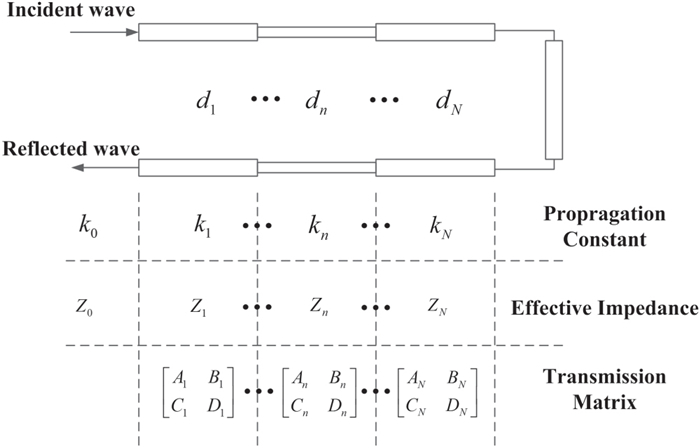
The propagation characteristics of EM waves in the plasma sheath are similar to those of EM waves in a lossy microwave transmission line, and can be written as a cascade of impedance of different characteristic waves. The reflection coefficient of the stratified plasma sheath can be calculated by the transmission line method (TLM) [21, 22]. A schematic diagram of the TLM is presented in figure 2. With respect to the nth layer plasma, we have
kn=2πf√μ0εn
(1)
Zn=√μ0εn,
(2)
Figure
2.
Schematic diagram of transmission line method.
where kn and Zn are the propagation constant and the effective impedance of the plasma, f is the frequency of the incident wave, μ0 is the vacuum permeability, and εn is the complex permittivity of the nth layer. εn can be expressed as
(3)
where is the unit charge, is the electron mass, is the vacuum permittivity, is the collision frequency correlating with the temperature and pressure of the plasma, and is the electron density of the nth layer.
Supposing that is the incident angle of the nth layer, the transmission matrix of the nth layer plasma sheath can be expressed as
(4)
where is the thickness of the nth layer, and and are the elements of the transmission matrix.
According to the microwave network theory, the total transmission matrix of the plasma sheath can be obtained by successively multiplying the transmission matrix of each layer, which is written as
(5)
Using the elements of the transmission matrix, we can obtain the n layer reflection coefficient of the plasma sheath as follows
(6)
When EM waves penetrate through the plasma sheath, the reflection comes from both the plasma sheath and the reentry object surface. For ease of calculation, we presuppose that the surface is made of metal. Then the reflection coefficient of the plasma-sheath-enveloped surface can be obtained using the following equation:
(7)
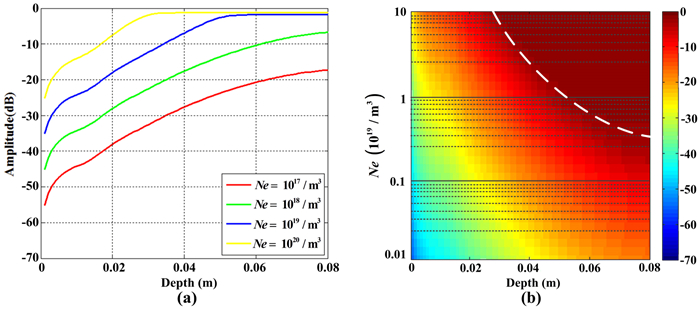
Figure 3(a) shows the amplitude of the reflection coefficient with different depths of plasma sheath when the peak electron densities are and The collision frequency is Hz, which is a typical parameter of the plasma sheath enveloping the reentry object with 15 Mach velocity and 50 km altitude. The frequency of the incident wave is 10 GHz, which is a typical frequency for an ISAR system. It can be observed that for the electron density of and the amplitude of the reflection coefficient has been increased through the whole depth of the plasma sheath. For the other two higher electron densities, the amplitude of the reflection coefficient does not increase and maintains a maximum value when the incident wave reaches critical depth. This critical depth can be considered as the total reflection depth of the radar wave. When the peak electron density continuously varies from to the critical depths of different electron densities form a white line of dashes, which are shown in figure 3(b).
Figure
3.
Amplitude of reflection coefficient with different depths where the peak electron density varies from to
When the frequency of the incident EM waves is lower than the plasma frequency, the EM waves will be attenuated and cannot penetrate through the plasma [13]. Considering that the electron density distribution of the plasma has a double-Gaussian layered structure on the surface of the high-speed target [20], the outer layer electron densities of the plasma are low, so the EM wave can penetrate through them. As the incident depth increases, the inner layer electron densities become higher. When the plasma frequency of the nth layer is greater than the incident wave frequency, the incident depth of the EM wave cannot increase at the position of the nth layer, and the position of the nth layer is the incident depth of the EM wave. When the thickness of the nth layer is low, the actual incident depth can be deeper.
Through analyzing the electron density distribution of the plasma sheath on the surface of a blunt cone reentry object and calculating the reflection coefficient, we conclude that the radar wave cannot penetrate through the high-electron-density area of the plasma sheath and can be totally reflected at a certain depth. For areas with low electron density, the radar wave can penetrate through the plasma sheath and be reflected by the surface of the reentry object.
3.
Echo model of plasma sheath and mechanism of ISAR defocus
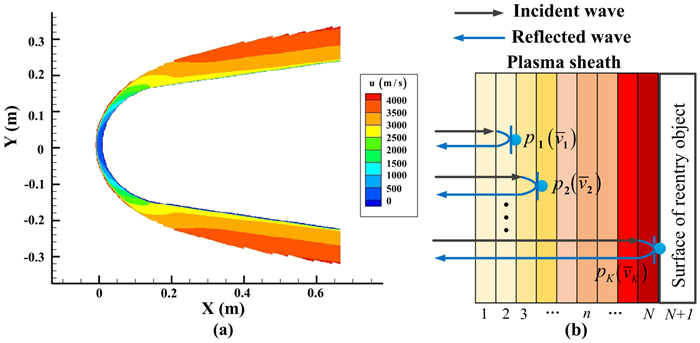
Under the influence of the viscous resistance of the air and reentry object surface, the flow field of plasma has relative flow with the surface. The flow field at different depths has different flow velocities, and the velocity exhibits the characteristics of spatial three-dimensional gradient distribution, where the different colors shown in figure 4(a) denote the relative velocity between the plasma sheath and the blunt cone reentry object with 15 Mach velocity and 50 km altitude. The closer to the surface of the reentry object, the lower the relative velocity.
Figure
4.
Relative velocity distribution and schematic diagram of the coupled velocities of scattering points.
Supposing the relative velocity of the kth scattering point at a certain depth in the plasma sheath is and the moving velocity of the reentry object is then the moving velocity of the kth scattering point can be written as
(8)
where denotes the coupled velocity of the kth scattering point. For the scattering points on the reentry object surface, their relative velocities are zero.
Figure 4(b) shows a schematic diagram of the coupled velocities of the scattering points. It can be found that the radar waves can be reflected at different depths of the plasma sheath on different areas of the object surface. Therefore, the coupled velocities of the scattering points with different depths differ accordingly. The scattering points in the plasma sheath are denoted as The velocities of these scattering points at different positions and depths are denoted as
In an ISAR system, the most commonly used signal type is linear frequency modulation (LFM). A traditional ISAR echo can be expressed as
(9)
where K is the number of scattering points, is the pulse width, is the carrier frequency, is the echo delay of the mth pulse for the kth scattering point, is the time in one pulse period ( is referred to as fast-time), is the chirp rate and and is the bandwidth.
By performing Fourier transform with respect to the fast-time in equation (9), we obtain
(10)
The traditionally matched filter function can be expressed as
(11)
Then, by conducting pulse compression on equation (10) we obtain the result, which is expressed as
(12)
By inversely performing Fourier transform, the one-dimensional range profile in the time domain can be expressed as
(13)
In equation (13), represents the center of the sinc function, which is a peak in the one-dimensional range profile. It is the kth scattering point position on the range dimension of the ISAR image.
For a plasma-sheath-enveloped reentry object, the plasma sheath will cause amplitude attenuation and phase shift of the echo, and the coupled velocities of the scattering points will change the echo delay. Supposing that the object is moving away from the radar, equation (9) can be rewritten as
(14)
where is the coupled velocity of the kth scattering point in the plasma sheath, is the speed of light, the symbol denotes convolution operation, and and are the amplitude attenuation and phase shift caused by the plasma sheath, respectively. In one pulse duration, the plasma sheath can be considered to be in its steady state. and can be approximately considered as constant in the fast-time domain.
By performing Fourier transform, we obtain
(15)
where
Then, by traditionally matched filtering using equation (11), the result can be obtained as
(16)
After performing inverse Fourier transform, the one-dimensional range profile of the plasma sheath echoes can be expressed as
(17)
Equation (17) can be regarded as a spectrum of the LFM signal whose chirp rate term is and carrier frequency term is Comparing with equation (13), the delay of the kth scattering point is changed from to in the one-dimensional range profile, resulting in displacement. Meanwhile, the kth scattering point is no longer a peak in the one-dimensional range profile, but a spectrum with the width of resulting in energy diffusion. Thus, we can obtain relative displacement in the one-dimensional range profile by using the following expression:
(18)
By substituting into equation (18), we obtain
(19)
It can be seen that the displacement of the scattering point in the one-dimensional range profile is positively correlated with the coupled velocity the carrier frequency and the pulse width and is negatively correlated with the bandwidth and the actual delay
According to the width of the LFM spectrum in equation (17), we can obtain the relative energy diffusion in the one-dimensional range profile by using the following expression:
(20)
By substituting into equation (20), we obtain
(21)
It can be seen that the energy diffusion of the scattering point in the one-dimensional range profile is correlated with the coupled velocity and the pulse width
4.
Compensation method in range dimension
The coupled velocity of the scattering points is the main cause of pulse compression mismatching. Because of the coupled velocity, the linear term is changed and the quadratic term in the pulse compression result cannot be eliminated in equation (17) when processing the matched filtering, which further causes displacement and energy diffusion in the range dimension of the ISAR image. Therefore, it is necessary to reconstruct a modified matched filter to correct the linear term and to eliminate the quadratic term. The modified matched filter can be expressed as
(22)
Then, by conducting pulse compression to equation (15) using the modified matched filter, we obtain
(23)
After performing inverse Fourier transform, the one-dimensional range profile of the plasma sheath echoes processed can be expressed as
(24)
It can be seen from equation (24) that the center of sinc function is corrected to and the LFM spectrum is eliminated. The displacement and energy diffusion in the one-dimensional range profile can be effectively reduced and eliminated.
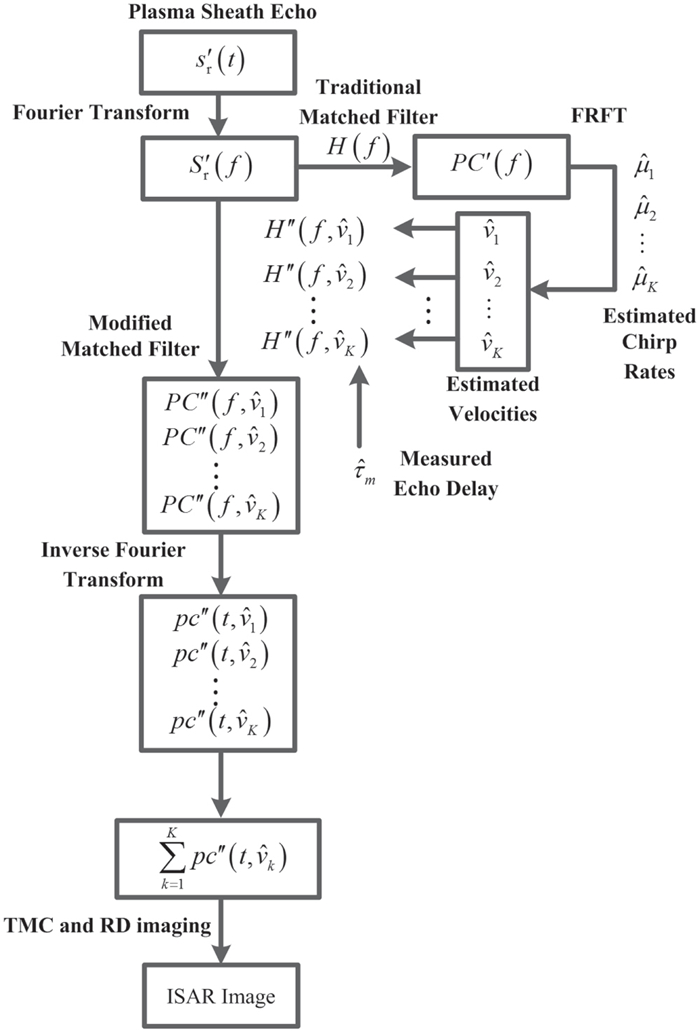
In order to reconstruct the modified matched filter, the echo delay and the coupled velocity should be obtained. We can measure the mth echo delay from the object to radar by the narrowband radar as the estimated value of which is a widely used method. Fractional Fourier transform (FRFT) is an effective solution for the detection and parameter estimation of LFM signals [23]. We perform FRFT to estimate the chirp rate of equation (16) and calculate the estimated coupled velocity inversely. The calculation method is presented as follows:
(25)
where is the estimated chirp rate and is the estimated coupled velocity.
Since the scattering points in the plasma sheath have different coupled velocities, every single coupled velocity of the scattering points must be estimated. The compensation method performs ISAR imaging of the plasma sheath, to which the specific process is outlined as follows.
Step 1. Conduct pulse compression on the echo of the plasma sheath using the traditionally matched filtering method to obtain the result that is mismatched and contains the LFM modulation.
Step 2. Measure the echo delay by the narrowband radar. Perform FRFT to estimate the chirp rate in equation (16) and calculate the coupled velocity inversely. Considering the different coupled velocities of multiple scattering points in the pulse compression result, we can obtain a series of estimated chirp rates and calculate a set of estimated velocities inversely.
Step 3. Reconstruct a series of modified matched filters with the estimated coupled velocities and perform pulse compression on the echo of the plasma sheath sequentially. By using the modified matched filtering method, the displacement and energy diffusion of the scattering points matching the estimated velocities are corrected.
Step 4. Perform FRFT with respect to the pulse compression data to obtain the result in the frequency domain, from which the rotation angle and the frequency-domain data corresponding to the maximum peak are extracted. Obtain the coupling velocity of the strongest scattering point by its linear frequency modulation. The one-dimensional range profile of the strongest scattering point in the time domain can be filtered by inverse FRFT transform. In this way, every scattering point can be filtered, and the compensated one-dimensional range profile can be obtained respectively. Then translational motion compensation (TMC) is used to realize envelope alignment and phase focus [24], and we can obtain the focused ISAR image by using the range-Doppler (RD) imaging algorithm [25, 26].
The flowchart of the compensation method is shown in figure 5.
In order to evaluate the improvement effect of our proposed method, we simulate the displacement and energy diffusion in the one-dimensional range profile using both the traditionally matched filtering and the modified matched filtering methods. Using the CFD's flow-field simulation data of the RAM-C Ⅱ, we simulate the defocus phenomenon and the results of the compensation method in the one-dimensional range profile and in the two-dimensional ISAR image, respectively. The effectiveness of the proposed method is verified by the peak signal-to-noise ratio (PSNR) and structural simulation index method (SSIM).
5.1
Simulation results of displacement and energy diffusion at different velocities
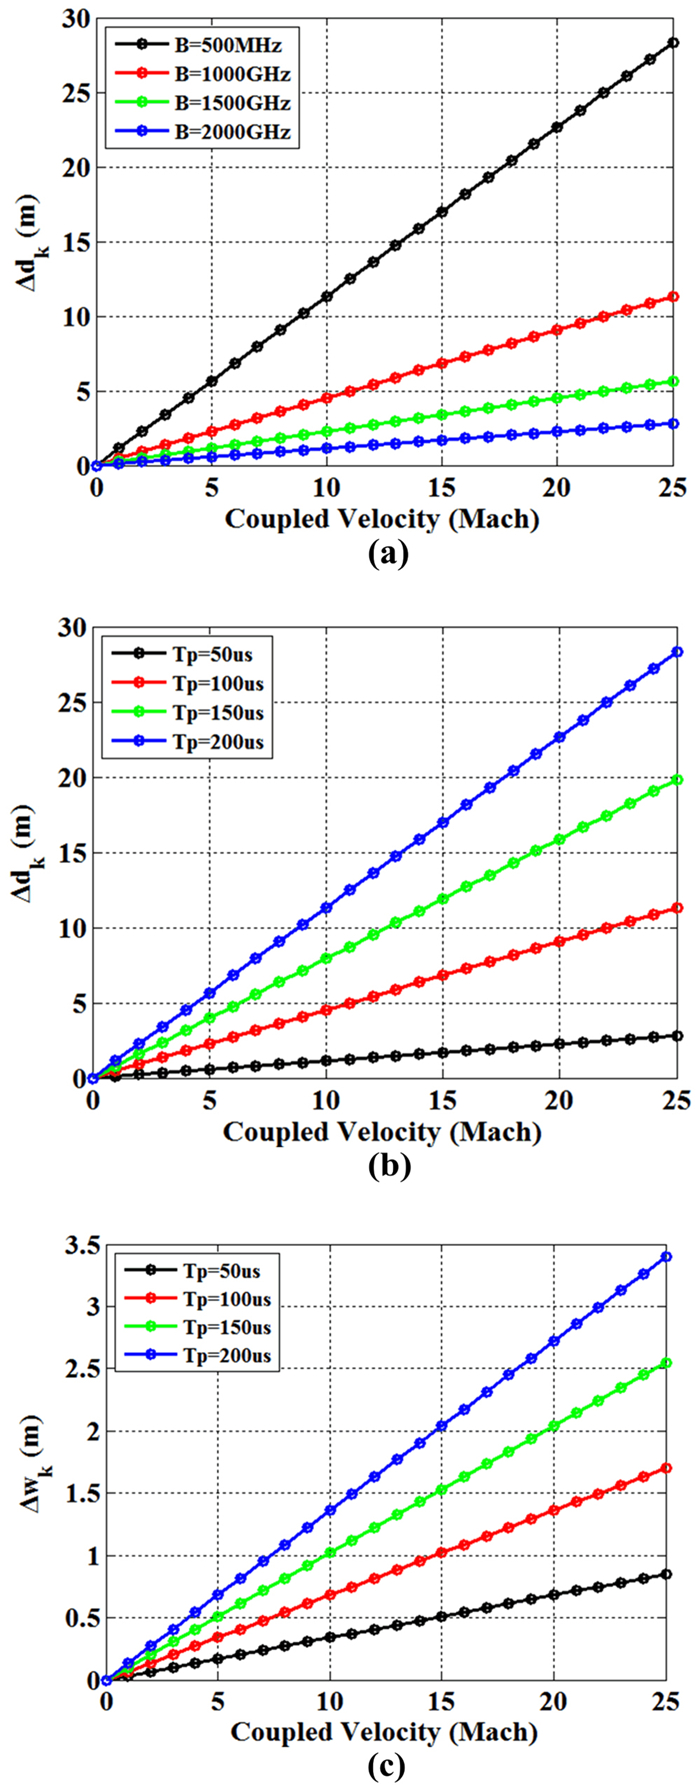
In general, the velocity of the reentry object ranges from 10 to 30 Mach. Considering the relative velocity between the plasma sheath and the reentry object, the coupled velocity of the plasma sheath is less than or equal to that of the reentry object. Supposing that the altitude of the object is 50 km, the carrier frequency is 10 GHz, and the velocity of reentry object is 25 Mach, the displacement and energy diffusion with different bandwidths and pulse widths can be calculated by equations (19) and (21). The results are shown in figure 6. The increase in bandwidth will weaken the displacement in range dimension, and the increase in pulse width will exacerbate the displacement and energy diffusion.
Figure
6.
Displacement and energy diffusion with different bandwidths and pulse widths.
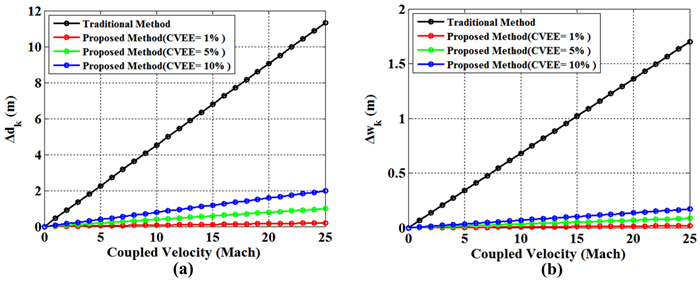
In order to simulate the effect of our proposed method, the pulse width is set at 100 μs and the bandwidth is set at 1 GHz, which are the typical parameters for an ISAR system. We calculate the displacement and energy diffusion at different coupled velocities using both the traditional and the modified pulse compression processing methods. The simulation results are shown in figure 7. We select three coupled velocity estimation errors (CVEEs), which are 1%, 5% and 10%, respectively, to calculate the improvement under different conditions. The error of estimated echo delay has been considered. Figure 7(a) shows the displacement caused by the coupled velocity. The higher the coupled velocity, the greater the displacement. The proposed method significantly reduces the displacement in the one-dimensional range profile, outperforming the effect of the traditional method. The increase in CVEE slightly enlarges the displacement. In figure 7(b), the proposed method almost eliminates the effect of energy diffusion, whereas the result of the traditional method exhibits apparent energy diffusion. The deterioration caused by CVEE does not exceed the resolution cell.
Figure
7.
Displacement and energy diffusion at different coupled velocities using the traditional and the proposed method.
The displacement and energy diffusion of the scattering point in the range dimension caused by the plasma sheath can be calculated using equations (19) and (21). We can obtain the range resolution by the bandwidth. Combining with the analysis results in figure 7, the correction error caused by CVEE can be obtained, which are converted to the number of range cells. For a 15 Mach target, the displacement number is one range cell. For a 20 Mach target, the displacement is two range cells, and for a 25 Mach target, it is six range cells. The energy diffusion is less than one range cell for these three different velocities.
5.2
Simulation results of the compensation method for one-dimensional range profile
We select three scattering points with typical coupled velocities to conduct the simulation and to verify the effectiveness of our proposed compensation method. The distance between the scattering points in range dimension is 2.5 m. The modulation type of the radar signal is LFM. The pulse width is 100 μs, the bandwidth is 1 GHz, and the signal-to-noise ratio (SNR) of the echo is -15 dB. Figure 8 shows the one-dimensional range profiles of three scattering points, which are obtained using the traditional method and the compensation method, respectively. The black line in figure 8 represents the reference one-dimensional range profile of the three scattering points without considering the plasma. The blue line represents the one-dimensional range profile of the three scattering points in plasma. The coupled velocities of the three scattering points are set as 5, 15 and 25 Mach, respectively, which are within the velocity range of the reentry object [5]. Figure 8(a) demonstrates the result obtained using the traditional method, which is calculated using equation (17). The three scattering points have the problem of displacement and energy diffusion in the one-dimensional range profile, to which higher coupled velocity implies greater displacement and diffusion. Figures 8(b)–(d) represent the results using the compensation method with the three estimated velocities. It can be observed that each estimated velocity can compensate for the scattering points of the corresponding velocity to the reference position after eliminating its energy diffusion. Figure 8(e) shows the filtered and merged results of the focused scattering points, in which the displacement and energy diffusion of these scattering points are corrected. Figures 8(e) and (f) show the focused results when the SNR is -20 dB and -25 dB. It can be found that our compensation method performs well in low-SNR scenarios.
Figure
8.
One-dimensional range profiles of three scattering points corrected using the compensation method.
5.3
Simulation results of the compensation method for ISAR imaging
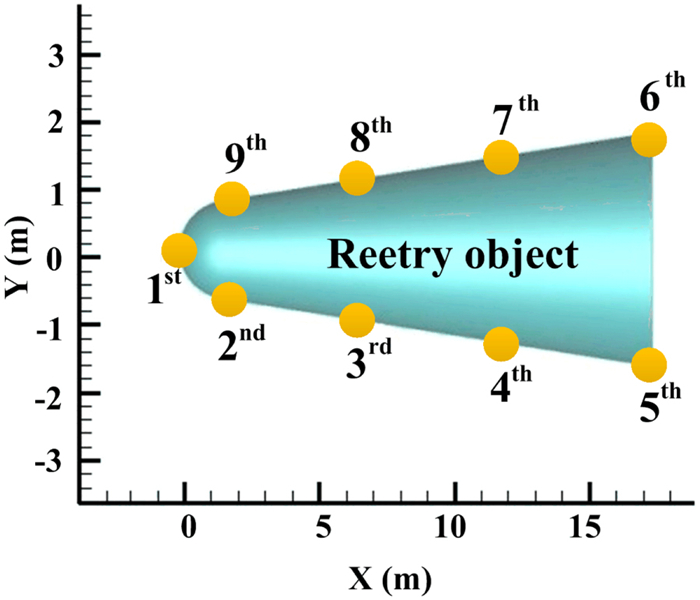
In this subsection, we analyze the simulation results of ISAR imaging, which are obtained using the compensation method. The pulse repetition frequency is 1 kHz and the SNR of the echo is -20 dB. We select nine regions on the surface of the blunt cone model from the CFD's flow-field simulation data from RAM-C Ⅱ, which is shown in figure 9. These nine regions include the stagnation point, the middle part and the tail of the reentry object.
Figure
9.
Schematic diagram of the reentry object.
We simulate the flight state of the reentry object in three typical scenarios, in which the velocities of the object are set as 15, 20 and 25 Mach, respectively. The flight altitude is set as 50 km and the observing angle of the radar is 15°. The amplitude and the phase shift caused by the plasma can be calculated by equations (6) and (7). The peak electron density the coupled velocity and other parameters originate from the CFD flow-field simulation data of RAM-C Ⅱ [18, 19]. According to the amplitudes of the reflection coefficient at different depths, the depth of the scattering point can be obtained by finding the position of maximum amplitude along the thickness direction. The plasma flow-field data covering the nine regions of the surface are listed in tables 1–3, respectively. The fluctuation range of electron density is usually several orders of magnitude, and the variation range is much greater than the collision frequency. Although both the electron density and collision frequency are closely correlated with the plasma characteristics, the characteristic difference caused by the wider variation range of electron density is much greater than that caused by the collision frequency. The use of fixed collision frequency does not affect the final analysis results. For ease of calculation, we adopt a fixed collision frequency of 1 GHz as the parameter of plasma.
Table
1.
Parameters of plasma sheath covering the nine regions with velocity of 15 Mach.
As can be seen from the data in the tables, when the velocities of the reentry object are 15 and 20 Mach, the electron density at the tail of the object is lower, and the radar wave can penetrate through the plasma sheath. The scattering points of these regions are distributed on the surface of the object, and their coupled velocities are identical to the velocity of the reentry object, as shown by the 4th to 7th regions in table 1 and by the 5th to 6th regions in table 2.
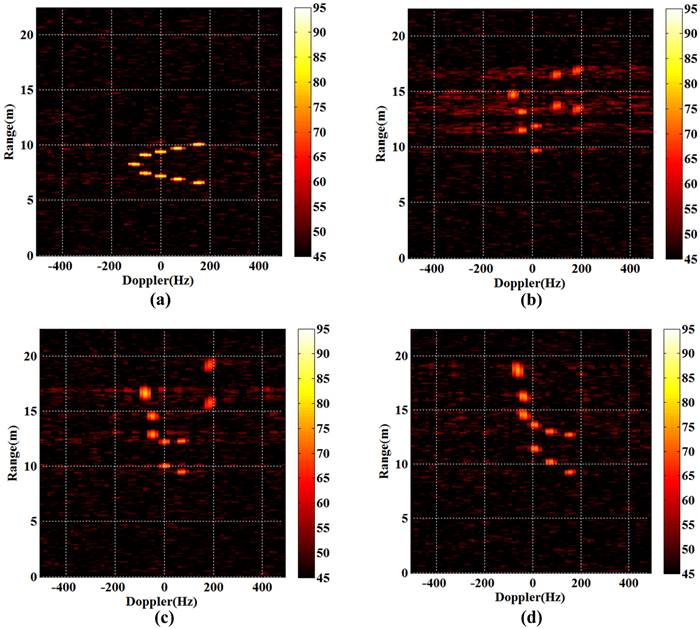
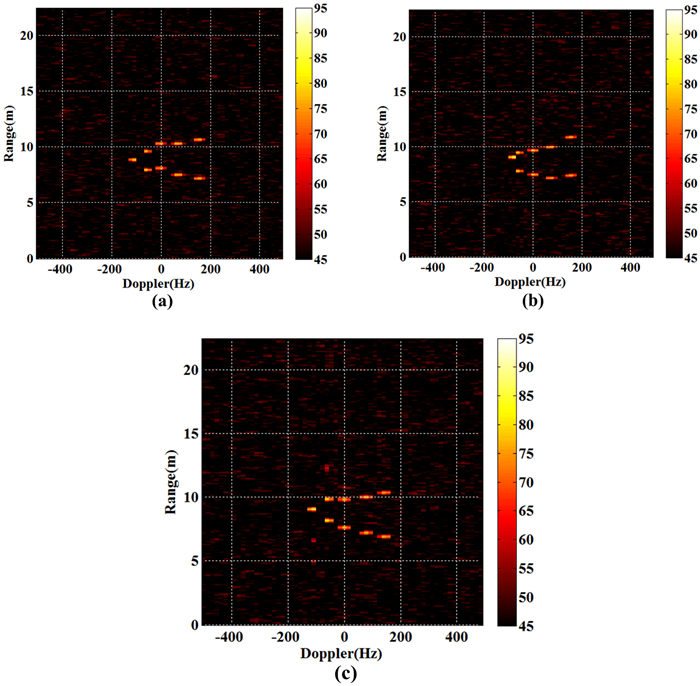
Figure 10(a) shows the normal ISAR image of the reentry object as the reference image. Figures 10(b)–(d) are the ISAR images of the plasma-sheath-enveloped reentry object with the velocities of 15, 20 and 25 Mach, respectively, which are obtained using the traditional processing methods. The radar wave penetrates through the plasma sheath at the tail of the object with velocities of 15 and 20 Mach. Therefore, the most serious displacement occurs at the tail of the object due to the maximum coupled velocity, as shown in figures 10(b) and (c). Meanwhile, for the regions where EM waves cannot penetrate, the displacement of scattering points is weak, because their coupled velocities are lower than the velocity of the reentry object. This suggests that the higher the coupled velocity, the more serious the displacement.
Figure
10.
The obtained ISAR images of the reentry object by traditional method.
Figures 11(a)–(c) show the results of ISAR images processed by the compensation method with the velocities of 15, 20 and 25 Mach, respectively. The problems of displacement and energy diffusion of the scattering points are effectively corrected. The compensation of displacement corrects the image distortion, and the energy focusing improves the SNR. The ISAR images of the reentry object at the three velocities are well focused.
Figure
11.
ISAR images of reentry object processed by the compensation method.
In order to evaluate the improvement on ISAR imaging, the PSNR and the SSIM [27] are used to represent the improvement effect of the proposed method. The values of PSNR and the SSIM results are listed in table 5, suggesting that the quality of ISAR imaging is significantly improved.
Table
5.
Evaluation results of ISAR image using traditional method and proposed method.
With respect to plasma-sheath-enveloped reentry objects, this paper analyzes the scattering characteristics and the coupled velocities of the scattering points in the plasma sheath, from which the radar echo model of the plasma sheath is obtained. The coupled velocity will introduce LFM into pulse compression results, causing the displacement and energy diffusion, which further results in ISAR image defocus in the range dimension. By estimating the LFM parameters using FRFT, we can calculate the coupled velocity of the scattering points inversely. Based on the estimated coupled velocities, we propose a compensation method by reconstructing a modified matched filter to correct the displacement and energy diffusion in the one-dimensional range profile. The simulation results have validated the effectiveness of our proposed method, laying the theoretical foundation for the ISAR imaging of plasma-sheath-covered reentry objects.
Although this work analyzes the influence of the plasma sheath in the range dimension of ISAR images, the influence of the azimuth dimension is not considered. This will be the focus of our future research.
Acknowledgments
This work was supported by National Natural Science Foundation of China (No. 61971330).
Feng T A, He J and Luo Y 2009 ISAR imaging of high speed moving targets based-on radon transform 2009 Fifth Int. Conf. on Information Assurance and Security (Xi'an) (IEEE) 597
[10]
Tian B et al 2013 ISAR imaging compensation of high speed targets based on integrated cubic phase function Proc. of SPIE 8917, MIPPR 2013: Multispectral Image Acquisition, Processing, and Analysis (Wuhan) (SPIE) 89170B
[11]
Yuan C X, Zhou Z X and Sun H G 2010 IEEE Trans. Plasma Sci.38 3348 doi: 10.1109/TPS.2010.2084110
Farbar E et al 2011 Investigation of the effects of electron translational nonequilibrium on numerical predictions of hypersonic flow fields 42nd AIAA Thermophysics Conf. (Honolulu) (AIAA) 3136
[18]
Shao C et al 2016 J. Spacecr. Rockets53 900 doi: 10.2514/1.A33525
[19]
Chen W F and Zhao W W 2017 Rarefied Gas Dynamic Moment Method and Numerical Simulation (Beijing: Science Press) (in Chinese)
Liu Z and Zhang S H 2000 A novel method of translational motion compensation for hopped-frequency ISAR imaging Record of the IEEE 2000 Int. Radar Conf. (Alexandria: IEEE) 255
[25]
Chen C C and Andrews H C 1980 IEEE Trans. Aerosp. Electron. Syst.AES-16 2 doi: 10.1109/TAES.1980.308873

 DownLoad: