A multi-channel polarimeter–interferometer has been developed on the Keda Torus eXperiment (KTX) for the study of equilibrium dynamics and internal magnetic fluctuations. A three-wave technique based on terahertz solid-state sources (~650 GHz) is applied for simultaneous measurements of electron density and Faraday rotation angle. The output power of the microwave source is 2 mW. Faraday rotation effect using a rotating wave plate is tested with phase noise less than 0.8°, and the density phase noise is less than 0.9°. Measurement of Faraday rotation angle and density for discharges on KTX have demonstrated high sensitivity to internal MHD activities.
Density is one of the most important parameters in evaluating magnetic confinement fusion power output, and is closely related with the safe operation of a future fusion reactor, since high density approaching the Greenwald limit may trigger major disruption [1]. Magnetic field is another important parameter, because confinement of hot plasma mainly relies on the constraining force of the magnetic field generated by external current and plasma current itself, and stability of the fusion system is also strongly affected by magnetic field perturbation. Instabilities related with magnetic fluctuation may play an important role in the performance of plasma confinement. Measurements of density, magnetic field distribution, and fluctuation [2] are required to understand plasma instabilities for confinement improvement and safe operation of toroidal confinement fusion devices [3], which makes a direct, non-perturbing probe technique for these internal parameters with high accuracy and temporal resolution critical in magnetic confinement fusion research.
Faraday-effect polarimetry diagnostic using laser beams has been successfully applied in electron density and magnetic field measurement on many toroidal confinement devices, including tokamaks [4, 5] and reversed field pinches [6, 7]. With the development of magnetic confinement experimental devices towards fusion reactors [8], more and more requirements are put forward from a practical standpoint. For example, the plasma diagnostic system developed for ITER [9] with high reliability, stability, easy maintainability, and economy should be satisfied. Solid-state source-based systems possess unique advantage due to compact size [10], flexible frequency modulation, and easy maintenance. Following on our previous work on a multi-channel interferometer using two terahertz microwave sources [11], the system is upgraded to a three-wave Faraday-effect polarimeter–interferometer for simultaneous measurement of electron density and vertical magnetic field along the beam direction in the Keda Torus eXperiment (KTX) [12].
In this paper, we report the development of a three channel polarimeter–interferometer system with compact size as part of a successive work to explore the feasibility of terahertz solid-state sources for such diagnostics on a fusion device. The design and working principle of the polarization interferometer and bench test results with low phase-noise level are described in section 2, and preliminary experimental measurements of fluctuation related to magnetohydrodynamic (MHD) activities on KTX are shown in section 3.
2.
System design and setup
Three-wave configuration [13] for Faraday effect measurement is used for the polarimeter–interferometer system on KTX. Two collinear righthand (R) and lefthand (L) circularly polarized light beams through the plasma area are phase modulated for different refractive indices due to Faraday effect. Another linearly polarized light beam serves as local oscillator (LO) to form a heterodyne system [14]. Frequencies of the three beams are slightly offset (~1 MHz) by each other and received by a single detector, which is a Schottky diode serving as a mixer. There are three intermediate frequencies (IFs) in the output signal of the mixer, where two IFs are from frequency mixing between R/L circularly polarized beams and the LO beam. The remaining IF is between R and L circularly polarized beams, which are not used here. R beam phase change φR and L beam phase change φL related to plasma can be evaluated from the two IF components. Magnetic field along the beam path can be deduced from the polarizing angle change ψF of the combined circularly beams, and plasma density is provided by the phase change φn at the same time. The density phase and Faraday effect phase can be expressed by equations (1) and (2) as follows:
φn=12(φR+φL)=2.82×10⁻¹⁵λ∫nedl,
(1)
ψF=12(φR−φL)=2.62×10⁻¹³λ2∫neB∥dl.
(2)
KTX is a middle-size reversed field pinch machine with major radius R = 1.4 m and minor radius r = 0.4 m [15]. The size of the diagnostic window is under restrictions, because eddy current flow in the shell is essential and important to suppressing fast magnetohydrodynamic instabilities such as tearing modes. Air core magnet coils surround the vacuum vessel, which makes the diagnostic accessibility limited and the electromagnetic environment complicated. The mechanical design and installation of the polarimeter–interferometer are similar to previous multi-channel interferometers with electromagnetic force-induced vibration eliminated [16]. The entire system is mounted on a custom optical board with a height of 2.5 m, radial width of 3 m, and thickness of 3 cm. It is installed vertically between two independent support pillars located adjacent to the vacuum vessel of KTX. The optical layout of the system is shown in figure 1(a), with three vertical probing channels passing through the cross-section of the KTX plasma ring. One channel goes across the center of the vacuum vessel, and the other two are deviated by 60 mm in the direction of major radius on both sides, as shown in figure 1(b).
Figure
1.
(a) Optical design of KTX polarimeter–interferometer. (b) Window positions on vacuum chamber for the system.
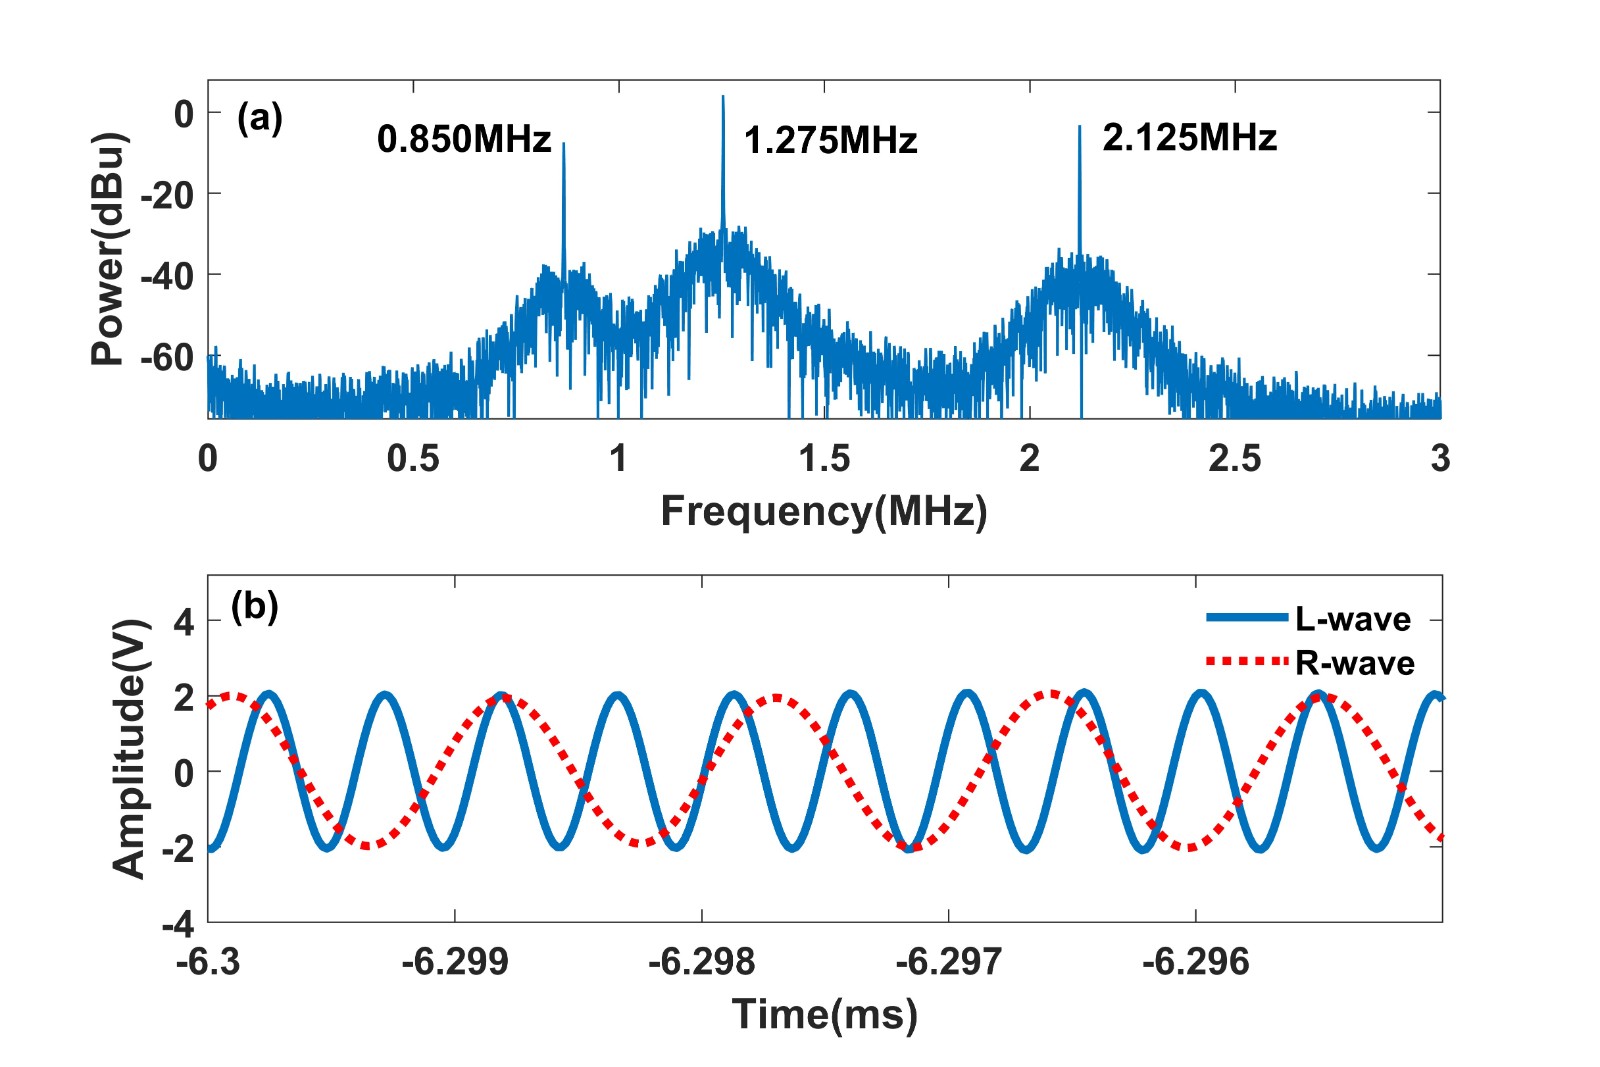
Frequencies of the diagnostic beam sources in figure 1(a) are set as ω1=650.00085 GHz and ω2= 650.002125 GHz respectively, and the LO frequency is 650 GHz. Polarization direction of the beams from the microwave sources is perpendicular to the optical board. The polarization direction of beam 1 is rotated by 90° after going across the half-wave plate. Beam 1 and Beam 2 are combined and aligned collinearly by a polarizer, and turned into righthand and lefthand circularly polarized lights, respectively, by a quarter-wave plate. After the quarter-wave plate, the combined beams are separated by a mesh beam-splitter; one part serves as reference beams, and the other part serves as diagnostic beams after being split by “H-L”, as shown in figure 1(a), to go across windows at different toroidal positions as shown in figure 1(b). The reference beams are received by mixer 0, and the three diagnostic beams are received by the other mixers after combined with LO beam. Teflon lenses are applied at designed positions to guarantee proper beam size and Rayleigh length across the plasma area. The spectrum of the output signal from the mixer is shown in figure 2(a), where three IFs (0.850, 2.125 and 1.275 MHz) are indicated together. 0.850 MHz is the mixing of R-wave and LO beam, and 2.125 MHz is the mixing of L-wave and LO beam. After bandpass filtering of each IF, original waveforms of the R-wave and L-wave phases can be achieved by digital phase demodulator or by digital computation after data acquisition, as shown in figure 2(b). Finally, the density phase and Faraday effect phase can be calculated using equations (1) and (2), respectively. The density phase noise is 0.9°, corresponding to line-integrated density lower than 1.3×10¹⁶m−2. The optimized Faraday effect phase noise is 0.8° after calibration.
Figure
2.
(a) Spectrum from mixer 0 receiving three beams with different frequencies. (b) Filtered IF waveform of chord 2. The solid blue line represents the R-wave at 2.125 MHz and the dotted red line represents the L-wave at 0.850 MHz.
The Faraday rotation angle signal has high requirements for the collinearity degree of the two probe beams and circular polarization purity of the lights, since those critical factors relate directly to the phase measurements [17]. To collimate the light paths, a visible beam (He–Ne laser) is used to align with the 650 GHz light from the sources first. The rear paths are adjusted with the laser beams and then calibrated by aligning light spots using far infrared camera after replacing laser beams with solid-state sources. A half-wave plate is placed at the position of vacuum vessel center to simulate Faraday effect in real magnetized plasma, and the output signal is monitored. The half-wave plate is fixed on a mirror mount, which can be driven rotating at fixed frequency ω. The phase of incident light is phase modulated by frequency 2ω, so the difference between the righthand and lefthand circularly polarized lights phase is modulated by frequency 4ω with opposite polarized direction. When the two beams of light are not circularly polarized, for example elliptically polarized, the phase difference is nonlinearly related with polarization direction change, which can be observed from the waveform of IF phase changing with the rotating half-wave plate as shown in figure 3. The cycle of the rotating plate is about 60 s. Figure 3(a) shows the case after rough collinearity of the probe beams, where the phase noise is large and the nonlinear effect is strong. After improved light path alignment with the camera and lasers, the signal to noise ratio becomes better, as shown in figure 3(b). The incidence angles of the beam on the quarter-wave and half-wave plates are finetuned by adjusting the angle between the crystal axes and the light polarization direction. Satisfactory circular polarization is obtained as shown in figure 3(c), where the separation between the two probe beams is less than 1 mm along the maximum length of the light path.
Figure
3.
(a) Change of phase difference with polarization direction after coarse adjustment. (b) The collinearity of the two beams has been improved by fine tuning. (c) The optimized circular polarization state is obtained, and the red dotted line is the ideal circular polarization signal.
The system was installed on KTX, and its performance for simultaneous measurements of density and magnetic field evaluated in low-current discharges to test its sensitivity and stability. As mentioned before, three diagnostic channels go across vertically at major radius R = 0 cm, R = −6 cm, and R = 6 cm. Figure 4 shows the three chord signals of integrated electron density and Faraday rotation angle. The maximum plasma current is 32.6 kA, and the discharge time is 40 ms. The interferometer signal shows that the maximum electron density approaches 4.2×10¹⁸m−2 at R = 6 cm, indicating that the center of the plasma has shifted outward. One of the Faraday rotation angle signals is shown in figure 4(a), where the signal approaches 0, and it indicates that the position R = 6 cm is close to the magnetic axis. By calculating the data from the edge toroidal magnetic probes, the outward displacement of the plasma can be estimated to be approximately 5–8 cm. This indicates that the magnetic axis is probably located near R = 6 cm.
Figure
4.
(a) One Faraday rotation angle signal at R = 6 cm, and (b) three chord signals of integrated electron density in plasma discharge No. 230480.
Apart from this, the system shows sensitive response to the density and magnetic fluctuations. The fluctuations of different signals in the same discharge No. 230480 are shown in figures 5 and 6, including edge toroidal magnetic fluctuation (dBtdt) from Mirnov probe in figure 5(a), one chord density fluctuation from the interferometer in figure 5(b), and one chord filtered density and Faraday rotation angle signal in figure 5(c).
Figure
5.
(a) Edge toroidal magnetic probe fluctuation signal after filtering. (b) Integrated electron density waveform. (c) Signals of density and Faraday rotation angle after filtering out frequencies above 10 kHz at R = 6 cm in plasma discharge No. 230480.
It is shown from the edge probe that two large oscillations arise at about 7 and 22 ms, and fluctuations about 2 and 3 kHz appear in the spectrum of Faraday rotation angle signal. These modes show different phase characteristics for density and Faraday rotation angle, which is reasonable. In a linear MHD model, because of convection, the density fluctuation phase is π/2 away from the magnetic fluctuation. The mode numbers of the helical perturbations are m/n = 2/1 and 3/2 as shown in figure 6(c) (m is for poloidal and n is for toroidal), which is presumably a resistive tearing mode. The same fluctuations can also be observed in the density spectrogram in figure 6(b), which is not obviously shown in the spectrogram of edge magnetic probe signal in figure 6(a). This is probably an internal mode with resonant surface in the core area, which indicates the capability of the system for core fluctuation measurement.
Figure
6.
Spectrograms of (a) edge toroidal magnetic probe signal, (b) electron density at R = 6 cm, and (c) Faraday effect phase at R = 6 cm in plasma discharge of shot No. 230480.
A polarimeter–interferometer diagnostic using terahertz solid-state sources has been developed on KTX for electron density and magnetic field measurement. Temporal resolution and signal to noise ratio have been verified by bench testing. The collinearity and circular polarization purity have been optimized, showing a linear relationship between Faraday rotation angle and phase difference. The diagnostic system has been installed on KTX for fluctuation measurement, and preliminary results show high sensitivity for internal magnetic field and electron density fluctuation.
Jiang, X., Shi, Y., Song, S. et al. Physics design of current drive and strategy of heating system for EHL-2 spherical torus. Plasma Science and Technology, 2025, 27(2): 024012.
DOI:10.1088/2058-6272/adae71
2.
Huang, Y., Liu, K., Mao, W. et al. Equilibrium reconstruction method for self-organized plasmas on reversed field pinches with polarimeter-interferometer. Plasma Science and Technology, 2024, 26(12): 125104.
DOI:10.1088/2058-6272/ad79b0
1.
Jiang, X., Shi, Y., Song, S. et al. Physics design of current drive and strategy of heating system for EHL-2 spherical torus. Plasma Science and Technology, 2025, 27(2): 024012.
DOI:10.1088/2058-6272/adae71
2.
Huang, Y., Liu, K., Mao, W. et al. Equilibrium reconstruction method for self-organized plasmas on reversed field pinches with polarimeter-interferometer. Plasma Science and Technology, 2024, 26(12): 125104.
DOI:10.1088/2058-6272/ad79b0


 DownLoad: