College of Physical Science and Technology, Dalian University, Dalian 116622, People’s Republic of China
2.
State Key Laboratory of Fine Chemicals, College of Chemical Engineering, Dalian University of Technology, Dalian 116024, People’s Republic of China
3.
State Key Laboratory of Structural Analysis for Industrial Equipment, Dalian University of Technology, Dalian 116024, People’s Republic of China
4.
Key Laboratory of Advanced Technology for Aerospace Vehicles of Liaoning Province, Dalian University of Technology, Dalian 116024, People’s Republic of China
In this work, N-doped graphite oxide (GO-P) was prepared by cold plasma treatment of GO using a mixture of NH3 and Ar as the working gas. When the ratios of NH3: Ar were 1:2, 1:3, and 1:4, the specific capacitances of the GO-P(NH3: Ar = 1:2), GO-P(NH3: Ar = 1:3), and GO-P(NH3: Ar = 1:4) were 124.5, 187.7, and 134.6 F·g-1, respectively, which were 4.7, 7.1, and 5.1 times that of GO at the current density of 1 A·g-1. The capacitance retention of the GO-P(NH3: Ar = 1:3) was 80% when it was cycled 1000 times. The characterization results showed that the NH3 cold plasma could effectively produce N-doped GO and generate more active defects. The N/C ratio and the contents of pyridinic nitrogen and graphitic nitrogen of the GO-P(NH3: Ar = 1:3) were the highest. These were conducive to providing pseudocapacitance and reducing the internal resistance of the electrode. In addition, the ID/IG of the GO-P(NH3: Ar = 1:3) (1.088) was also the highest, indicating the highest number of defects. The results of discharge parameters measurement and in situ optical emission spectroscopy diagnosis of NH3 plasma showed that the discharge is the strongest when the ratio of NH3: Ar was 1:3, thereby the generated nitrogen active species can effectively promote N-doping. The N-doping and abundant defects were the keys to the excellent electrochemical performance of the GO-P(NH3: Ar = 1:3). NH3 cold plasma is a simple and rapid method to prepare N-doped GO and regulate the N-doping to prepare high-performance supercapacitors.
With the rapid consumption of fossil energy and the increase in energy demand, energy and environmental problems have become increasingly prominent. There is demand not only to seek renewable and sustainable alternative energy but also to develop low-cost, green-energy conversion, and storage equipment. Supercapacitors have attracted growing attention due to their fast charge and discharge capabilities, high energy densities, high rate performances, and good cycle lives [1, 2]. Supercapacitors are generally divided into electric double-layer capacitors (EDLC) and pseudocapacitors.
The electrode materials of EDLC are usually carbon materials, such as activated carbon, carbon nanotubes, and graphene. Electrode materials of pseudocapacitors are generally metal oxides and conducting polymers [3]. Activated carbon is widely used in catalysis, energy storage, and other fields because of its large specific surface area and well-developed pores. Chen et al [4] fabricated a fully wood-based supercapacitor by using natural wood-loaded MnO2 (loaded up to 30 mg·cm-2). By using the natural and rich hierarchical porous structure of wood, a high energy density of 1.6 mWh·cm-2 and a maximum power density of 24 W·cm-2 were obtained. Lin et al [5] have directly prepared active carbon materials with high specific surface areas (1771 m2·g-1) and large pore volumes (1.88 cm3·g-1) by a mechanical–chemical method using coconut shell and other agricultural products. These materials were used in the intermediate layer of a lithium sulfur battery, showing good electrochemical performances. Wang et al [6] prepared N-doped activated-carbon-supported Pd materials using activated carbon as a precursor, which showed high activity and high stability in the dehydrogenation of formic acid. Carbon nanotubes (CNTs) are a typical one-dimensional hollow nanostructure, which have high conductivity and chemical stability. Yang et al [7] used concentrated H2SO4, saturated (NH4)2S2O8 and H2SO4/(NH4)2S2O8 mixed oxidants to investigate the oxygen functionalization treatment on activated carbon. The results showed that the increase of the oxygen-containing groups improved the specific capacitance of the electrode materials. Hsu et al [8] prepared CNTs on carbon cloth by chemical deposition and assembled them into symmetric supercapacitors. When a Na2SO4 solution was used as the electrolyte, the specific capacitance reached 210 F·g-1 at a current density of 1 A·g-1. After 10 000 cycles, the capacitance remained at about 190 F·g-1. Compared with activated carbon and carbon nanotubes, graphene has a higher carrier mobility and theoretical specific surface area at room temperature [9], and thus, it is more suitable for the preparation of high-performance supercapacitors. Li et al [10] prepared high-quality mesoporous graphene with unique interconnection structures and high conductivities by using carbon dioxide as the carbon source and self-propagating high-temperature synthesis technology. However, in practical applications, graphene is often stacked and agglomerated due to the strong Van der Waals forces of the π–π bonds between layers, resulting in the significant decline of its specific surface area, diffusion rate, and conductivity [11]. Graphene oxide can be obtained by the oxidation of graphene, which can not only retain the layered structure of graphene but also introduce oxygen-containing functional groups into each graphene layer. These oxygen-containing functional groups can improve the solubility of graphene and its weak composite ability. Graphene oxide is reduced to reduced graphene oxide, which can not only retain the π–π structure of graphene but also increase its conductivity. To meet the performance requirements for special applications, such as energy devices with higher energy storage properties, it is particularly important to improve the performance of graphene. The doping of heteroatoms (e.g. boron, nitrogen, sulfur, and phosphorus) can provide graphene with better conductivity, stability, and chemical reactivity and can also enhance the pseudocapacitance of supercapacitors [12, 13]. Yeom et al [14] treated a mixture of graphene oxide and boron oxide by thermal annealing to obtain graphene with a high B doping content, which showed excellent performances in supercapacitors. Wen et al [15] prepared nitrogen and phosphorus CO-doped graphene with C3H10N6O7P2 as a raw material by a hydrothermal method. When the nitrogen content was 4.27–6.58 at % and the P content was 1.03–3.00 at %, the electrode as a supercapacitor exhibited excellent electrochemical performances. Because the atomic size of the nitrogen atom is similar to that of the carbon atom, it is more easily embedded into the graphene lattice than other doping atoms, and the doping of pyridinic nitrogen, pyrrolic nitrogen, and graphitic nitrogen can be realized, which are considered to provide the best doping effect [16, 17].
Plasma has been widely used in material modification because of its fast, green, and pollution-free characteristics [18]. N-doped graphene has been prepared by plasma technology and used in electrochemistry. Wang et al [19] used dielectric barrier discharge plasma to treat a physically mixed powder of ammonium carbonate and GO. NH3 and CO2 produced by ammonium carbonate decomposition peeled off the GO powder (< four layers), and N-doped graphene was successfully achieved. The prepared samples showed higher initial potentials than that of commercial Pt/C. Wang et al [20] used radiofrequency (RF) plasma to peel GO from graphene, and then used O2, N2, and CH4 plasma to treat the polypyrrole-modified GO. The polypyrrole-modified GO obtained by CH4 plasma showed a high N-doping content, and the specific capacitance was 312 F·g-1 with a 0.1 A·g-1 current density in 6 M KOH electrolyte. Miao et al [21] prepared nitrogen and sulfur co-doped reduced graphene oxide by inductively coupled plasma and hydrothermal methods, respectively. The specific capacitance of the sample prepared by the plasma method was 307.4 F·g-1 in a 6 M KOH electrolyte with a 1 A·g-1 current density, which was much higher than that prepared by a hydrothermal method. After 10 000 cycles at 4 A·g-1, 83% of the capacitance was retained. Sun et al [22] prepared N-doped reduced graphene oxide with a high specific surface area and high pyrrolic nitrogen ratio (92.75%) by RF plasma using urea as a nitrogen source, which showed a high specific capacitance, high rate performance, and good cycling stability in KOH and ionic liquid as the electrolyte.
In this work, N-doped GO (GO-P) was prepared by the cold plasma treatment of GO using a mixture of NH3 and Ar as the working gas. The GO-P with a gas ratio of NH3: Ar = 1:3 showed the highest N-doping content and number of defects. With a 1 A·g-1 current density in a 6 M KOH electrolyte, its specific capacitance was as high as 187.7 F·g-1, which was 7.1 times greater than that of GO (26.4 F·g-1). Furthermore, the GO-P(NH3: Ar = 1:3) exhibited an 80% capacitance retention after 1000 cycles, showing a good cycling performance.
2.
Experimental
2.1
Materials
Graphite oxide (GO) was purchased from Nanjing Xianfeng Nano Material Technology Co., Ltd. The GO is no more than ten layers. Polyvinylidene fluoride (PVDF) and N-methylpyrrolidone (NMP, > 99.0%) were purchased from Aladdin. High purity NH3 (> 99.999%) and Ar (> 99.999%) are provided by Zhonghao Guangming Chemical Research and Design Institute Co., Ltd.
2.2
Preparation of N-doped GO by plasma
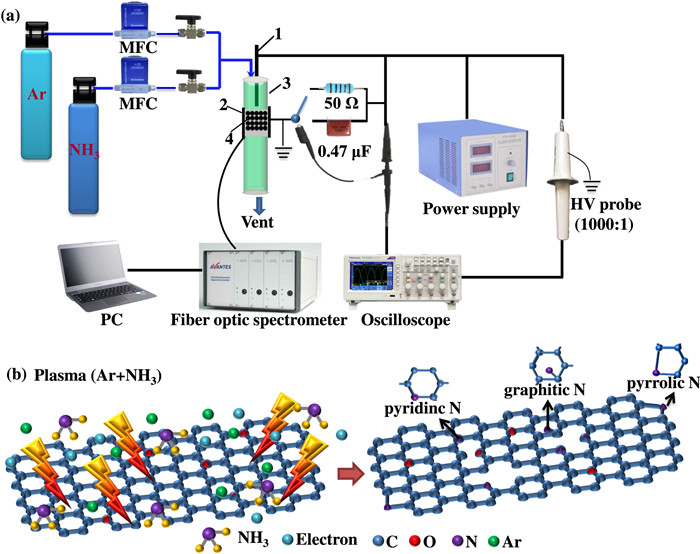
GO was treated by atmospheric-pressure dielectric barrier discharge (DBD) cold plasma with a mixture of NH3 and Ar (total flow rate was 100 ml·min-1) as the working gas to prepare GO-P. The schematic illustration of the plasma system of the NH3 cold plasma for preparing GO-P and the schematic diagram of the preparation process are shown in figure 1. First, 0.1 g of GO-P was prepared in a coaxial DBD reactor for 40 min using a low-temperature plasma power supply (CTP-2000K, Nanjing Suman Plasma Technology Co., Ltd), which could generate sinusoidal high voltages. The discharge voltage and the discharge frequency were kept at 15.60 kV and 11.78 kHz, respectively. The coaxial DBD reactor consisted of a quartz tube (inner diameter of 7 mm, outer diameter of 10 mm), high-voltage electrode, and ground electrode. The copper high-voltage electrode (diameter of 2 mm) was placed in the middle of the quartz tube, which was wrapped with an aluminum foil ground electrode (length of 10 mm). The samples were purged with Ar (flow rate of 100 ml·min-1) at 120 ℃ for 1 h to remove the ammonia physically adsorbed on the surface. According to the NH3/Ar ratio in the working gas, the prepared samples were named GO-P(NH3: Ar = 1:2), GO-P(NH3: Ar = 1:3), and GO-P(NH3: Ar = 1:4).
Figure
1.
(a) The schematic illustration of the plasma system for preparing GO-P (1—discharge electrode, 2—ground electrode, 3—quartz glass, 4—sample) and (b) the schematic diagram of the preparation process.
A mixture of the electrode active material, the binder (polyvinylidene difluoride), and acetylene black with a ratio of 8:1:1 was coated on the foam nickel side with dimensions of 1 cm×1 cm (0.3 mm thickness), after which it was dried for 8 h in a drying box at 80 ℃. The dried electrode was pressed at 4 MPa for 10 s to prepare an electrode sheet. The weight of the active materials was ca. 3 mg.
Electrochemical tests were carried out on an electrochemical workstation (CHI 760E, CH Instruments, China). The characteristics of the electrode double layer were observed by cyclic voltammetry (CV) with three electrodes: Ag/AgCl as the reference electrode, a platinum sheet as the auxiliary electrode, and 6 M KOH as the electrolyte. Galvanostatic charge–discharge (GCD) was used to obtain the specific capacitance of the sample as follows:
C=IΔtmΔV,
(1)
where I is the current density, ∆t is the discharge time, m is the mass of the active substance, and ∆V is the potential difference. Nyquist plots were obtained by electrochemical impedance spectroscopy (EIS) with a 5 mV alternating current (AC) disturbance at frequencies of 0.01–100 kHz.
2.4
Materials characterization
The samples were characterized by x-ray diffraction (XRD) with Dandong Haoyuan DX-2700 in the 2θ range of 5°–85°. The target material was Cu-Kα (λ=0.154 nm), and the voltage and current were 40 kV and 30 mA, respectively. An Escalan250 x-ray photoelectron spectrometer (Thermo VG, Waltham, Ma, USA) equipped with a monochromatic Al target x-ray source (photon energy 1486.6 eV, 150 W) was used to analyze the surface chemical compositions of the samples. The binding energies of all the elements were corrected by the C1s orbital binding energy (284.6 eV). The electrode materials were tested by a Zeiss Sigma 500. Fourier-transform Raman (FT-Raman) spectra were recorded by a Horiba JY LabRAM HR Evolution. Fourier-transform Infrared spectra (FTIR) of the samples were observed using Thermo Scientific Nicolet iS20 spectrometer. Scanning electron microscopy (SEM, Zeiss, Sigma 500) was used to investigate the surface morphologies of the samples under a 5 kV accelerating voltage. The discharge voltage was measured with a Tektronix P6015A high-voltage probe (1000×). The discharge current and transferred charge were measured by connecting a 50 Ω resistor or a 0.4 μF capacitance in series in the circuit, respectively. Lissajous figure method was adopted to calculate the discharge power. An AVS-USB2 four-channel spectrometer from Avantes was used for in situ diagnosis of the plasma treatment process in the range of 200–1000 nm with a 0.15 nm resolution.
3.
Results and discussion
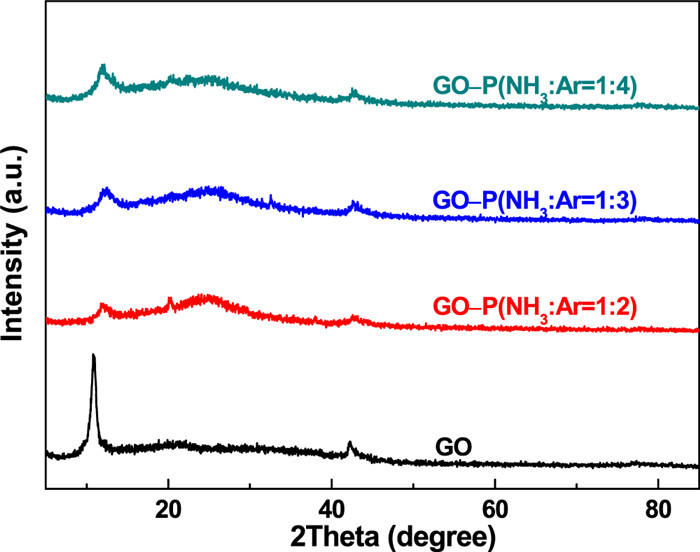
XRD was used to study the structures of the GO samples before and after plasma treatment, and the results are shown in figure 2. The diffraction peak of the GO without plasma treatment appeared at 2θ = 11.02°, corresponding to the (001) crystal plane of GO. This indicated that there were many oxygen-containing functional groups on the GO surface before plasma treatment. After NH3 cold plasma treatment, the GO(001) characteristic peak positions of the GO-P(NH3: Ar = 1:2), GO-P(NH3: Ar = 1:3), and GO-P(NH3: Ar = 1:4) shifted in the high-angle direction, which was attributed to the decrease in the lattice constant caused by N-doping [23]. In addition, the defects caused by the NH3 cold plasma treatment also led to a decrease in the lattice size [24]. The intensities of the diffraction peaks of the GO-P(NH3: Ar = 1:2), GO-P(NH3: Ar = 1:3), and GO-P(NH3: Ar = 1:4) decreased with the change of the NH3: Ar ratio, indicating that some oxygen-containing functional groups on the GO surface were removed during plasma treatment. After plasma treatment, for GO-P(NH3: Ar = 1:2), GO-P(NH3: Ar = 1:3), and GO-P(NH3: Ar = 1:4), a broad diffraction peak appears at around 24.79°, corresponding to the characteristic peak of reduced GO. This indicated that NH3 cold plasma could reduce the GO to some extent.
Figure
2.
X-ray diffraction (XRD) patterns of the GO-P(NH3: Ar = 1:2), GO-P(NH3: Ar = 1:3), GO-P(NH3: Ar = 1:4), and GO.
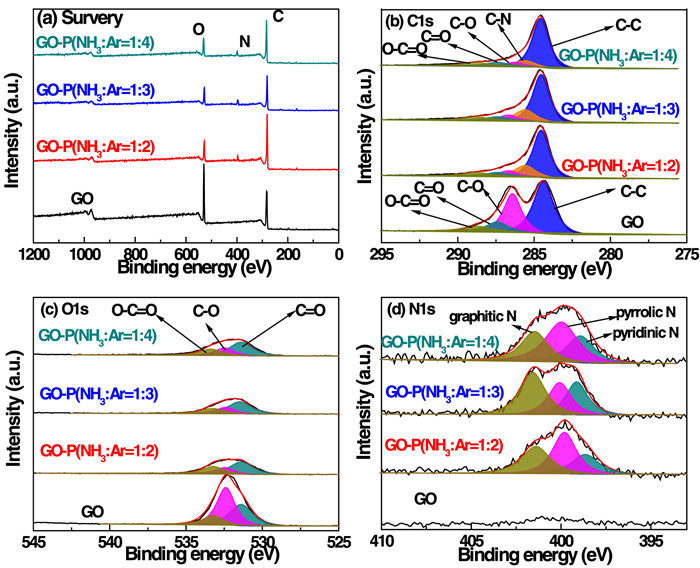
XPS was used to determine the elemental compositions of the samples, and the results are shown in figure 3. As shown in figure 3(a), no N1s XPS spectrum was detected for the GO without plasma treatment. After plasma treatment, the contents of C, O, and N were found in GO-P(NH3: Ar = 1:2), GO-P(NH3: Ar = 1:3), and GO-P(NH3: Ar = 1:4). The intensity of the C1s peak increased, the intensity of the O1s peak decreased, and there was a significant N1s peak. This was due to the plasma treatment removing some oxygen-containing functional groups, exposing more carbon, and realizing N-doping. This was consistent with the XRD results. As for the GO-P samples prepared at different ratios of NH3: Ar (figure 3(b)), C1s XPS spectra can be divided into five peaks at 284.5, 285.5, 286.7, 287.4 and 288.8 eV, respectively, corresponding to C–C, C–N, C–O, C=O and O–C=O. Compared to the C1s spectrum of GO, the new peak of C–N for the GO-P samples indicated that nitrogen doping can be realized by ammonia cold plasma treatment. As shown in figure 3(c), the XPS spectra of O1s for all the four samples can be divided into three peaks at 531.3, 532.4, and 533.2 eV, assigning to C=O, C–O, and O–C=O, respectively. The O/C atomic ratios of GO, GO-P(NH3: Ar = 1:2), GO-P(NH3: Ar = 1:3) and GO-P(NH3: Ar = 1:4) were calculated based on the XPS data, which were 0.38, 0.17, 0.18, and 0.14, respectively. These results indicated that ammonia cold plasma treatment can reduce the oxygen-containing groups.
Figure
3.
(a) XPS survey spectra of the GO-P(NH3: Ar = 1:2), GO-P(NH3: Ar = 1:3), GO-P(NH3: Ar = 1:4) and GO and their corresponding (b) C1s, (c) O1s, (d) N1s XPS spectra.
According to the XPS results, the contents of C, O, and N in GO-P(NH3: Ar = 1:2), GO-P(NH3: Ar = 1:3), GO-P(NH3: Ar = 1:4) and GO were calculated, and the results are summarized in table 1. Compared with GO, the contents of N in GO-P(NH3: Ar = 1:2), GO-P(NH3: Ar = 1:3), and GO-P(NH3: Ar = 1:4) were significantly increased, and the content of N in GO-P(NH3: Ar = 1:3) was the highest, reaching 7.6%. The N1s spectra of three samples treated by NH3 cold plasma were divided into three peaks, which were located at 398.9±0.2, 400.0±0.2, and 401.5±0.2 eV, corresponding to the peaks of pyridinic nitrogen [21], pyrrolic nitrogen [25], and graphitic nitrogen [26], respectively (figure 3(d)). The proportions of pyrrolic nitrogen in the GO-P(NH3: Ar = 1:2) and GO-P(NH3: Ar = 1:4) were relatively high. The proportion of graphitic nitrogen in the GO-P(NH3: Ar = 1:3) was relatively high, and the proportion of pyridinic nitrogen increased.
Table
1.
Elemental contents in GO-P(NH3: Ar = 1:2), GO-P(NH3: Ar = 1:3), GO-P(NH3: Ar = 1:4), and GO.
According to the peak separation results, the contents of pyridinic nitrogen, pyrrolic nitrogen, and graphitic nitrogen in the GO-P(NH3: Ar = 1:2), GO-P(NH3: Ar = 1:3), and GO-P(NH3: Ar = 1:4) were further analyzed, as summarized in table 2. The contents of graphitic nitrogen and pyridinic nitrogen in GO-P(NH3: Ar = 1:3) were the highest, with values of 42.4% and 28.7%, respectively. Graphitic nitrogen can improve the carrier mobility of an electrode material, thus reducing the internal resistance of the electrode to improve the conductivity [27]. The increase in the pyridinic nitrogen content can provide pseudocapacitance [28]. Therefore, high contents of graphitic nitrogen and pyridinic nitrogen are beneficial for improving the capacitances of N-doped graphite electrode materials. In addition, the N/C atomic ratio (0.10) of the GO-P(NH3: Ar = 1:3) was significantly higher than those of the GO-P(NH3: Ar = 1:2) (0.07) and GO-P(NH3: Ar = 1:4) (0.06). This showed that the content and state of the nitrogen doping were closely related to the discharge parameters.
Table
2.
Composition of N and N/C atomic ratios in GO-P(NH3: Ar = 1:2), GO-P(NH3: Ar = 1:3), and GO-P(NH3: Ar = 1:4).
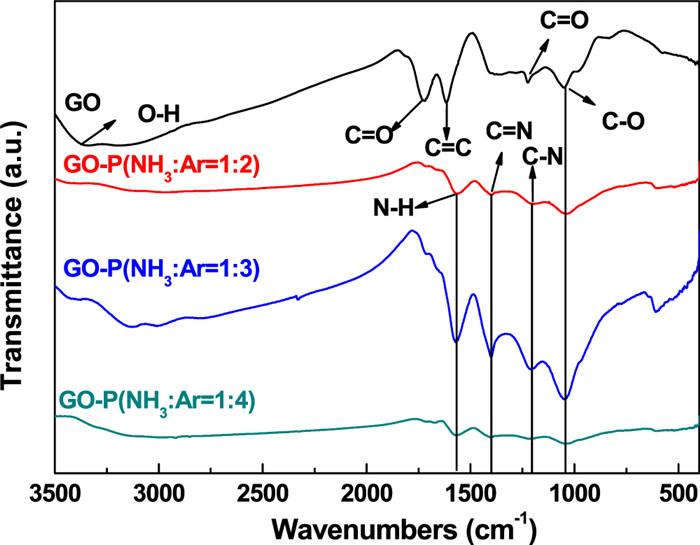
FTIR spectroscopy is often used to detect chemical bonds and active groups in samples to reflect more comprehensive chemical information. Figure 4 shows the FTIR spectra of GO-P(NH3: Ar = 1:2), GO-P(NH3: Ar = 1:3), GO-P(NH3: Ar = 1:4) and GO. It can be seen from the figure that the peaks of 1721 and 1226 cm-1 in GO correspond to the stretching vibration of C=O, and the peaks at 1619, 1046, and 3370 cm-1 correspond to the stretching vibration of C=C, C–O and O–H, respectively. After ammonia cold plasma treatment, the peak intensity of GO-P(NH3: Ar = 1:2), GO-P(NH3: Ar = 1:3) and GO-P(NH3: Ar = 1:4) at 1721 and 1619 cm-1 becomes extremely low, indicating that oxygen-containing functional groups in GO have been removed. In other words, GO is partially reduced by ammonia cold plasma [21]. In addition, new peaks are generated at 1567, 1402, 1204 cm-1, corresponding to the stretching vibration of N–H, C=N and C–N, respectively, proving that nitrogen atoms are successfully introduced into the lattice of carbon atoms [29]. The width and intensity of the three newly generated peaks are the strongest for GO-P(NH3: Ar = 1:3), indicating the optimal nitrogen doping effect at the working gas ratio of NH3: Ar = 1:3. This is consistent with the XPS results.
Figure
4.
FTIR spectra of the GO-P(NH3: Ar = 1:2), GO-P(NH3: Ar = 1:3), GO-P(NH3: Ar = 1:4), as well as GO.
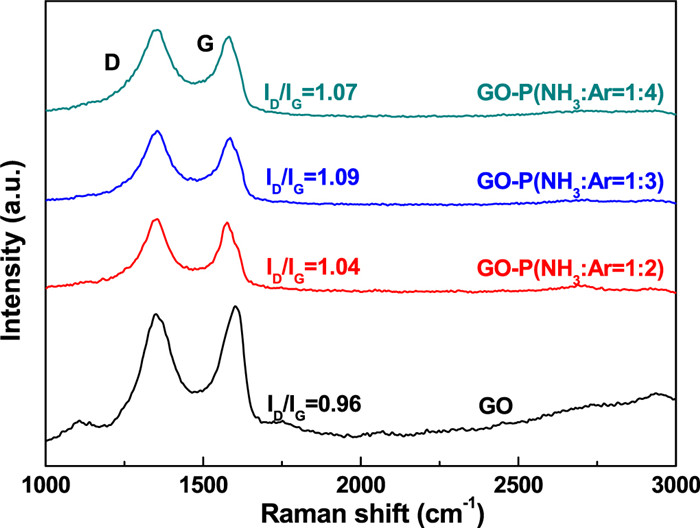
FT-Raman spectroscopy was used to analyze the GO lattice defects. The FT-Raman spectra of the GO-P(NH3: Ar = 1:2), GO-P(NH3: Ar = 1:3), GO-P(NH3: Ar = 1:4), and GO are shown in figure 5. In the Raman spectra of graphene, the D band was a defect peak, which represented the A1g symmetry mode and was attributed to the breathing vibrations of the K band side ring, that is, the sp2 bond structure of the carbon six ring, which reflected the disorder degree of the graphene sheet. The G band represents the first-order scattering E2g vibrational mode, which is used to characterize the sp2 bond structure of carbon. The strength ratio of the D band to the G band (ID/IG) is often used to evaluate the purity and defects of graphene [30]. With the increase in the ID/IG value, the disorder degree of graphene increases, and the defects in a graphene region increase. The ID/(ID+IG) ratio and the half-width of the D peak were also adopted to discuss the disorder of carbon materials [31, 32]. They have the same variation tendency as ID/IG, but the difference using ID/IG is more obvious. Therefore, ID/IG instead of ID/(ID+IG) is adopted in this work. Figure 5 shows that the D band of the GO before and after plasma treatment was located at 1352.16 cm-1. Compared with GO, the wavenumber of the G band in the GO-P after plasma treatment shifted to a lower wavenumber, which was caused by N-doping in the carbon lattice [19]. In addition, the D peak intensity increased and the G peak intensity decreased after plasma treatment. The ID/IG ratios of the GO, GO-P(NH3: Ar = 1:2), GO-P(NH3: Ar = 1:3), and GO-P(NH3: Ar = 1:4) were 0.962, 1.038, 1.088, and 1.072, respectively. The ID/IG ratio of the GO-P(NH3: Ar = 1:3) was the largest, which indicated that plasma treatment under this condition was more conducive to the increase in the GO disorder, which was mainly caused by N-doping and edge defects [33].
Figure
5.
Fourier-transform Raman (FT-Raman) spectra of the GO-P(NH3: Ar = 1:2), GO-P(NH3: Ar = 1:3), GO-P(NH3: Ar = 1:4), and GO.
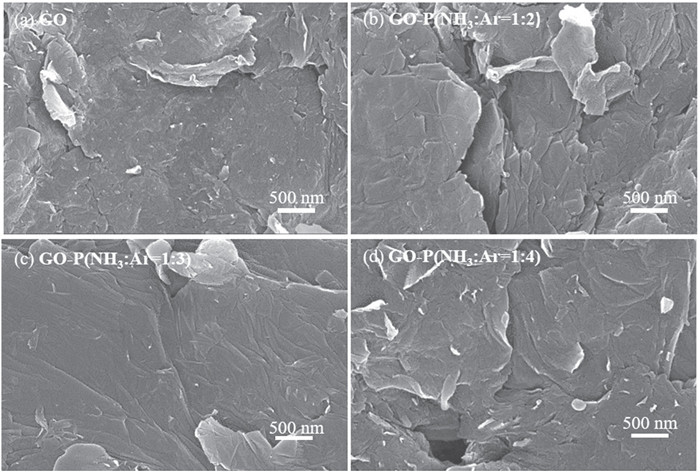
The surface morphology of the GO before and after plasma treatment was characterized by SEM, and the results are shown in figure 6. As shown in figure 6(a), the surface of the GO without plasma treatment had no evident wrinkles and was relatively rough, which was mainly due to the presence of oxygen-containing groups [34]. Figures 6(b)–(d) show that folds were present on the surfaces of the GO-P(NH3: Ar = 1:2), GO-P(NH3: Ar = 1:3), and GO-P(NH3: Ar = 1:4) prepared by NH3 cold plasma, which was due to the reduction of GO, N-doping, and defects caused by plasma bombardment. The wrinkles of the GO-P(NH3: Ar = 1:3) were the most evident, which was mainly due to this material having the highest degree of N-doping and the most defects. The existence of wrinkles was conducive to the full contact between the electrode material surface and the electrolyte, thus improving the capacitance of the electrode material [35].
Figure
6.
Typical SEM images of (a) GO, (b) GO-P(NH3: Ar = 1:2), (c) GO-P(NH3: Ar = 1:3), and (d) GO-P(NH3: Ar = 1:4).
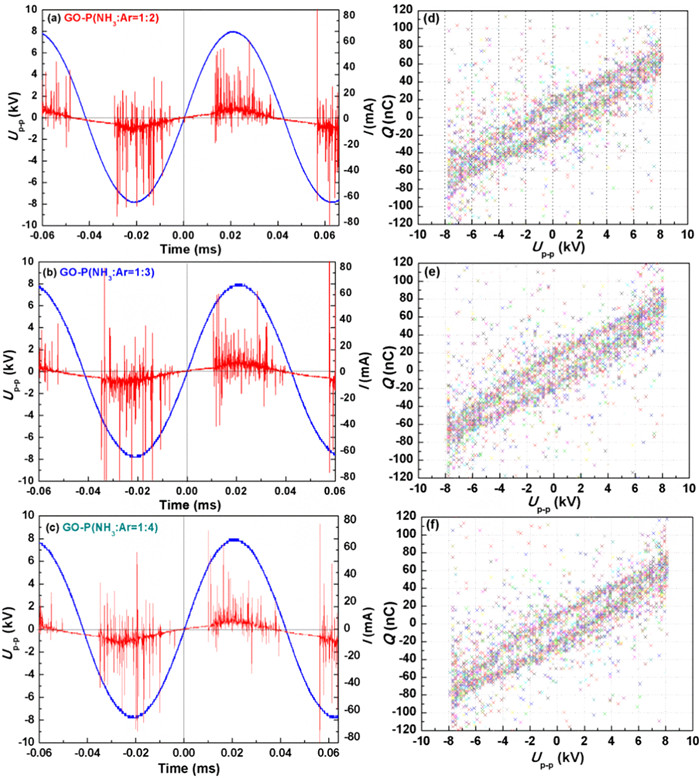
Figure 7 presents the discharge voltage and current waveforms of NH3 plasma for processing GO under different NH3: Ar ratios (1:2, 1:3, 1:4), as well as the corresponding Lissajous images. A large number of intense pulse micro-discharges appeared in all of the three discharge current waveforms, belonging to the typical filamentary discharge form of dielectric barrier discharge. With the variation of the ratio of NH3: Ar, the number and amplitude of discharge current pulses changed greatly. When the ratio of NH3: Ar was 1:3, the number and amplitude of discharge current pulses are the largest. This is because the ionization energy of NH3 (10.2 eV) is lower than the excitation energy of metastable Ar (13.5 eV). Adding NH3 to Ar can promote the Penning ionization of Ar and NH3 to generate a large number of free electrons, thereby reducing the discharge breakdown voltage [36]. The ratio of NH3: Ar has great influence on the Penning ionization process. When the ratio of NH3: Ar was 1:3, the discharge current has the largest number of pulses and the largest amplitude. This is because when the discharge voltage was kept the same, the breakdown voltage of the mixed gas at an optimal ratio will be decreased; thereby a more efficient Penning ionization process will appear accordingly. In addition, all of the Lissajous figures showed well closed parallelogram patterns, and the discharge power was basically the same (13.6 W) under different NH3: Ar ratios.
Figure
7.U–I waveforms of NH3 plasma for processing GO with the ratios of NH3: Ar of (a) 1:2, (b) 1:3, (c) 1:4, and (d)–(f) the corresponding Lissajous images.
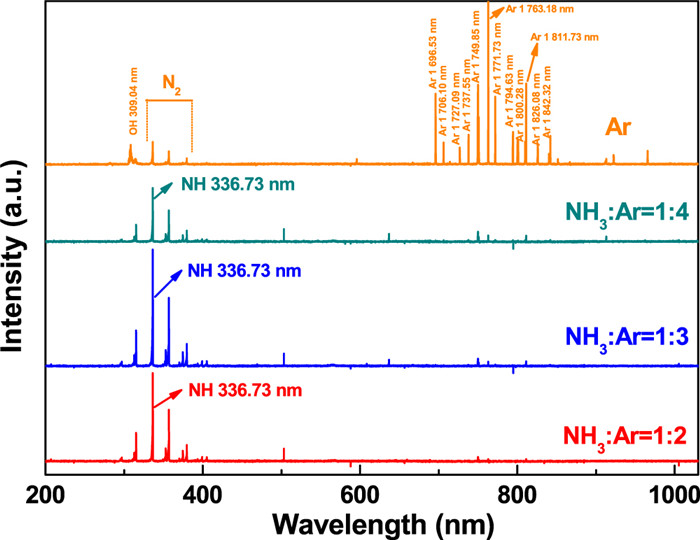
Figure 8 illustrates the in situ optical emission spectra of NH3 plasma for processing GO with the ratios of NH3: Ar of 1:2, 1:3, 1:4, and pure argon at 15.60 kV discharge voltage. Under pure Ar atmosphere, the emission spectrum was concentrated in the range of 690–850 nm corresponding to the excited state of Ar. Hydroxyl radicals were found at around 309.04 nm, which were generated by the collision of high-energy electrons and metastable Ar with water molecules. The small amount of water may come from Ar or water molecules adsorbed on GO. In addition, N2 spectra were also found at around 337.10, 357.59, and 380.49 nm, ascribing to the tiny gap discharge (air atmosphere) between the plasma reactor and the ground electrode. Compared with pure Ar spectra, by adding NH3 into Ar, an obvious NH transition peak appeared at 336.73 nm, which is caused by the collision of NH3 molecules with high-energy electrons and metastable argon atoms [36, 37]. The intensity of the NH transition peak varied with the change of the ratio of NH3: Ar. Under 1:3 ratio of NH3: Ar, the maximum intensity of the NH peak appears, indicating that more NH radicals were generated. This is consistent with the discharge results. It indicated that at 1:3 ratio of NH3: Ar, NH3 plasma can efficiently facilitate N-doping of GO, and the graphite nitrogen will be selectively generated as indicated by the XPS results. In the future, the influence of relevant active species and plasma parameters on the N-doping form and content will be further investigated.
Figure
8.In situ optical emission spectra of NH3 plasma for processing GO with the ratios of NH3: Ar of 1:2, 1:3, 1:4, and pure argon.
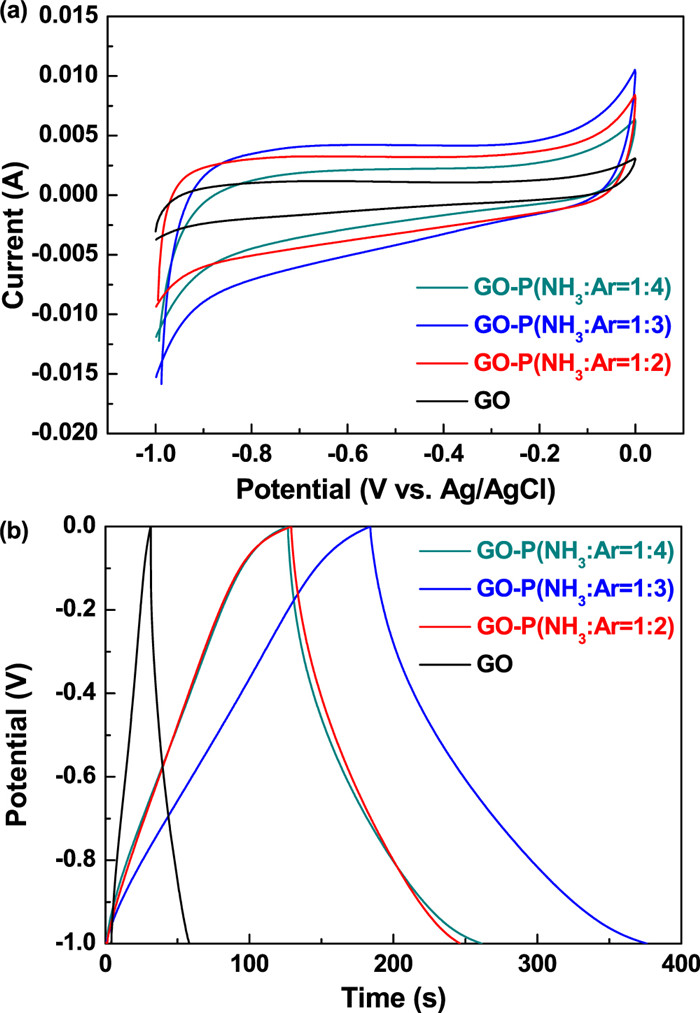
The electrochemical performances of the GO-P(NH3: Ar = 1:2), GO-P(NH3: Ar = 1:3), GO-P(NH3: Ar = 1:4), and GO were evaluated by CV and GCD, and the results are shown in figure 9. The CV curves of the four samples at a scan rate of 10 mV·s-1 are shown in figure 9(a). The CV curves of the four samples were completely closed. Compared with the CV curve of the GO, the curve shapes of the GO-P(NH3: Ar = 1:2), GO-P(NH3: Ar = 1:3), and GO-P(NH3: Ar = 1:4) were slightly different. The curves of these materials retained the electric double layer shape of carbon materials and warped upward and downward, which was caused by nitrogen doping. Based on the area surrounded by the CV curve, the GO-P(NH3: Ar = 1:3) had the largest curve area, that is, it had the largest specific capacitance. The charge and discharge tests of the GO, GO-P(NH3: Ar = 1:2), GO-P(NH3: Ar = 1:3), and GO-P(NH3: Ar = 1:4) were carried out under a current density of 1 A·g-1, as shown in figure 9(b). The specific capacitances of the GO, GO-P(NH3: Ar = 1:2), GO-P(NH3: Ar= 1:3), and GO-P(NH3: Ar = 1:4) were 26.4, 124.5, 187.7, and 134.6 F·g-1, respectively. The specific capacitance of the GO-P(NH3: Ar = 1:3) was the largest, which was 7.1 times that of the GO without plasma treatment. This was due to the formation of N-doping after NH3 cold plasma treatment. Under the condition with NH3: Ar = 1:3, the samples had the greatest amount of N-doping and number of defect sites, and the contents of graphitic and pyridinic nitrogen increased. This led to a decrease in internal resistance and an increase in pseudocapacitance, thereby resulting in a maximum specific capacitance. Those were consistent with the characterization results of XRD, XPS and FT-Raman. The effect of the discharge time during NH3 cold plasma treatment on the electrochemical performance of the GO was also investigated under the condition of NH3: Ar = 1:3. CV and GCD diagrams are shown in figure S1. The results showed that the sample had the highest specific capacitance when the NH3 cold plasma was treated for 40 min. The NH3 cold plasma treatment could effectively improve the specific capacitances of the electrode materials, and the plasma treatment conditions had an important influence on the treatment effect. In view of the complexity of the plasma influence mechanism, the plasma treatment mechanism will be discussed in subsequent papers.
Figure
9.
(a) Cyclic voltammetry (CV) curves at a scan rate of 10 mV·s-1 in 6 M KOH and (b) galvanostatic charge–discharge (GCD) curves at a current density of 1 A·g-1 for the GO-P(NH3: Ar = 1:2), GO-P(NH3: Ar = 1:3), GO-P(NH3: Ar = 1:4), and GO.
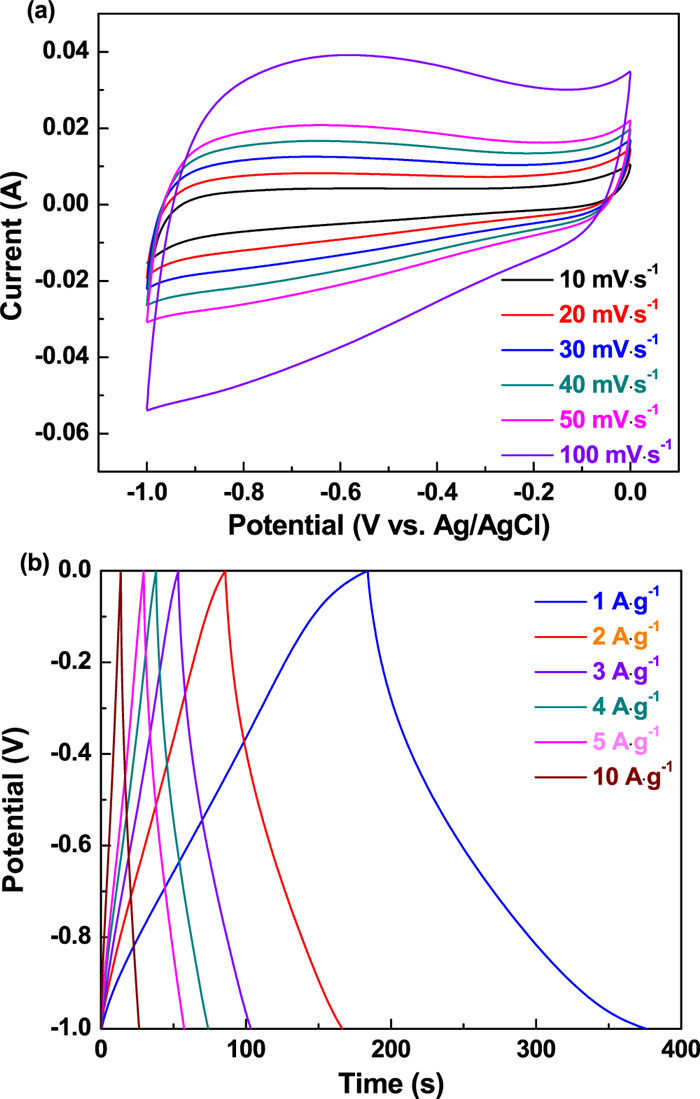
Figure 10(a) shows the CV curves of the GO-P(NH3: Ar = 1:3) at different scanning rates and a potential range of -1 to 0 V. The CV curves at different scanning rates formed closed shapes, consistent with the characteristics of an electric double layer and indicating good reversibility. However, the CV curve was slightly distorted due to the pseudocapacitance effect caused by the N-doping [21]. In addition, with the increase in the scanning rate, the current responses of the CV curves of the GO-P(NH3: Ar = 1:3) sample also increased, which indicated that it had a good current response ability and electrochemical performance. Figure 10(b) shows the charge–discharge electrogram of the GO-P(NH3: Ar = 1:3) under different current densities. The charge and discharge curves of the GO-P(NH3: Ar = 1:3) electrode formed an approximately symmetric isosceles triangle, which indicated that the charge and discharge times of this electrode were basically the same. This was consistent with the charge and discharge curves in an ideal state. A few arcs of the charge and discharge curves indicated that pseudocapacitance was produced by redox reactions, which indicated that the GO lattice of the GO-P(NH3: Ar = 1:3) contained N. The specific capacitances of the GO-P(NH3: Ar = 1:3) were 187.7, 161.4, 149.3, 142.4, 139.2, and 126.3 F·g-1 at current densities of 1, 2, 3, 4, 5, and 10 A·g-1, respectively.
Figure
10.
(a) CV curves of the GO-P(NH3: Ar = 1:3) at different scanning rates and (b) GCD curves of the GO-P(NH3: Ar = 1:3) at different current densities.
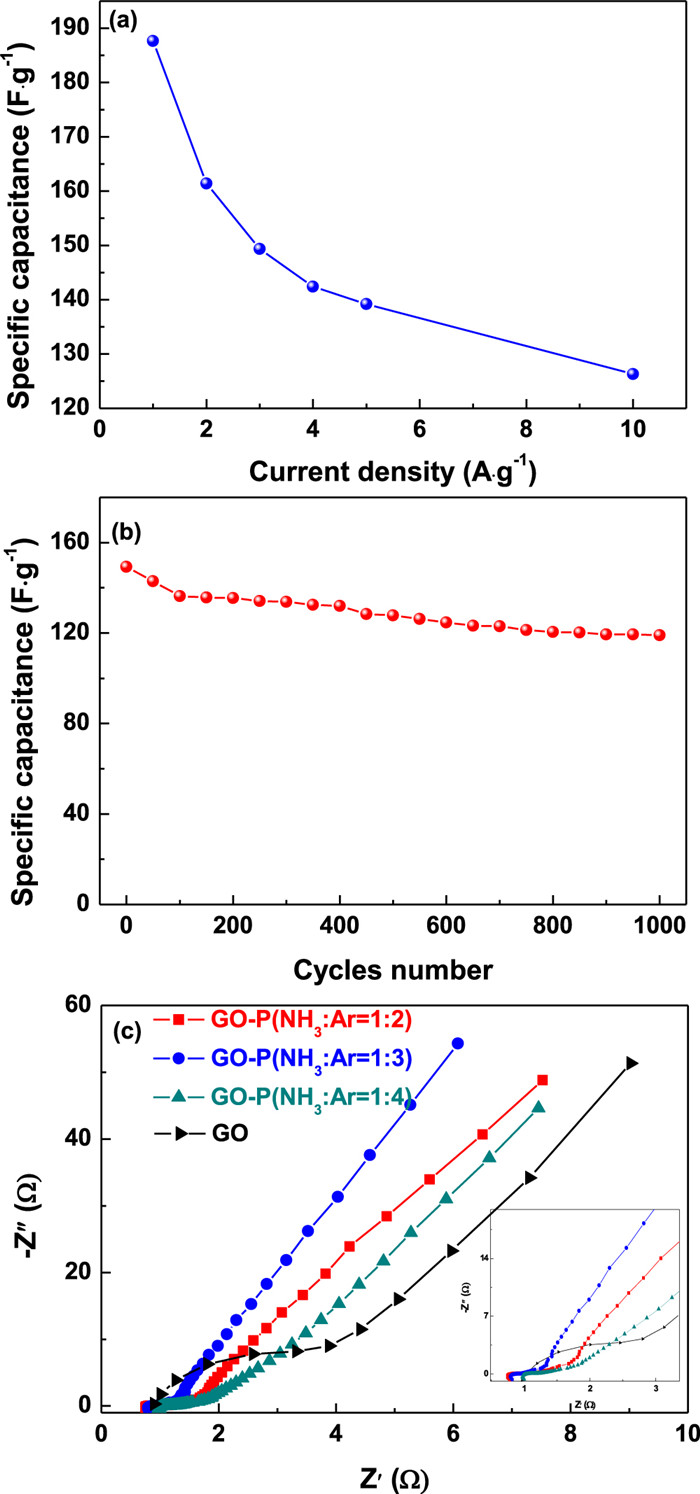
Figure 11(a) shows the specific capacitance curve of the GO-P(NH3: Ar = 1:3) at different current densities. The specific capacitance decreased with the increase in the current density. However, the GO-P(NH3: Ar = 1:3) still had a good capacitance retention at a high current density, showing a high ratio performance (67.3%). Figure 11(b) shows the cyclic performance of the GO-P(NH3: Ar = 1:3) at a 3 A·g-1 current density. After 1000 cycles of charge and discharge, the GO-P(NH3: Ar = 1:3) exhibited an 80% capacitance retention rate, and thus, it exhibited a good cycling performance. Figure 11(c) shows the Nyquist diagram of the GO-P(NH3: Ar = 1:2), GO-P(NH3: Ar = 1:3), GO-P(NH3: Ar = 1:4) and GO electrodes. The four samples showed a good linear relationship in the low-frequency region and formed an arc shape in the high-frequency region [38].
Figure
11.
(a) Specific capacitance under different current densities and (b) cycling performance at a current density of 3 A·g-1 for the GO-P(NH3: Ar = 1:3). (c) Nyquist plots of the GO, GO-P(NH3: Ar = 1:2), GO-P(NH3: Ar = 1:3) and GO-P(NH3: Ar = 1:4).
The larger the slope of the line was, the better the contact between electrode material and electrolyte was, and the lower the resistance was. The linear slope of the GO-P(NH3: Ar = 1:3) was the largest in the low-frequency region, and the curvature of the arc in the high-frequency region was the smallest. This means that it had the minimum resistance and largest conductivity, which was conducive to the fast entry of ions into the electrode, thus facilitating the improvement of the electrical performance.
The specific capacitance data of N-doped carbon-based electrodes prepared by different carbon sources and dopants are listed in table 3. Compared with the results of literature, the electrode materials prepared in this work exhibited better specific capacitances at the current density of 1 A·g-1. This showed that high-performance electrode materials of a supercapacitor can be prepared by NH3 cold plasma.
Table
3.
Comparison of N-doped carbon-based capacitors reported in the literature.
High-performance N-doped graphite oxide (GO-P) was successfully prepared by the cold plasma treatment of graphite oxide (GO) in a mixture of NH3 and Ar. With an NH3: Ar ratio of 1:3, the GO-P(NH3: Ar = 1:3) prepared by NH3 cold plasma exhibited the best performance. The specific capacitance of the GO-P(NH3: Ar = 1:3) was 187.7 F·g-1, which was 7.1 times that of untreated GO at a current density of 1 A·g-1. The capacitance retention rate of the GO-P(NH3: Ar = 1:3) was 80% when it was cycled 1000 times in 6 M KOH at a 3 A·g-1 current density. The characterization results showed that the NH3 cold plasma could effectively reduce GO, produce N-doped GO, and produce more active defects. The GO-P(NH3: Ar = 1:3) had the highest N/C ratio, the most defect sites, and the highest contents of pyridinic nitrogen and graphitic nitrogen, which were conducive to providing pseudocapacitance and reducing the internal resistance of the electrode. Therefore, the GO-P(NH3: Ar = 1:3) exhibited excellent electrochemical performances. The results of discharge parameters measurement and in situ optical emission spectroscopy diagnosis of NH3 plasma showed that the discharge is the strongest when the ratio of NH3: Ar was 1:3, thereby the generated nitrogen active species can effectively promote N-doping. NH3 cold plasma can easily and rapidly control the preparation of high-performance N-doped GO, and it avoids high temperature roasting or the application of a large number of chemical reagents. Thus, it has important potential application value in the field of supercapacitors.
Acknowledgments
This work is supported by National Natural Science Foundation of China (Nos. 52077024, 21773020, 21673026, 11505019), State Key Laboratory of Structural Analysis for Industrial Equipment, and Dalian University of Technology (No. GZ21105).
Feng, L., Liu, S., Bu, Q. et al. Erosion of stainless steel electrodes in a high-repetition-rate gas spark switch. Journal of Physics: Conference Series, 2024, 2903(1): 012004.
DOI:10.1088/1742-6596/2903/1/012004
2.
Dong, K., Wu, G., Qian, P. et al. Research on dynamic characteristics of arc under electrode relative motion. Plasma Science and Technology, 2023, 25(4): 045502.
DOI:10.1088/2058-6272/ac9ddf
3.
Li, L.. High Current Pulsed Gas Gap Switch. Springer Series in Plasma Science and Technology, 2023.
DOI:10.1007/978-981-99-1141-7_2
4.
Dong, K., Wu, G., Qian, P. et al. Research on Motion Characteristics of Arc at Low Air Pressure. 2023.
DOI:10.1109/PandaFPE57779.2023.10140216
5.
Mei, D., Zhang, S., Tang, J. Special issue on selected papers from HVDP 2020. Plasma Science and Technology, 2021, 23(6): 060101.
DOI:10.1088/2058-6272/ac02ab

 DownLoad: